3234
Population Arterial Input Function for Lung Perfusion Imaging1Bioxydyn Ltd, Manchester, United Kingdom, 2MCMR, Manchester University NHS Foundation Trust, Manchester, United Kingdom, 3Centre for Imaging Sciences,, University of Manchester, Manchester, United Kingdom, 4POLARIS, Imaging Sciences, Department of Infection, Immunity and Cardiovascular Disease, The University of Sheffield, Sheffield, United Kingdom, 5Centre for Medical Image Computing, University College London, London, United Kingdom
Synopsis
In this work, we explore the possibility of extracting a population Arterial Input Function (AIF) to be used in the quantification of lung perfusion using T1-weighted contrast agent-based perfusion imaging. The population AIF averages the shape of first pass of the CA bolus at high temporal resolution in the pulmonary arteries from 90 scans acquired in 50 patients with interstitial lung disease. The population AIF is then scaled by the patient weight. The results of the analysis using a measured AIF and the population AIF are compared.
Introduction
T1-weighted contrast agent (CA)-based perfusion imaging characterizes the first pass of a CA bolus through the lung, allowing for the measurement of blood flow, blood volume and mean transit time [1]. One of the method’s challenges is the accurate extraction of the Arterial Input Function (AIF), the concentration of CA in the feeding artery. Some of the issues that may arise include: curve sampling at too low temporal resolution; errors in the peak height due to signal saturation at high CA concentrations; incomplete spoiling; partial volume and inflow effects; and motion. Previous investigators have used consensus or population-based AIF in the analysis of extended dynamic contrast-enhanced MR data [2]. However, it is not known whether population-based AIFs are also useful in perfusion imaging based on first-pass DCE-MRI. In this work, we explore the possibility of extracting a population AIF for lung perfusion imaging, detailing the first pass of the CA bolus at high temporal resolution in the pulmonary arteries (PA). The results of the analysis using a measured AIF and the population AIF are compared.Methods:
51 patients with interstitial lung disease underwent thoracic perfusion MRI at 1.5 T (Signa HDxt GE). The study protocol comprised 2 MRI scans, 6 weeks or 6 months apart depending on the specific diagnosis. A total of 90 scans were available at the time of writing. The MR protocol comprised four coronal fast 3D SPGR variable flip angle datasets to calculate baseline T1 (TE/TR= 0.9/2.85 ms, BW= 62.5 kHz, FOV= 48 cm, acquisition matrix 200x80x60, FA= 2,4,10,30 deg). These were followed by a view-sharing dynamic acquisition (TE/TR= 0.7/2 ms, FA= 20⁰, BW= 125 kHz, FOV= 48 cm, matrix= 200x80x24, temporal phases= 48, acquisition time per frame 0.56 s, ASSET/SENSE factor= 2, turbo mode= 2). At the start of this acquisition, a bolus injection of 0.06 mL/kg gadoteric acid (Dotarem, Guerbet, Villepinte, France) was administered in the left antecubital vein by a power injector at 2 mL/s followed by a saline flush at 4 mL/s. All images were acquired at end expiration breath hold. Lungs were manually segmented and an ROI in the main trunk of the PA was defined to derive individual AIFs. Signal curves were converted into concentration-time curves and the AIFs (CAIF(t)) were fitted by a gamma variate (GV) curve described by the following equation[3]:\begin{cases}0 & t< t_{start}\\ \frac{AUC}{C^{B+1}B^B\sqrt{\pi B}e^{-B+1/(12B)}} \cdot ({t-t_{start} })^B \cdot e^{(\frac{t-t_{start}}{C})}&t\geq t_{start}\end{cases}
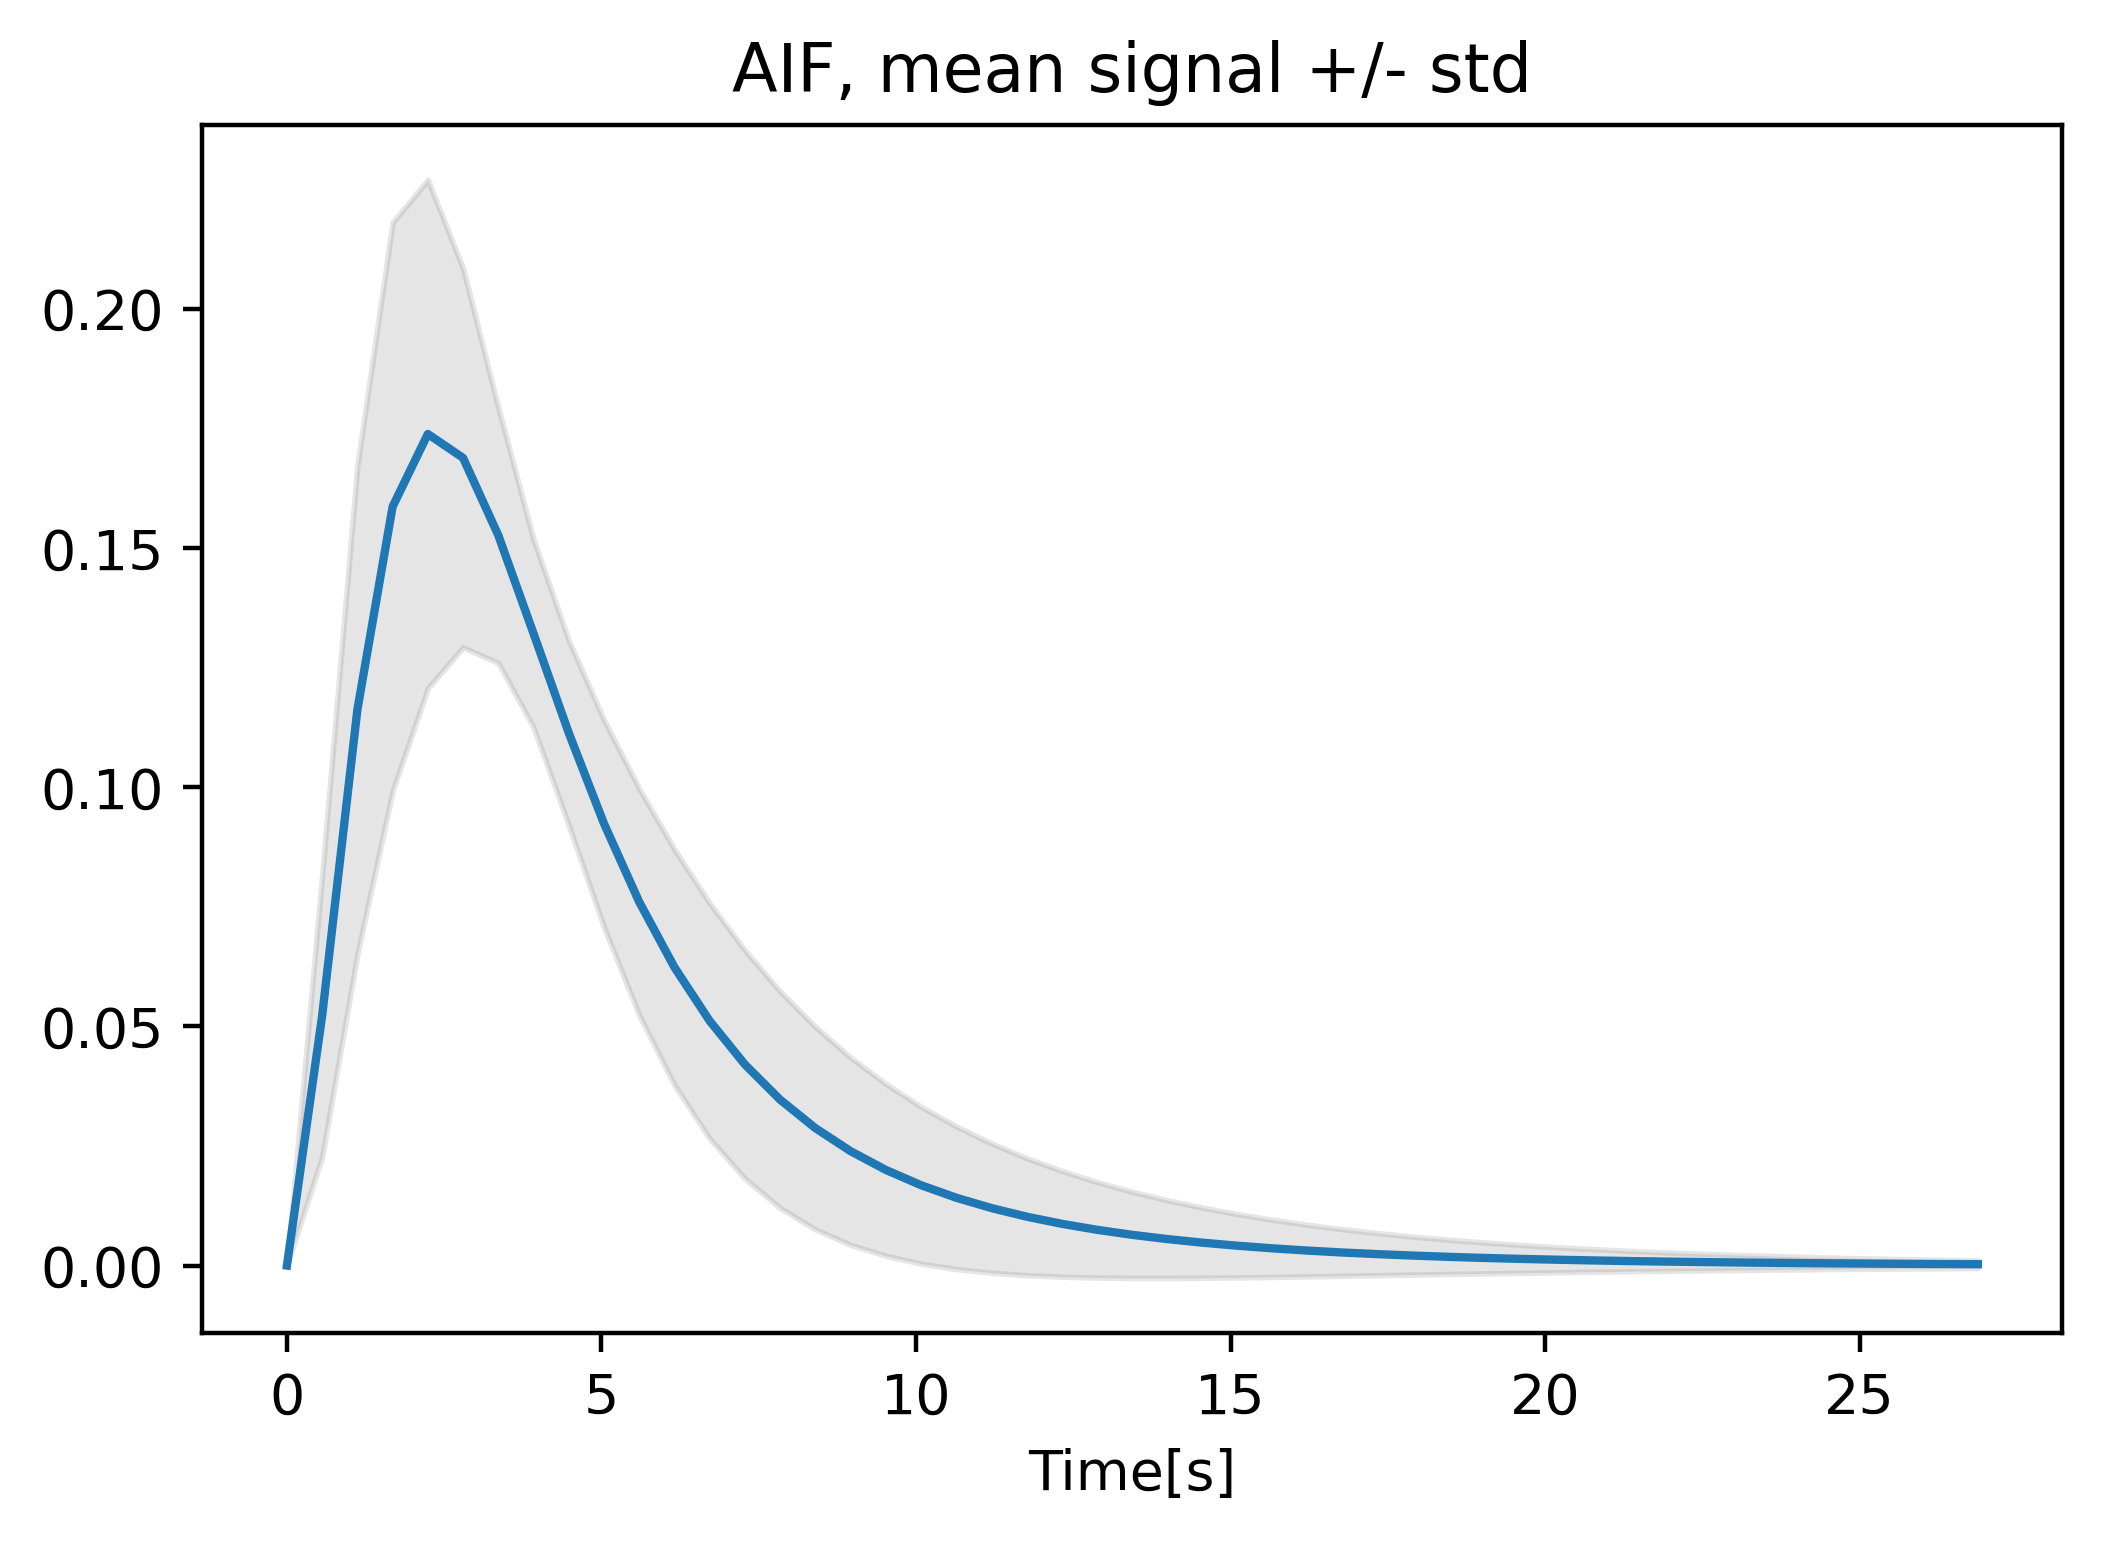
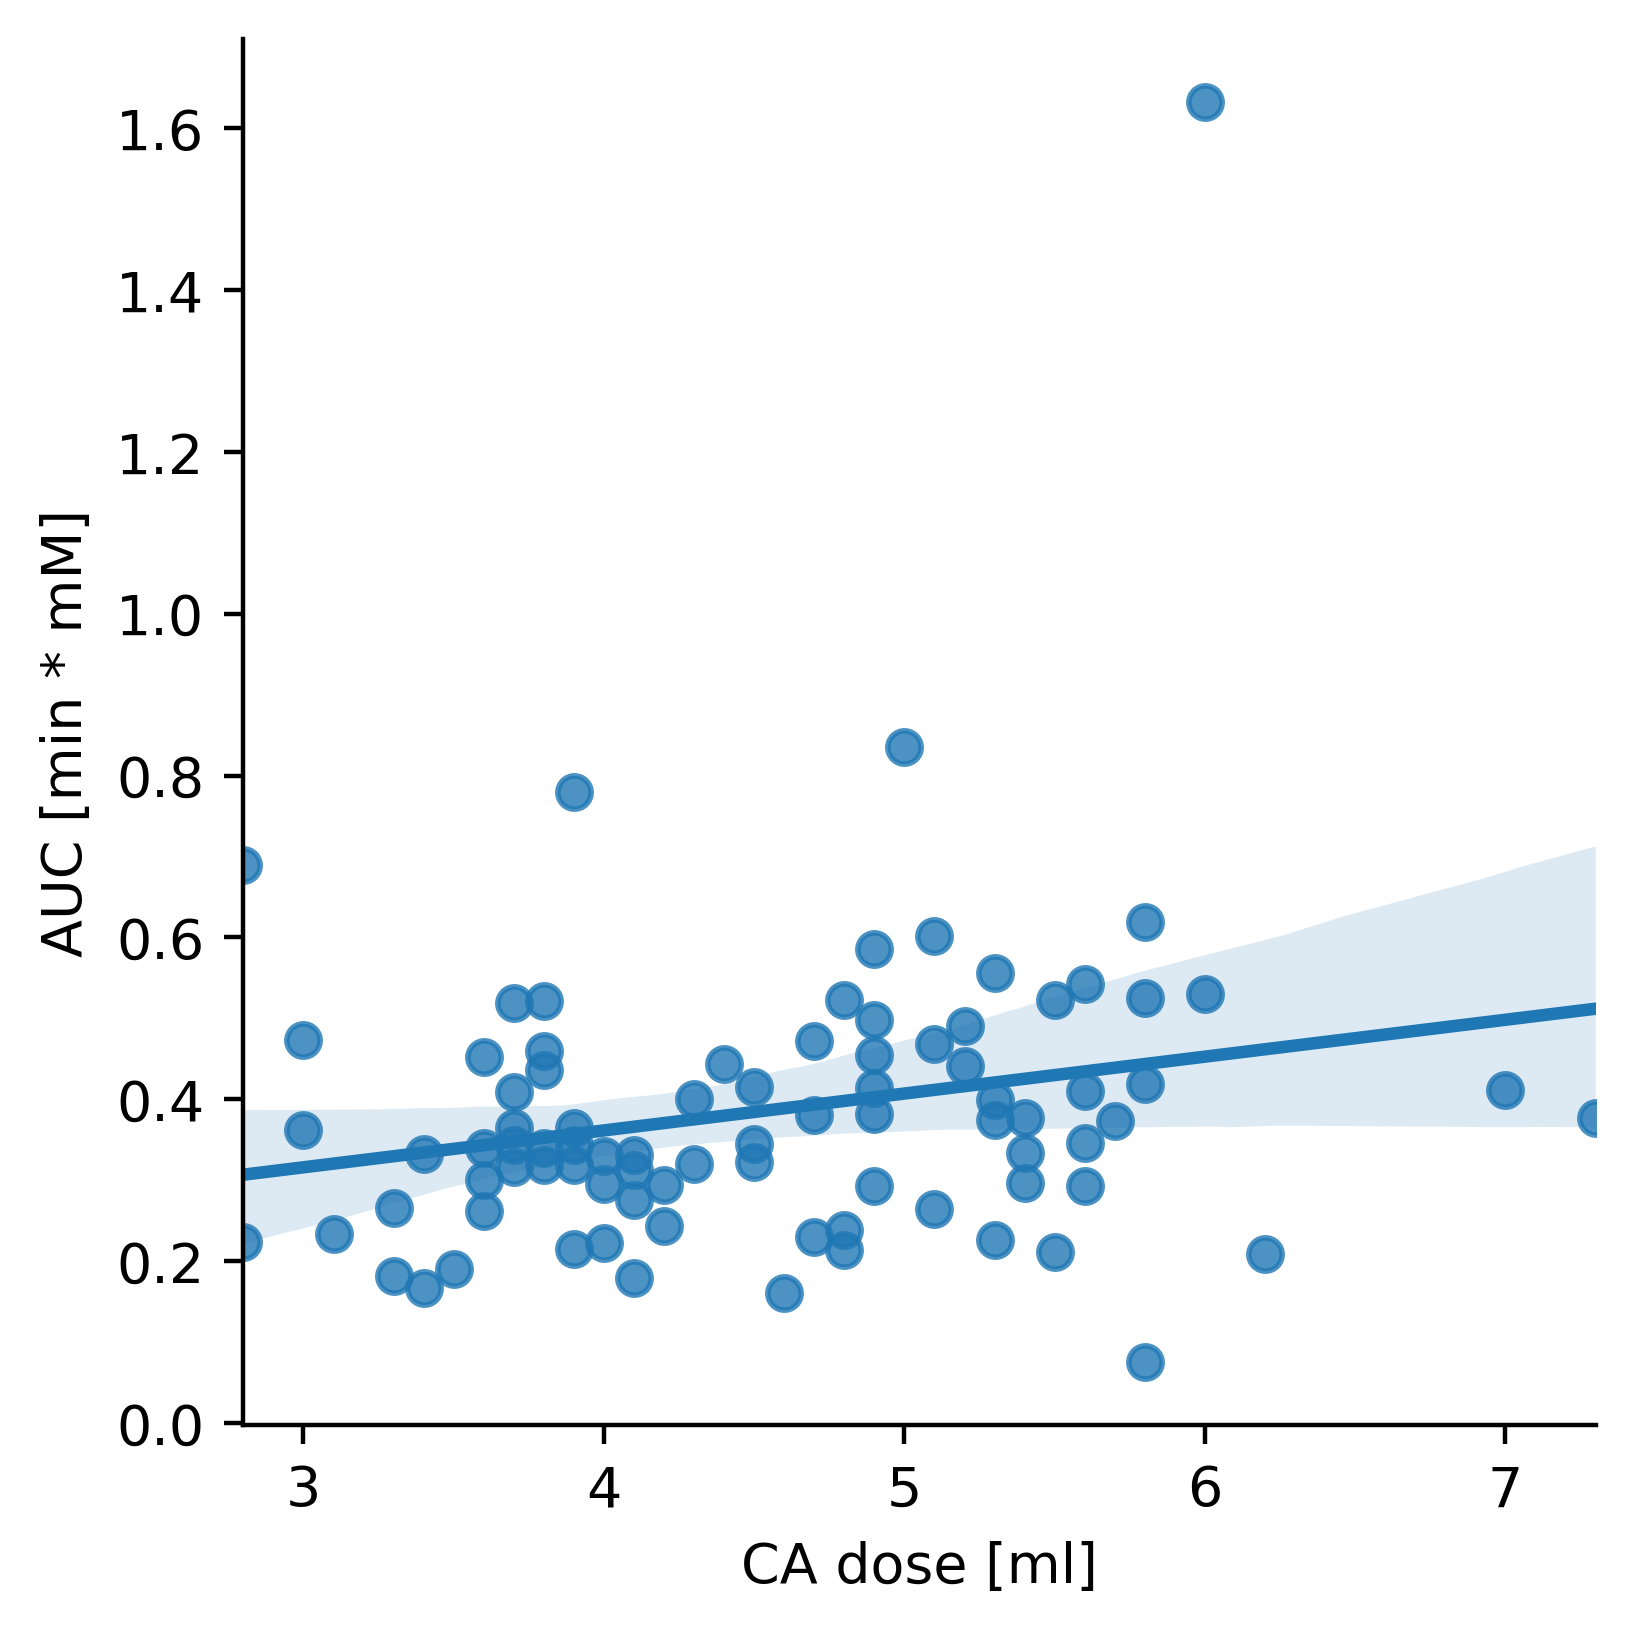
where parameters B, C define the shape of the curve, tstart is the distance between the start of the acquisition and the start of the curve. AUC is the area under the concentration-time curve. The resulting fitted AIFs (with tstart=0 and AUC=1) were averaged to obtain a population AIF (figure 1). The relationship between each AIF and dose was determined by linear regression of the AUC against dose, based on the known relationship between cardiac output and weight [4]. The correlation between the AIF GV parameters (C,B) and dose was calculated (Pearson correlation), to determine if these also vary with dose. Data from each patient were then analysed twice, with the individual measured AIF and the population AIF, scaled for dose, as input. Concentration-time curves in the lung were also fitted with the GV prior to the analysis.
Blood volume was calculated as $$$BV=\frac{\intop\nolimits_{0}^{\infty}C(t)dt}{\intop\nolimits_{0}^{\infty} C_{AIF}(t)dt}$$$. Blood Flow (BF) was determined by deconvolution of CAIF(t) from C(t) according to indicator dilution theory. Mean transit time was defined as MTT = BV/BF. Mean and std values over the whole lung for BV, MTT and BF obtained with the two AIFs were compared using a paired t-test
Results
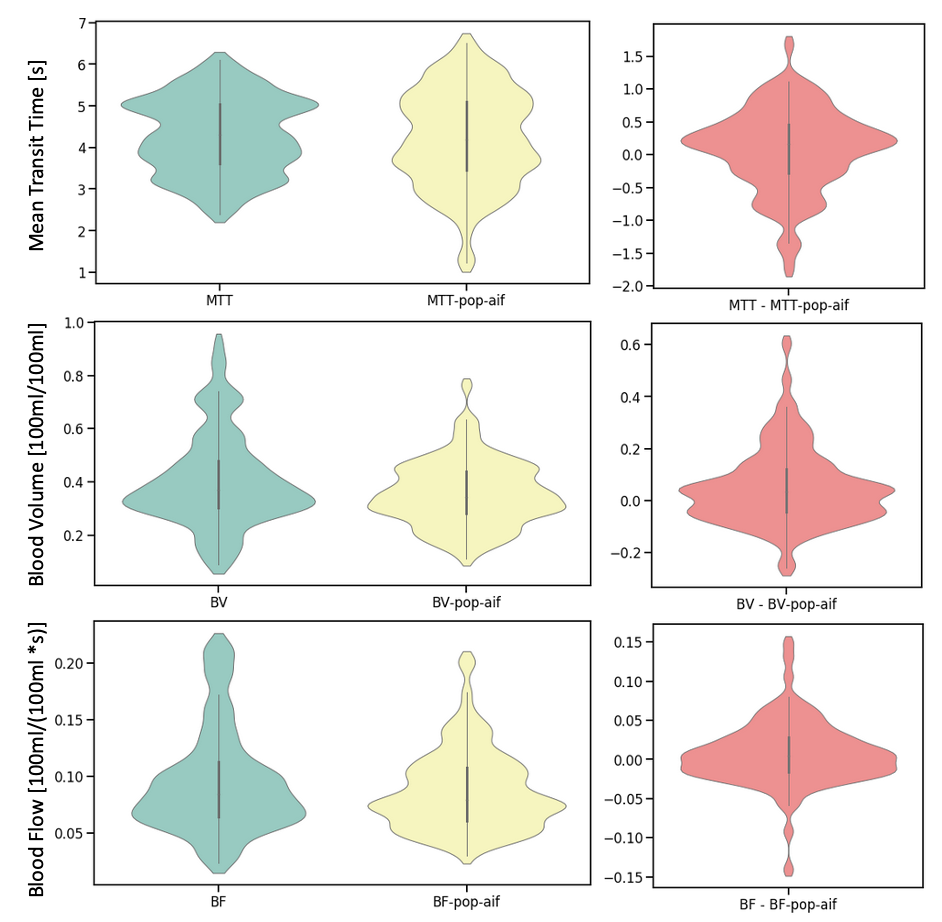
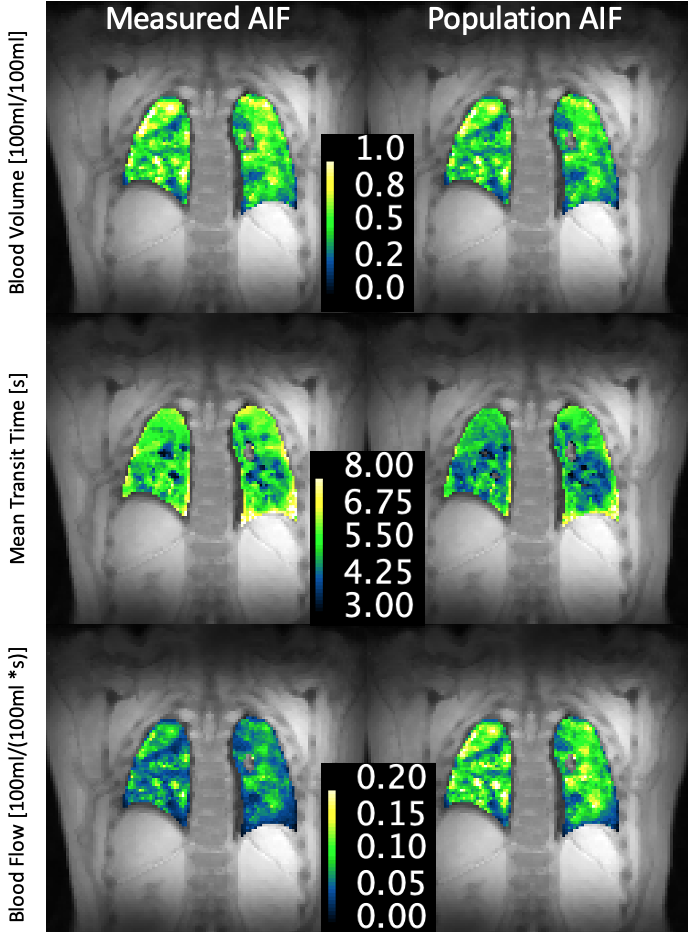
The obtained population AIF is visualized in figure 1. The linear regression between dose and measured AUC is visualized in figure 2. The parametrization of the individual AIFs (parameters B and C) did not show any significant correlation with injected volume of contrast agent (p=0.45, p=0.82). The resulting patients’ BV, MTT and BF distributions obtained with the two AIFs are shown in figure 3, while an example of the perfusion maps obtained in a subject is presented in figure 4. Over the group as a whole, BV is higher if calculated with a measured AIF than with the population AIF (0.41± 0.17 100ml/100ml, vs 0.35 ± 0.12 100ml/100ml, p-value=0.001). MTT (measured AIF: 4.29 ± 0.92 s, population AIF: 4.21 ± 1.15 s, p-value= 0.219) and BF (measured AIF: 0.0095 ± 0.046 100ml/100ml/s, population AIF: 0.877± 0.035 100ml/100ml/s, p-value=0.08).Comments
A population AIF was obtained from the PA. While there is significant variation among the GV fitting from which the population AIF was obtained, the variation is not related to dose, however, the AUC is linearly related to dose. When comparing the results of the perfusion analysis within our patient population, the only significant difference was observed in in BV, which is lower when calculated using a population AIF. This is probably due to some of the measured AIF presenting an AUC that is too low in comparison to the patients data.Conclusion
In this work, we have derived a population AIF for perfusion quantification in the lung. This AIF may be of use in settings where measured AIF quality is insufficient to allow reliable quantification.Acknowledgements
The research leading to these results received funding from the Innovative Medicines Initiatives 2 Joint Undertaking under grant agreement No 116106. This Joint Undertaking receives support from the European Union’s Horizon 2020 research and innovation programme and EFPIA.
References
(1): Sourbron, Steven P., and David L. Buckley. "Classic models for dynamic contrast‐enhanced MRI." NMR in Biomedicine 26.8 (2013): 1004-1027. (2) : Parker GJ, Roberts C, Macdonald A, Buonaccorsi GA, Cheung S, Buckley DL, Jackson A, Watson Y, Davies K, Jayson GC. Experimentally-derived functional form for a population-averaged high-temporal-resolution arterial input function for dynamic contrast-enhanced MRI. Magn Reson Med 2006;56(5):993-1000. (3) Li, Xingfeng, Jie Tian, and R. K. Millard. "Erroneous and inappropriate use of gamma fits to tracer-dilution curves in magnetic resonance imaging and nuclear medicine." Magnetic resonance imaging 21.9 (2003): 1095-1096. (4) Evans JM, Wang S, Greb C, et al. Body Size Predicts Cardiac and Vascular Resistance Effects on Men's and Women's Blood Pressure. Front Physiol. 2017;8:561. Published 2017 Aug 9. doi:10.3389/fphys.2017.00561Figures