3229
Simulation of Lung Parenchyma MRI and Field-Strength Dependence1Biomedical Engineering, University of Southern California, Los Angeles, CA, United States, 2Ming Hsieh Department of Electrical and Computer Engineering, University of Southern California, Los Angeles, CA, United States
Synopsis
MRI of lung parenchyma is limited by low proton density and susceptibility effects at air-tissue interfaces. Recent high-performance low-field MRI systems have provided a new opportunity to mitigate the latter issue. In this work, we demonstrate a framework for simulating lung MRI across B0 field strengths. We estimate apparent transverse relaxation due to proximity to A) sub-voxel alveoli, and B) bronchial tree. Alveoli are modeled using face-centered cubic close packing. The bronchial tree is modeled using a recent XCAT phantom.
Introduction
MRI of lung parenchyma is limited by low proton density and susceptibility effect at air-tissue interfaces. Recent high-performance low-field MRI systems have provided a new opportunity to mitigate the latter issue1,2. We aim to develop a lung parenchyma MRI simulator3,4 that can help us understand measurements on such systems, and also to explore the dependence on B0 field strength and imaging parameters, that could eventually lead to more optimal imaging.We estimate apparent transverse relaxation due to proximity to A) alveoli, and B) bronchial tree. These are denoted by intravoxel dephasing rates R2a and R2b, respectively. The susceptibility effect of alveoli modeled by multiple Lorentz spheres with parenchyma spins in the static refocusing regime5. The effect of the bronchial tree is evaluated using a recent high-resolution Extended Cardiac-Torso Phantom (XCAT)4. We use simulation to explore the dependence of R2a on B0 and volume fraction, and the dependence of R2b on B0 and spatial resolution.
METHODS
Bronchial Tree SimulationSignal loss due to bronchial tree proximity will be spatially varying, resolution dependent, and B0 dependent. We begin with a recent lung XCAT phantom that includes airway and bronchial tree, parenchyma, and vessels, digitized with an isotopic 0.253 mm3 resolution and FOV: 45x30x30 cm3. Lung parenchyma susceptibility was assumed to be that of water6. We then generate relative difference field (RDF) maps with a Fourier-based convolution method7, and then reduce resolution using Fourier truncation. We simulate echo times (TEs) of 0, and from 271 to 5000 ms with a multiplicative step = 1.06. These were used to perform fitting.
A parenchyma mask was generated from 0.25x0.25x0.25 mm3 images by Fourier truncation and thresholding with a threshold value of 75% of normalized intensity for various spatial-resolution cases. We simulate coronal imaging with in-plane resolutions ranging from 1 to 2mm2 with fixed slice thickness of 6mm at 0.55T, 1.5T and 3T.
Alveolar simulation
Alveoli are typically 200-500 µm in diameter8, far smaller than the finest realistic resolution for lung MRI, and occupy 61%-73% volume fraction in parenchyma depending on respiratory phase 9. A fundamental block is created as a cube with 500 μm along each side and discretized with resolution of 5μm. “Alveoli” spheres were packed in the block with face-centered cubic (FCC) packing 10 as illustrated in Figure 2. We simulate a 9x9x9-lattice volume (3x3x3 is shown in Figure 2a for illustration), compute the RDF, and extract the central fundamental block. We simulate phasors for all parenchyma voxels, and simulate TE of 0, and from 0.0275 to 250 ms with multiplicative step = 1.2. These were used to perform R2a fitting.
We simulate the dependence of R2a on field strength (0.2 to 3T) and volume fraction. Volume fraction was modulated by adjusting radii of the “alveoli” spheres in the fundamental block.
RESULTS
Figure 3 shows the R2b values for different B0 and in-plane spatial resolution. The three types of R2b values demonstrates that R2b increases more significantly with respect to B0 instead of spatial resolution. At low B0 field (0.55T), the variation of R2b is less sensitive to spatial resolution.Figure 4 shows predictions of R2a as a function of field strength and volume fraction. We did not observe any substantial dependence on volume fraction. However, extremely sensitive to B0 (f(60)=10256, p <0.001), as expected. R2a is 5.5 times larger at 3T compared to 0.55T.
DISCUSSION
Simluations suggest that the impact of proximity to alveoli is substantially larger than the impact of proximity to the bronchial tree. This indicates that improving resolution is unlikely to mitigate this effect (unless resolution is <100µm which is unrealistic for many reasons). Simulations also suggest that signal loss is insensitive to respiratory phase in the physiologic range, indicating that breathing maneurvers are unlikely to mitigate, or special selection of breath-holding phase is unlikely to make a difference. Finally the impact of B0 field strength is dominant, indicating the unique value of lower field strengths for lung imaging.This study has many limitations. 1) We assume that spins are in the static refocusing regime 5 which neglects the water diffusion effect. Our calculations (not shown) suggest this is reasonable when diffusion constant D < 1 µm2/ms and echo spacing < 50 ms. This would have to be re-examined for T2 weighted FSE imaging with longer echo times. 2) The parenchymal mask used for R2a analysis may not be consistent with in-vivo imaging. 3) we did not simulate realistic noise which would be another important consideration that varies with B0 field strength. 4) Experimental verification is needed. Simulations predict R2’ of roughly ~25 Hz and ~70 Hz at 0.55T and 1.5T, which is quite different from 84 Hz and 500 Hz based on1,11. Discrepancies could be due to inaccuracies of the simulation and/or challenges separating parenchyma from other signals (e.g. vessels) during data collection.
CONCLUSION
We propose a framework for simulating transverse signal decay in lung parenchyma MRI, that separately considers the effects of alveoli and bronchial tree, and is capable of exploring the effects of B0 field strength and imaging spatial resolution.Acknowledgements
National Science Foundation (Award #1828736). We thank Prof. John Wood for useful discussions and Prof. Ehsan Abadi for sharing the XCAT lung phantom.
References
1. Campbell-Washburn, A. E. et al. Opportunities in Interventional and Diagnostic Imaging by Using High-Performance Low-Field-Strength MRI. Radiology 293, 384–393 (2019).
2. Bhattacharya Ipshita et al. Structural and functional lung imaging using a high performance 0.55T MRI system. Proc. Intl. Soc. Mag. Reson. Med. 28
3. Bauman, G. et al. 3D pulmonary perfusion MRI with radial ultra-short echo time and spatial-temporal constrained reconstruction. Magn Reson Med 73, 555–564 (2015).
4.Abadi, E. et al. Modeling Lung Architecture in the XCAT Series of Phantoms: Physiologically Based Airways, Arteries and Veins HHS Public Access. IEEE Trans Med Imaging 37, 693–702 (2018).
5. Yablonskiy, D. A. & Haacke, E. M. Theory of NMR signal behavior in magnetically inhomogeneous tissues: The static dephasing regime. Magn. Reson. Med. 32, 749–763 (1994).
6. Schenck, J. F. The role of magnetic susceptibility in magnetic resonance imaging: MRI magnetic compatibility of the first and second kinds. Med. Phys. 23, 815–850 (1996).
7. Bouwman, J. G. & Bakker, C. J. G. Alias subtraction more efficient than conventional zero-padding in the Fourier-based calculation of the susceptibility induced perturbation of the magnetic field in MR. Magn. Reson. Med. 68, 621–630 (2012).
8. Ochs, M. et al. The Number of Alveoli in the Human Lung. Am. J. Respir. Crit. Care Med. 169, 120–124 (2004).
9. Fleming, J. et al. Determination of regional lung air volume distribution at mid-tidal breathing from computed tomography: A retrospective study of normal variability and reproducibility. BMC Med. Imaging 14, 25 (2014).
10. Weisstein, E. W. Cubic Close Packing -- from Wolfram MathWorld. https://mathworld.wolfram.com/CubicClosePacking.html.
11. Hatabu, H., Alsop, D. C., Listerud, J., Bonnet, M. & Gefter, W. B. T2* and proton density measurement of normal human lung parenchyma using submillisecond echo time gradient echo magnetic resonance imaging. Eur. J. Radiol. 29, 245–252 (1999).
Figures
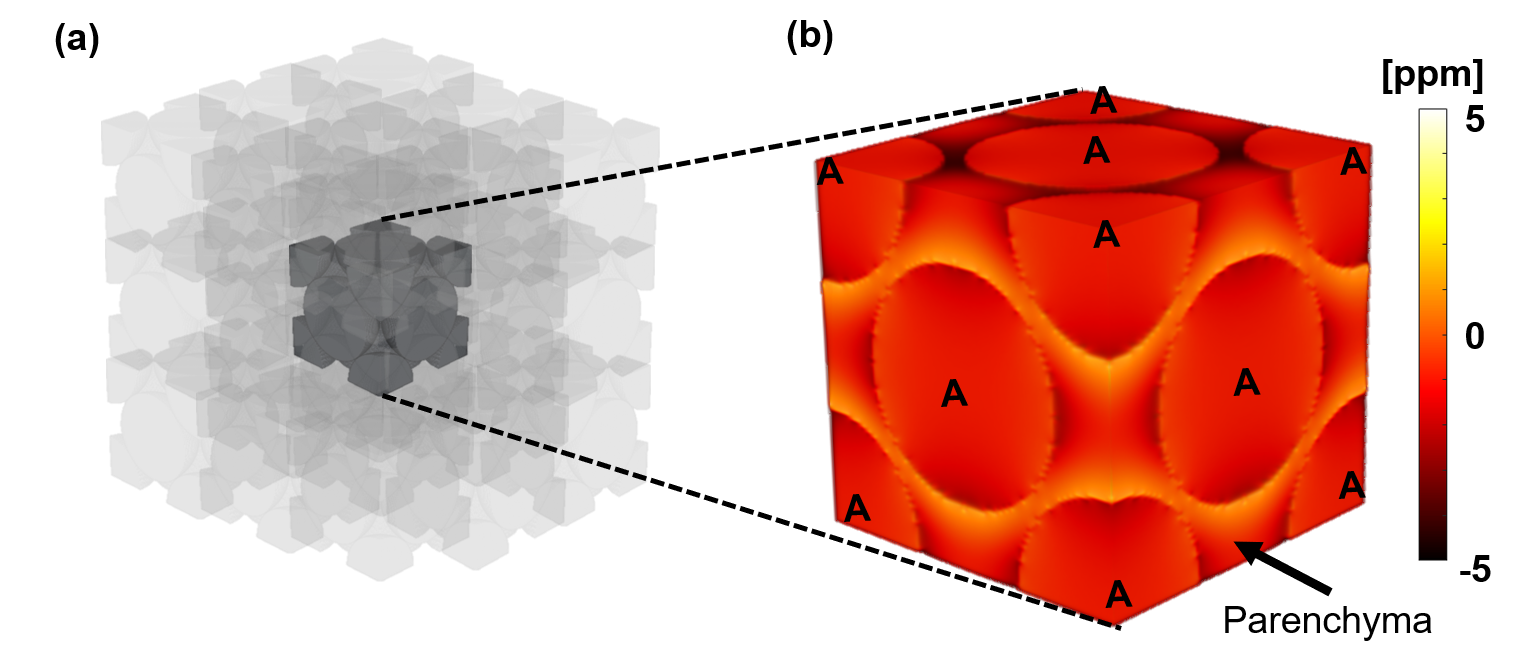
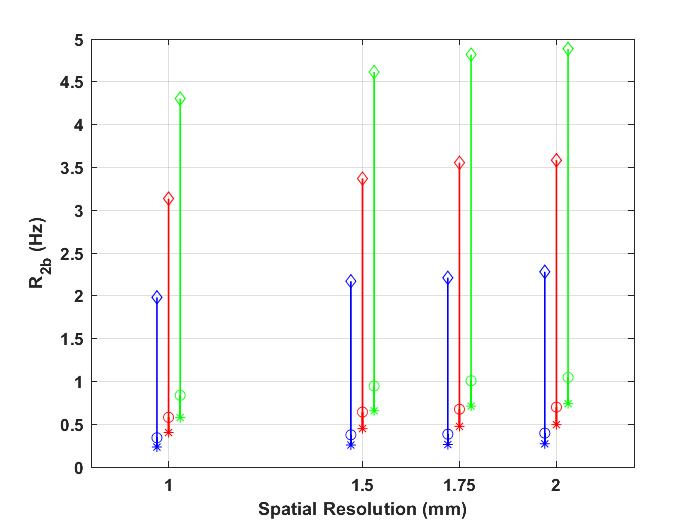
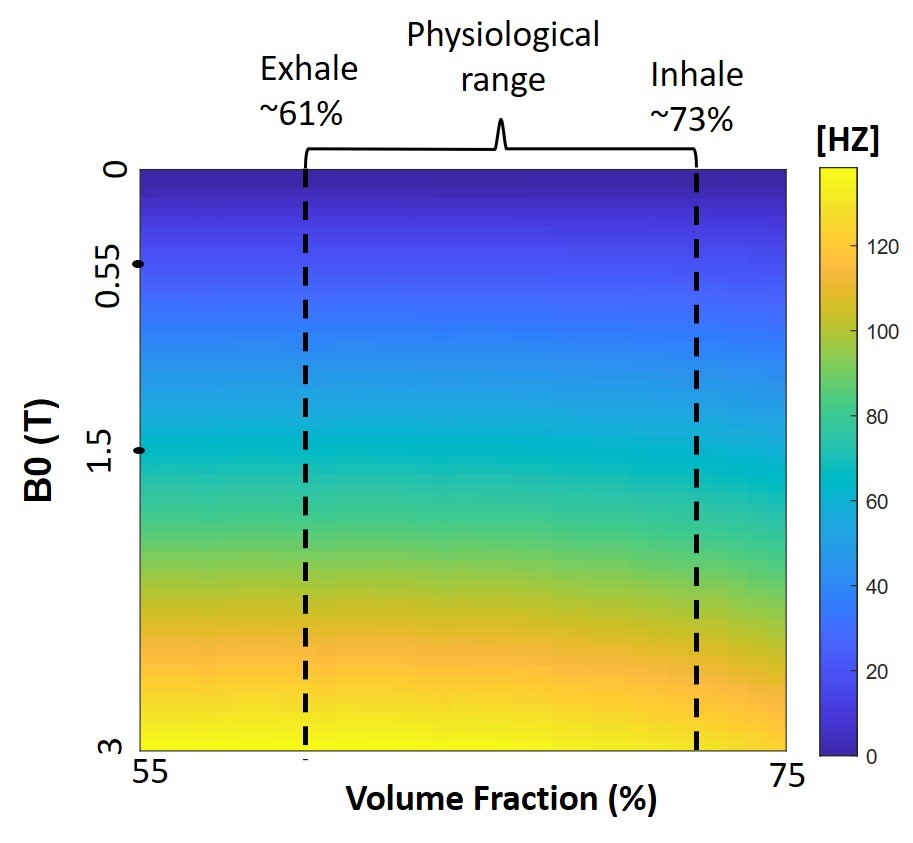
Figure 4: dependence on volume fraction and B0 field strength. Simulated R2a was insensitive to volume fraction within the physiological range (62% exhale to 73% inhale). However, R2a is extremely sensitive to B0 field strength, the mean is 24Hz, 67Hz, and 134Hz for 0.55T, 1.5T and 3T, respectively.