3227
A Flexible Physics-Based Digital Phantom for Functional Lung MRI Validation1Centre for Medical Image Computing, Quantitative Imaging Group, Department of Medical Physics and Biomedical Engineering, University College London, London, United Kingdom, 2Centre for Medical Image Computing, Radiotherapy Image Computing Group, Department of Medical Physics and Biomedical Engineering, University College London, London, United Kingdom, 3Bioxydyn Limited, Manchester, United Kingdom
Synopsis
We describe a flexible framework incorporating an anatomically realistic digital thorax phantom with physics-based simulation, respiratory motion and functional contrasts. We demonstrate the framework in the context of dynamic oxygen-enhanced MRI (OE-MRI).
The framework is designed to provide ground-truth for assessment of novel scan protocols and analysis methods, of utility for OE-MRI as derived lung function measures are limited in accuracy due to motion artefacts, blurring and poor signal-to-noise ratio. The framework was applied to a 2D inversion-prepared spoiled gradient echo dynamic OE-MRI readout. The simulated series displayed respiratory motion; quantitative measures describing hyperoxia-induced contrast enhancement agreed with experimental literature.
Introduction
We describe the creation of a flexible framework incorporating an anatomically and physiologically realistic digital thorax phantom with physics-based MR signal simulation and the ability to incorporate functional signals, designed to provide ground-truth for analysis methods such as motion correction, relaxation time quantification and image-derived lung function measurement. We present the example of a simulation of dynamic oxygen-enhanced MRI (OE-MRI), a method that can provide regional lung function information.Analysis of lung OE-MRI is impeded by the complexity of the scans: artefacts and blurring arise due to cardiac and respiratory motion; blood flow; and the broad point spread function that often arises when acquiring rapid scans. The extremely short T2* of lung parenchyma and its low proton density decrease the signal intensity of the lung, resulting in poor signal-to-noise ratio.
Ground-truth data to accurately analyse and model the observed oxygen-enhanced signal change in the presence of these confounds is of utility when assessing the likely performance of novel scan protocols and analysis methods. Furthermore, the production of realistic OE-MRI signals, and the ability to add various confounding factors using the framework, will aid understanding of the impact of artefacts, providing an opportunity to devise and evaluate methods for their compensation and ultimately to improve the measurement of local lung function.
Our framework utilises the extended cardiac and torso (XCAT) phantom1 and JEMRIS2 simulation environment, combined with a tissue physiology simulation that models time-varying signals due to the inhalation of elevated oxygen concentrations. We present an example application based on a 2D inversion-prepared spoiled gradient echo dynamic OE-MRI readout.
Methods
An anatomical template was created using the XCAT phantom1. Tissues in the phantom were segmented and assigned proton density, T1, T2 and T2* obtained from a review of MR literature3–18.Subject free breathing was simulated using a real breathing trace supplied to the XCAT phantom (Figure 2). The resulting cardiac and respiratory motion-induced deformations were processed to ensure consistent motion whilst preserving sliding between organs19. The corrected motion vectors were supplied to JEMRIS2 to enable MR simulations with individual spin motion20. Inter-image motion was simulated; intra-image motion was assumed negligible given the rapid 2D readout simulated.
The acquisition of a coronal slice was simulated in JEMRIS based on a 2D single-shot inversion recovery-prepared SPGR acquisition designed to provide optimum T1-weighting to detect the presence of dissolved oxygen21 (TI = 1100 ms, TR = 2.1 ms, TE = 0.5 ms, FA = 6°, FOV = 450 mm x 450 mm, pixel resolution = 4.69 mm x 4.96 mm, 5 mm slice thickness). A series of 96 images was simulated according to a dynamic OE-MRI protocol involving a subject breathing: medical air containing 21% O2 (5 mins); 100% O2 (16 mins); medical air (5 mins)21.
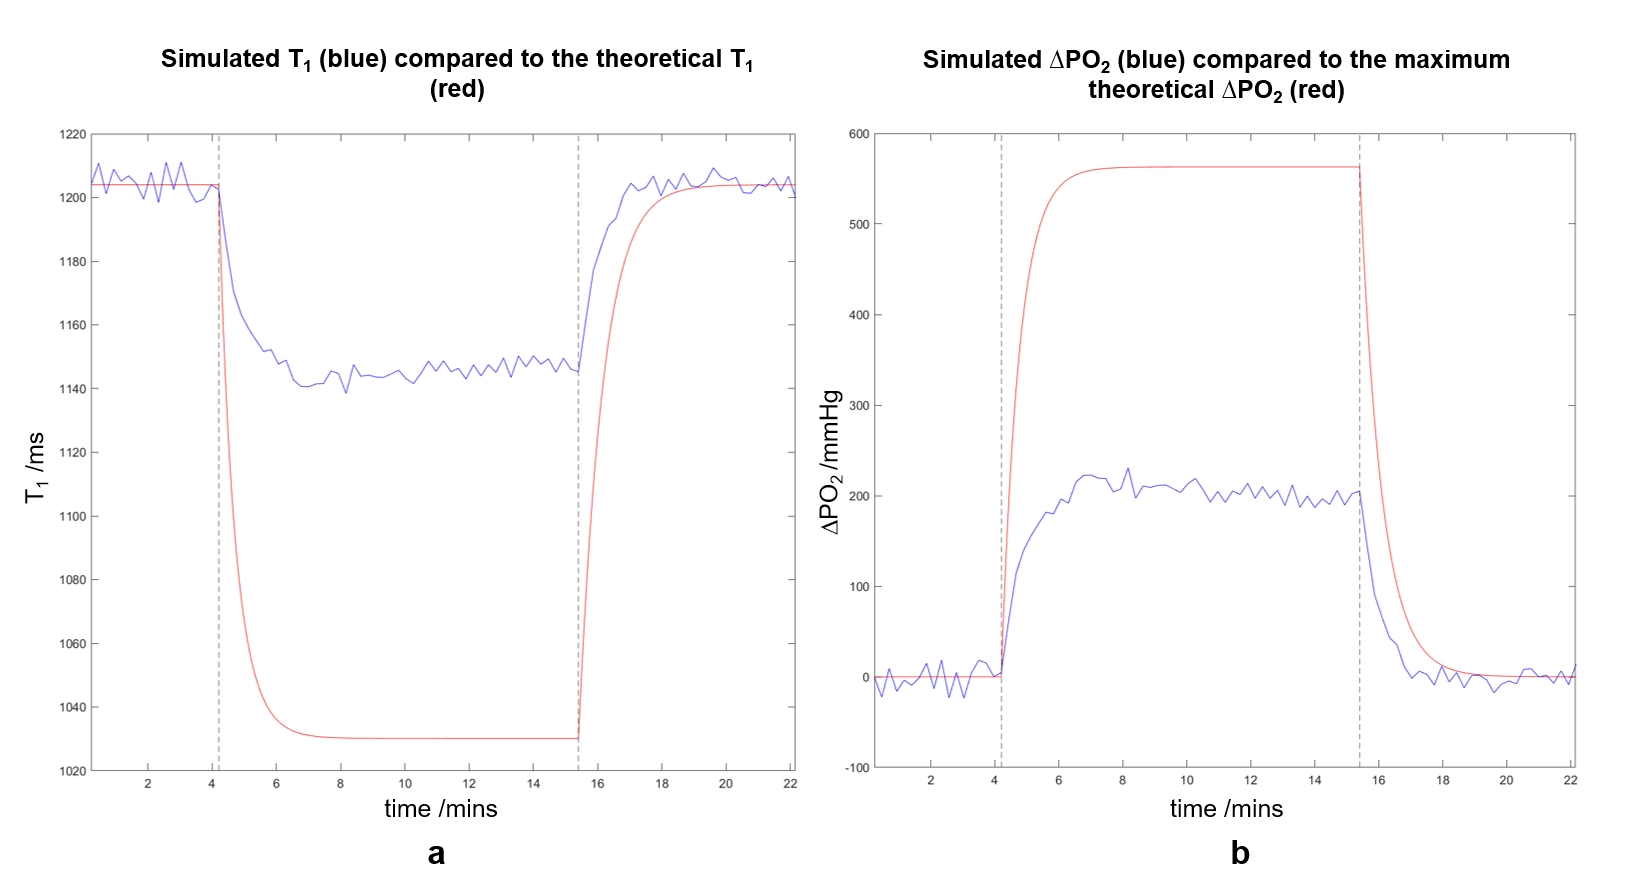
Simulated lung T1 was modified to model the impact of hyperoxia using the change in oxygen partial pressure, ΔPO2, relaxivity at 1.5 T22, r1, and relaxation time during air breathing: $$$\frac{1}{T_{1,oxy}(t)} - \frac{1}{T_{1,air}} = r_1 \Delta PO_2(t)$$$. The ΔPO2(t) curve was generated using a theoretical value for the maximum ΔPO223 and published oxygen wash-in/out times24 (Figure 2).
After simulation, the reconstructed images were transformed to the first frame of the series to calculate ΔPO2(t) and T1(t).
Results
The simulated dynamic series displayed respiratory motion, with superior-inferior motion of the lung and abdominal organs, and sliding of the lungs along the chest wall. Plateau T1,oxy = (1147 ± 3) ms; plateau ΔPO2 = (201 ± 9) mmHg (Figure 3). Figure 4 shows an example fitted T1,oxy map. Simulation within JEMRIS required 30 minutes per frame using 128 CPU cores.Discussion
The simulation of dynamic OE-MRI is feasible and was performed in 2D using the developed digital phantom and simulation framework.Pipelines involving a digital phantom and MR simulator have been reported previously - Hanson et al.25 used XCAT and JEMRIS to simulate 2D lung MRI with motion. In contrast, the framework presented here can simulate a dynamic 2D MRI sequence containing motion with contrast enhancement. This framework is readily extendable to the examination of different sequences, such as HASTE or UTE, and for other sources of functional contrast.
Plateau T1 and ΔPO2 quantified from the simulated series were lower than maximum theoretical predictions but agreed with published values24,26,27. For the sequence simulated, fat and muscle had large point spread functions which increased noise throughout the image. The contamination of lung signal increased the uncertainty in measures derived from the intensities of the lung and was likely to have contributed to the lower T1 and ΔPO2 values both in the literature and derived using the framework. The ability to add confounding factors within the framework provides a utensil for investigating discrepancies between measured and theoretical values thoroughly in the future.
Conclusion
We have created a flexible framework for the simulation of realistic MRI acquisitions to form a ground-truth for the evaluation of novel acquisition, reconstruction and analysis methods. We show the example of a 2D dynamic OE-MRI series, involving realistic anatomical structure, physiological motion and physics-based MR signal simulation. The digital nature of the framework provides an attractive tool for optimising OE-MRI sequences and motion correction, and in understanding forms of noise in OE-MRI scans.Acknowledgements
This work is supported by the EPSRC-funded UCL Centre for Doctoral Training in Medical Imaging (EP/L016478/1).
Many thanks to Tony Stöcker and Kaveh Vahedipour for their valuable advice on implementing JEMRIS.
References
1. Segars, W. P., Sturgeon, G., Mendonca, S., Grimes, J. & Tsui, B. M. W. 4D XCAT phantom for multimodality imaging research. Med. Phys. 37, 4902–4915 (2010).
2. Stöcker, T., Vahedipour, K., Pflugfelder, D. & Shah, N. J. High-performance computing MRI simulations. Magn. Reson. Med. 64, 186–193 (2010).
3. De Bazelaire, C. M. J., Duhamel, G. D., Rofsky, N. M. & Alsop, D. C. MR Imaging Relaxation Times of Abdominal and Pelvic Tissues Measured in Vivo at 3.0 T: Preliminary Results. Radiology 230, 652–659 (2004).
4. Yu, J., Xue, Y. & Song, H. K. Comparison of lung T2* during free-breathing at 1.5 T and 3.0 T with ultrashort echo time imaging. Magn. Reson. Med. 66, 248–254 (2011).
5. Mars, M., Tbini, Z., Gharbi, S., Bouaziz, M. C. & Ladeb, F. T2 Versus T2* MRI Mapping in the Knee Articular Cartilage at 1.5 Tesla and 3 Tesla. Open Med. J. 5, 119–129 (2019).
6. Ngwube, A. et al. Magnetic Resonance T2* Measurement of Myocardial Iron Deposition in Sickle Cell Disease: Risk Factors and Relationship with Cardiac Function. Blood 114, 4604 (2009).
7. Granitz, M. et al. Comparison of native myocardial T1 and T2 mapping at 1.5T and 3T in healthy volunteers. Wien. Klin. Wochenschr. 131, 143–155 (2019).
8. Barth, M. & Moser, E. Proton NMR relaxation times of human blood samples at 1.5 T and implications for functional MRI. Cell. Mol. Biol. (Noisy-le-grand). 43, 783–791 (1997).
9. Dietrich, O., Gaass, T. & Reiser, M. F. T1 relaxation time constants, influence of oxygen, and the oxygen transfer function of the human lung at 1.5 T—A meta-analysis. Eur. J. Radiol. 86, 252–260 (2017).
10. Buzan, M. T. A. et al. T2 mapping of CT remodelling patterns in interstitial lung disease. Eur. Radiol. 25, 3167–3174 (2015).
11. Peters, A. M. et al. T2* measurements in human brain at 1.5, 3 and 7 T. Magn. Reson. Imaging 25, 748–753 (2007).
12. Zhang, J. L. et al. Reproducibility of R2* and R2 measurements in human kidneys. in Proc Int Soc Magn Reson Med vol. 19 2954 (2011).
13. Alam, M. H. et al. Comparison of 3 T and 1.5 T for T2* magnetic resonance of tissue iron. J. Cardiovasc. Magn. Reson. 18, 40 (2016).
14. Pepe, A. et al. Multicenter Validation of the Magnetic Resonance T2* Technique for Quantification of Pancreatic Iron. Blood 132, 3637 (2018).
15. Reichert, I. L. H. et al. Magnetic resonance imaging of cortical bone with ultrashort TE pulse sequences. Magn. Reson. Imaging 23, 611–618 (2005).
16. Gold, G. E. et al. Musculoskeletal MRI at 3.0 T: Relaxation Times and Image Contrast. Am. J. Roentgenol. 183, 343–351 (2004).
17. Le Ster, C. et al. Breath-hold MR measurements of fat fraction, T1, and T2* of water and fat in vertebral bone marrow. J. Magn. Reson. Imaging 44, 549–555 (2016).
18. Varghese, J. et al. Rapid assessment of quantitative T1, T2 and T2* in lower extremity muscles in response to maximal treadmill exercise. NMR Biomed. 28, 998–1008 (2015).
19. Eiben, B. et al. Consistent and invertible deformation vector fields for a breathing anthropomorphic phantom: a post-processing framework for the XCAT phantom. Phys. Med. Biol. 65, 165005 (2020).
20. Fortin, A., Salmon, S., Baruthio, J., Delbany, M. & Durand, E. Flow MRI simulation in complex 3D geometries: Application to the cerebral venous network. Magn. Reson. Med. 80, 1655–1665 (2018).
21. Salem, A. et al. Oxygen-enhanced MRI is feasible, repeatable, and detects radiotherapy-induced change in hypoxia in xenograft models and in patients with Non-small cell lung cancer. Clin. Cancer Res. 25, 3818–3829 (2019).
22. Zaharchuk, G. et al. Noninvasive Oxygen Partial Pressure Measurement of Human Body Fluids In Vivo Using Magnetic Resonance Imaging. Acad. Radiol. 13, 1016–1024 (2006).
23. Sharma, S., Hashmi, M. F. & Burns, B. Alveolar Gas Equation. in StatPearls (StatPearls Publishing, 2020).
24. Zhang, W. J. et al. Dynamic oxygen-enhanced magnetic resonance imaging of the lung in asthma - Initial experience. European Journal of Radiology vol. 84 318–326 (2015).
25. Hanson, H. M., van Herk, M., Cobben, D. & Rowland, B. C. 4D Deformable Digital Phantom for MRI Sequence Development. in Proc. 28th Intl. Soc. Mag. Reson. Med. 4271 (2020).
26. Martini, K. et al. Volumetric dynamic oxygen-enhanced MRI (OE-MRI): comparison with CT Brody score and lung function in cystic fibrosis patients (European Radiology, (2018), 28, 10, (4037-4047), 10.1007/s00330-018-5383-5). Eur. Radiol. 28, 4922–4923 (2018).
27. Tibiletti, M., Ulloa, J., Morgan, A. R. & Parker, G. J. M. Comparative study of 3D inversion recovery centric ordered fast field echo in lung dynamic oxygen enhanced MRI at 1.5 T and 3 T. Proc. ISMRM 26th Meet. 26, 2455 (2018).
Figures