3220
Proton lung ventilation MRI in cystic fibrosis: comparison with hyperpolarized gas MRI, pulmonary function tests and multiple-breath washout1POLARIS, University of Sheffield, Sheffield, United Kingdom, 2Oncology and Metabolism, University of Sheffield, Sheffield, United Kingdom
Synopsis
Several methods of mapping regional ventilation from multi-inflation 1H-MRI have been proposed, potentially transforming 1H-MRI from a structural modality into one that can image and quantify pulmonary ventilation. However, their physiological accuracy and sensitivity to lung inflation level is an ongoing research question. Here, we compare surrogates of regional ventilation, derived from non-contrast inspiratory and expiratory breath-hold 3D gradient-echo 1H-MRI with hyperpolarized 3He-MRI, pulmonary functions tests and multiple-breath washout in a cohort of cystic fibrosis patients with a range of disease severity and age. We observed moderate to strong correlations with all lung function measures and 3He-MRI.
Introduction
Hyperpolarized gas ventilation MRI has been shown to be a highly sensitive technique for the detection1 and longitudinal2 assessment of cystic fibrosis (CF), with strong correlations reported against pulmonary function tests (PFTs) and multiple-breath washout (MBW)3. However, the modality requires specialised polarisation equipment, RF coils and manufacturing licences, which present a current barrier to widespread clinical adoption. Alternative image processing methods of mapping regional ventilation from non-contrast multi-inflation 1H-MRI have been proposed, potentially transforming 1H-MRI from a structural modality into one that can image and quantify pulmonary ventilation.4,5,6 Here, we compare surrogates of regional ventilation, derived from non-contrast inspiratory and expiratory breath-hold 1H-MRI with hyperpolarized gas MRI, PFTs and MBW, in a cohort of patients with a broad range of CF disease severity and age.Methods
Patients and data acquisition24 children and adults with CF underwent inspiratory and expiratory breath-hold 3D 1H-MRI, hyperpolarized 3He-MRI, spirometry, body plethysmography and MBW on the same day. MRI was acquired on a 1.5T GE HDx scanner. Inspiratory and expiratory 1H-MRI were acquired at total lung capacity (TLC) and residual volume (RV), respectively, using an isotropic 3D spoiled gradient-recalled echo sequence with the following parameters: TE=0.7ms, TR=1.8ms, FA=3⁰, BW=167kHz and resolution of 3x3x3mm3. 3He-MRI and a same-breath anatomical 1H-MRI were acquired at TLC with resolutions of 4x4x5mm3 using a 3D balanced steady-state free precession sequence as described previously.7 Spirometry8 and body plethysmography9 were performed to international standards, yielding FEV1 z-scores and RV/TLC, respectively. The lung clearance index (LCI) was calculated from MBW.
Image processing
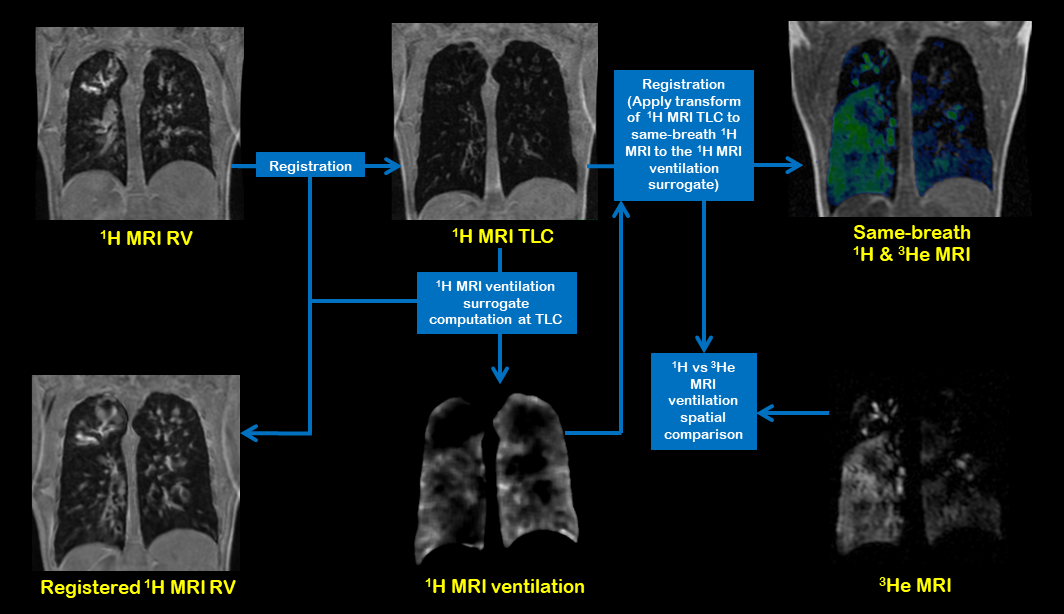
All images were segmented by the spatial fuzzy c-means algorithm10 and manually edited where necessary. The 1H-MRI RV was deformably registered to 1H-MRI TLC using the Advanced Normalization Tools11, facilitating calculation of voxel-wise ventilation as (SIRV-SITLC)/SITLC, where SIRV and SITLC are signal intensities at RV and TLC, respectively.12 The resulting image was median filtered with radius 3x3x3 to account for noise and registration errors. As a metric of ventilation heterogeneity, the global coefficient of variation (CoV) was computed for both 1H- and 3He-ventilation maps. To facilitate spatial comparison of 1H- and 3He-ventilation, 1H-MRI TLC was registered to 3He-MRI via the same-breath 1H-MRI. Figure 1 shows the workflow for the comparison.
Statistical analysis
The relationships between CoVs and lung function metrics were assessed by Pearson’s correlation. Voxel-wise spatial correlation between 1H- and 3He-ventilation was assessed by Spearman’s ρ.
Results
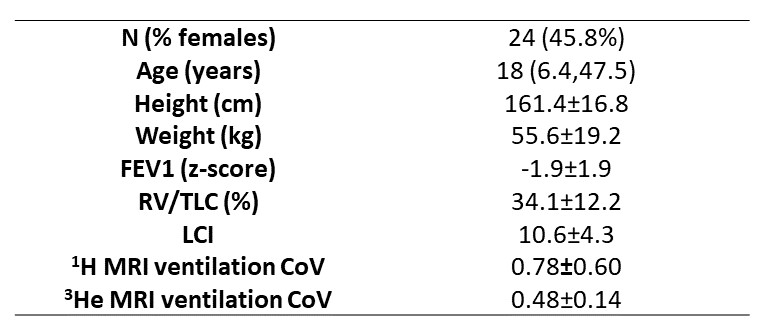
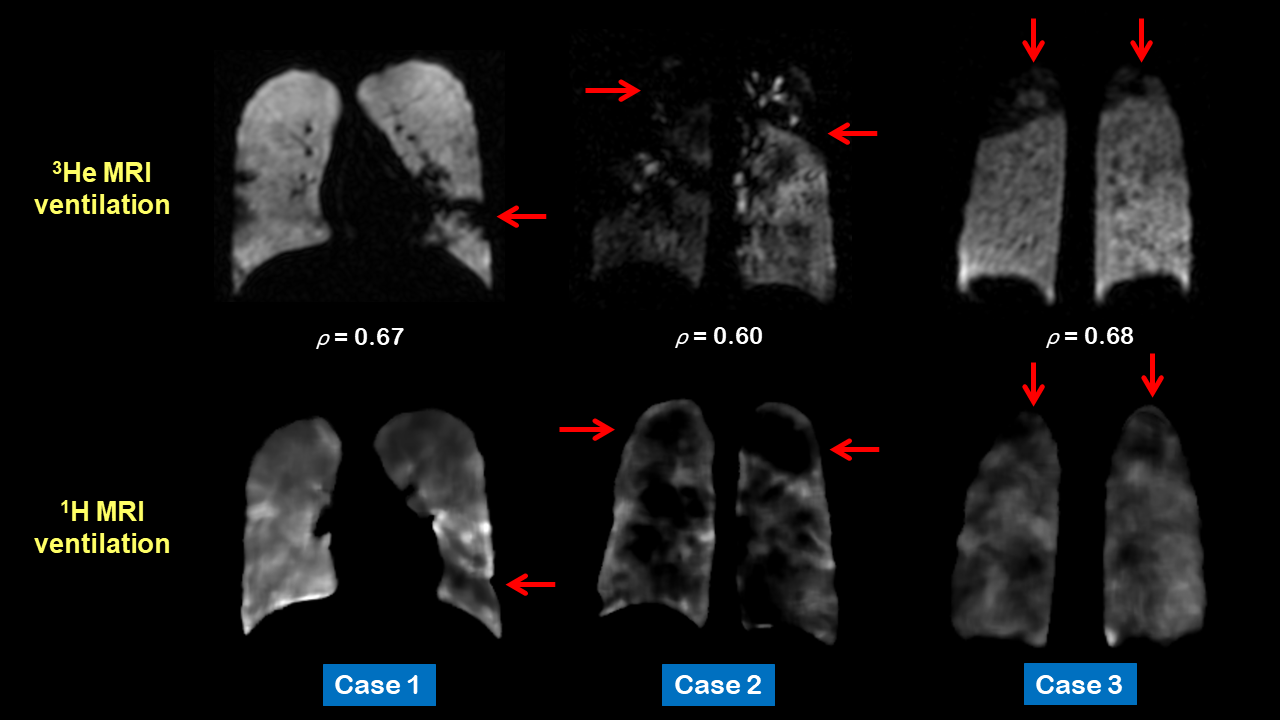
Patient demographics, lung function and MRI metrics are summarized in Table 1. The CoVs derived from the 1H-/3He-ventilation images significantly (p≤0.01) correlated with all lung function tests: FEV1 z-score, r=-0.50/-0.92; RV/TLC, r=0.59/0.89; LCI, r=0.65/0.80. The strength of correlation for each measurement was higher for 3He-MRI. Figure 2 shows corresponding coronal slices of the 1H- and 3He-ventilation images for three example patients after image registration. The mean±SD Spearman’s ρ for 1H- and 3He-ventilation was 0.61±0.098.Discussion
Whilst the strength of correlation observed here was higher for 3He-MRI, moderate to strong correlations were observed with 1H-ventilation for all lung function tests.Although we had access to 3He-MRI acquired at both TLC and FRC+1L for this dataset, we opted for the former to minimise registration errors due to differences in inflation levels between 3He-MRI and 1H-ventilation maps, which were computed at TLC geometry. In recent work comparing surrogates of regional ventilation derived from CT with 3He-MRI acquired at TLC and FRC+1L, we observed a higher correlation at TLC, demonstrating that regional ventilation is sensitive to inflation level.13 Future work will investigate the differences in spatial correlation between 1H- and 3He-ventilation at both inflation levels.
We also demonstrated moderate spatial correlations of ρ≈0.6 at the voxel level between 1H- and 3He-ventilation. Despite notable similarities, however, none of the 1H-ventilation maps were perfectly matched to 3He-MRI and marked discrepancies in ventilation distributions were observed. This may be attributable to the fundamental assumption inherent in the 1H-ventilation metric applied in this study, namely, that changes in signal equate to changes in lung density between inflation levels and that only the influx of air changes. This assumption neglects the effect on the signal of different lung T2* with inflation level and also assumes that lung perfusion remains regionally unaffected by lung inflation level. Investigations with dual-energy CT have demonstrated that the regional distribution of pulmonary blood volume is sensitive to inflation level.14
There are limitations to this study that require consideration. First, our dataset was relatively small, limiting the study’s generalizability. Second, in order to validate our findings, longitudinal data are required to determine whether the 1H-ventilation maps behave as expected on an individual basis over time. Third, we only used CoV. Other metrics, such as the ventilated defect percentage, have shown tremendous sensitivity in the subclinical assessment of several pulmonary pathologies, including CF, and will be explored in future work.
Conclusion
Our preliminary results suggest that a simple multi-inflation 3D 1H-MRI ventilation technique may provide a feasible tool for the detection and assessment of cystic fibrosis for centres unequipped with the specialised equipment required for established ventilation imaging techniques such as hyperpolarized gas MRI. When compared with free breathing 1H-MRI lung ventilation methods, the technique is faster to acquire, requiring just two volumetric breath-hold acquisitions.Acknowledgements
This work was supported by National Institute for Health Research, Health Education England, the Medical Research Council and Yorkshire Cancer Research.References
1. Marshall H, Horsley A, Taylor CJ et al. Detection of early subclinical lung disease in children with cystic fibrosis by lung ventilation imaging with hyperpolarised gas MRI. Thorax. 2017;72(8):760-762.
2. Smith L, Marshall H, Aldag I et al. Longitudinal Assessment of Children with Mild Cystic Fibrosis Using Hyperpolarized Gas Lung Magnetic Resonance Imaging and Lung Clearance Index. Am J Respir Crit Care Med. 2018;197(3):397-400.
3. Smith LJ, Collier GJ, Marshall H et al. Patterns of regional lung physiology in cystic fibrosis using ventilation magnetic resonance imaging and multiple-breath washout. Eur Respir J. 2018;52(5):1800821.
4. Kjørstad Å, Regier M, Fiehler J et al. A decade of lung expansion: A review of ventilation-weighted 1H lung MRI. Z Med Phys. 2017;27(3):172-179.
5. Voskrebenzev A, Gutberlet M, Klimeš F, et al. Feasibility of quantitative regional ventilation and perfusion mapping with phaseresolved functional lung (PREFUL) MRI in healthy volunteers and COPD, CTEPH, and CF patients. Magn Reson Med. 2018;79:2306-2314.
6. Bauman G, Puderbach M, Deimling M, et al. Non-contrast-enhanced perfusion and ventilation assessment of the human lung by means of Fourier decomposition in proton MRI. Magn Reson Med. 2009;62:656-664.
7. Horn, F.C., B.A. Tahir, N.J. Stewart et al. Lung ventilation volumetry with same-breath acquisition of hyperpolarized gas and proton MRI. NMR Biomed. 2014;27(12):1461-1467.
8. Miller MR, Hankinson J, Brusasco V et al. Standardisation of spirometry. Eur Respir J. 2005;26(2):319-338.
9. Wanger J, Clausen JL, Coates A et al. Standardisation of the measurement of lung volumes. Eur Respir J. 2005;26(3):511-522.
10. Hughes P.J, Horn F.C, Collier G.J, et al. Spatial fuzzy c‐means thresholding for semiautomated calculation of percentage lung ventilated volume from hyperpolarized gas and 1H MRI. J. Magn. Reson. Imaging, 2018;47:640-646.
11. Avants BB, Tustison NJ, Song G, et al. A reproducible evaluation of ANTs similarity metric performance in brain image registration. Neuroimage. 2011;54(3):2033-2044.
12. Zapke M, Topf HG, Zenker M et al. Magnetic resonance lung function--a breakthrough for lung imaging and functional assessment? A phantom study and clinical trial. Respir Res. 2006;7(1):106.
13. Tahir BA, Marshall H, Hughes PJC et al. Comparison of CT ventilation imaging and hyperpolarised gas MRI: effects of breathing manoeuvre. Phys Med Biol. 2019;64(5):055013.
14. Fuld MK, Halaweish AF, Haynes SE, et al. Pulmonary perfused blood volume with dual-energy CT as surrogate for pulmonary perfusion assessed with dynamic multidetector CT. Radiology. 2013;267:747-756.
Figures