3217
Lung parenchyma T1 mapping correlates lung pathology seen on CT in patients with pulmonary hypertension.1Infection Immunity and Cardiovascular Disease, University of Sheffield, Sheffield, United Kingdom, 2Sheffield Pulmonary Vascular Disease Unit, Sheffield, United Kingdom
Synopsis
Assessment of lung changes in patients with pulmonary hypertension plays an important role in establishing patient aetiology and treatment. 82 patients with suspected pulmonary hypertension underwent 2D single slice Look-Locker inversion recovery T1 mapping. Lung T1 was significantly lower in patients with emphysema seen on 3D CT than in patients with fibrosis, centrilobular ground glass or no lung disease seen on 3D CT. Lung T1 was more sensitive in differentiating lung pathology seen on CT when excluding lung vessels from average metrics, and when using median rather than mean lung T1.
Introduction
Patients with pulmonary hypertension (PH) have elevated pressure in the main pulmonary artery. Assessment of severity of lung disease is an important part of differential diagnosis of a patient with PH, with differing characteristic lung parenchymal patterns associated with different patient aetiology.Lung T1 mapping is sensitive to lung pathology in several patient groups including patients with emphysema and fibrosis[1,2]. Global lung T1 measures originate from proton relaxation in the lung tissue and blood vessels, and therefore can be sensitive to both tissue changes and lung perfusion changes[3, 4].
Lung T1 analysis is typically performed using mean T1 of the whole lung or lung regions[1, 2, 5, 6] however the T1 of the vessels and lung parenchyma have been shown to be significantly different[7] due to the different T1 of perfused lung tissue and blood. Separate analysis of the lung vessels and parenchyma may increase sensitivity in detecting changes in the lung, particularly in patients with pulmonary hypertension, who may demonstrate changes in the pulmonary vasculature.
The aims of this work are to evaluate: i) whether the sensitivity of global lung T1 metrics differs due to vessel segmentation and the average metric chosen (mean and median); ii) whether lung T1 can identify patients with pulmonary hypertension due to lung disease, and iii) whether lung T1 can differentiate between different lung pathology seen on CT.
Methods
82 consecutive patients with suspected PH were prospectively recruited with informed consent, and underwent MRI including a Look-Locker inversion recovery sequence. 11/82 patients did not have PH and 71/82 had a PH diagnosis (pulmonary arterial hypertension (PAH): 36/71; PH due to left heart disease (PH-LHD): 7/71; PH due to lung disease (PH-lung): 15/71; chronic thromboembolic PH (CTEPH): 8/71; PH other: 5/71). 10 healthy volunteers without lung or cardiac disease were also recruited.MRI was performed on a whole body 1.5T MRI scanner, (HDx scanner, GE Healthcare) using an 8-channel cardiac coil in supine position. Inspiration T1 maps were acquired using a 2D Look-Locker inversion recovery sequence[8, 9]. A coronal imaging slice was positioned through the descending aorta. Acquisition parameters were: inversion time (TI): 229 ms; repetition time (TR): 3.2 ms; TE: 0.9 ms; flip angle: 7°; phase×frequency: 128×128; slice thickness: 15mm; pixel bandwidth: 244.14 kHz; FOV: 440mm; overall acquisition time=7s.
73/82 patients had a CT exam within 24 months of MRI (mean: 2.6±4.5 months; range: 0-23 months) (56/73: CT angiogram, 12/73: unenhanced CT imaging, 5/73: thorax CT with contrast). CT images were used to identify presence and severity of fibrosis, emphysema, centrilobular ground-glass, hypoattenuation and consolidation. Disease severity scores of none, minor, mild, moderate or severe were recorded by a clinical radiologist.
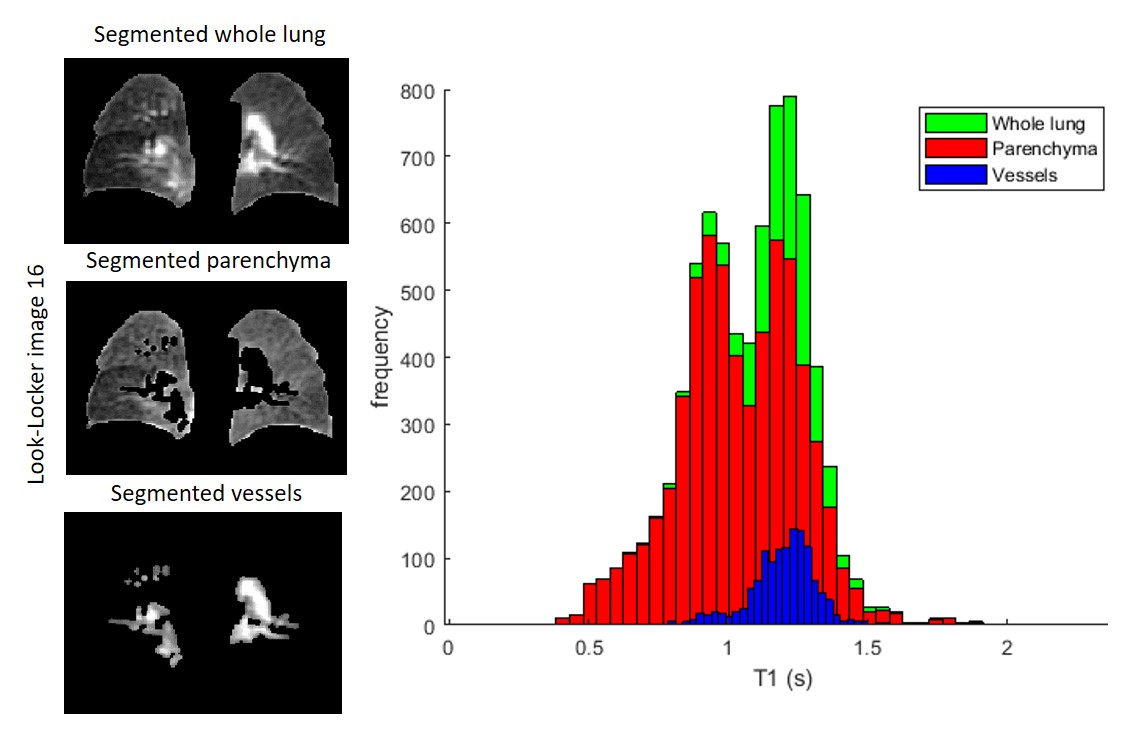
Lung masks including and excluding pulmonary vessels were segmented using the last image (Ti=16) from the Look-Locker acquisition (Figure 1). The segmented masks were applied to the T1 map before mean, median and standard deviation of T1 were calculated.
Results
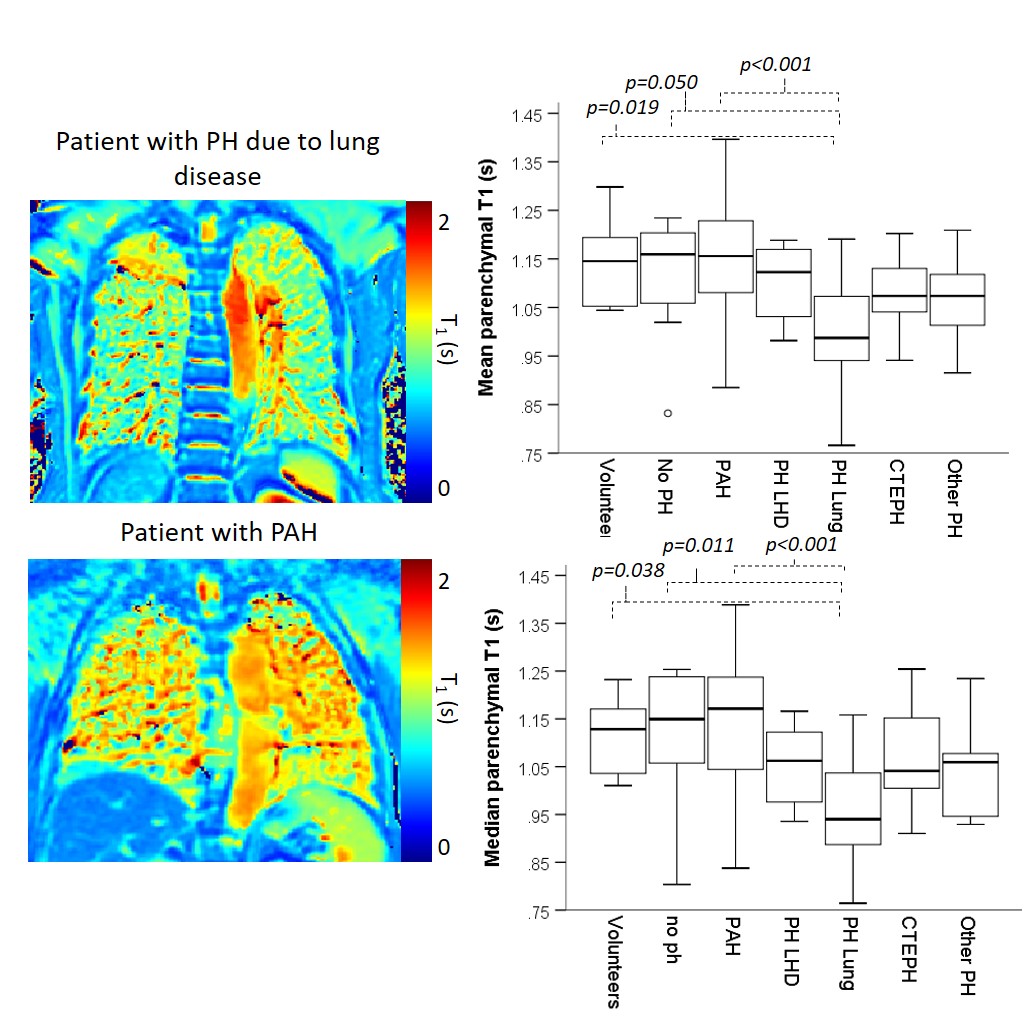
For all subjects, mean global lung T1 and mean lung parenchyma T1 was significantly higher than median global lung T1 (p=0.002) and median lung parenchyma T1 (p=0.018).Patients with PH-lung had significantly lower lung T1 when compared to healthy volunteers, patients without PH and patients with PAH for mean and median lung parenchyma and global lung T1 (Figure 2, Table 1).
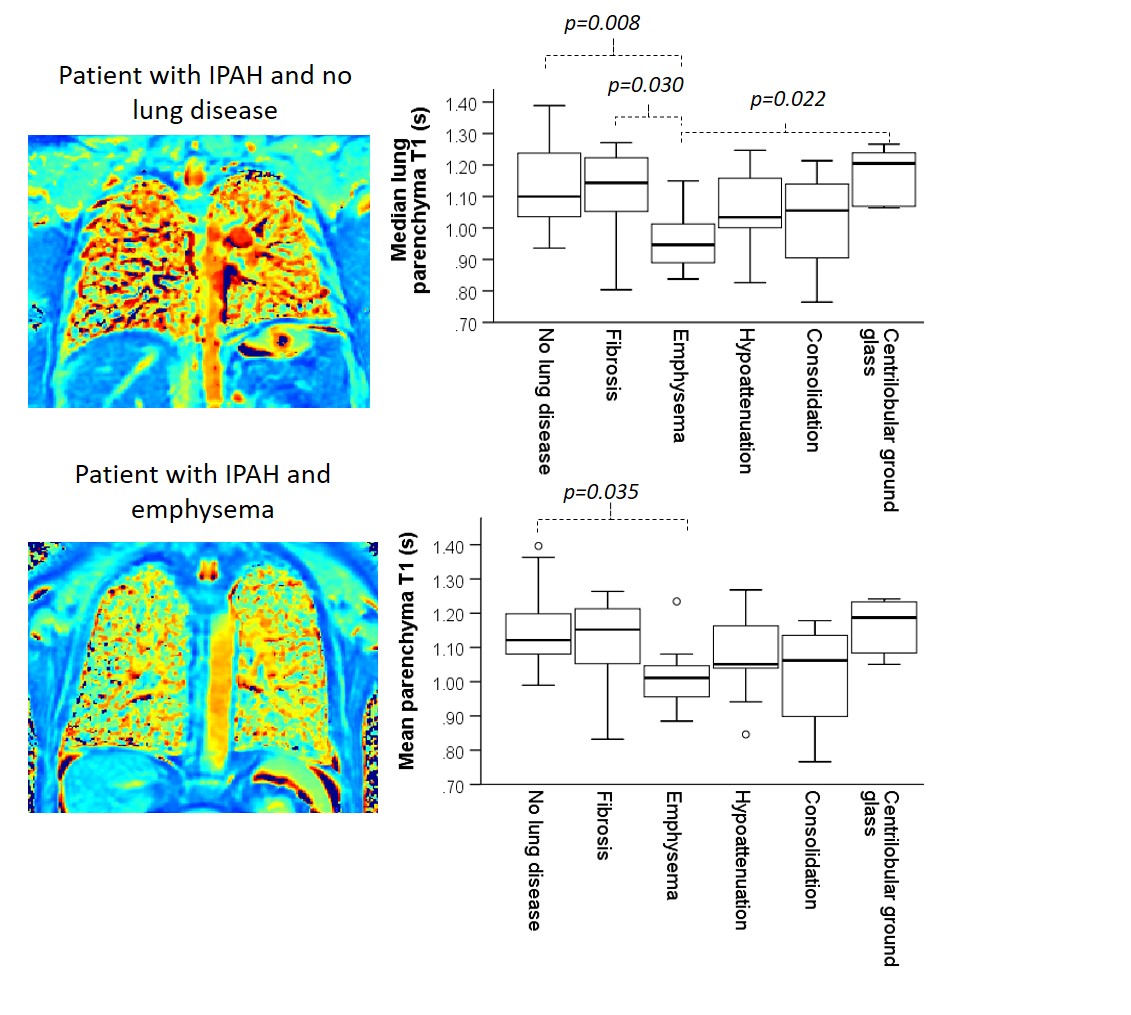
Of all patients, those with emphysema had significantly lower lung T1 when compared to patients with no lung disease, patients with fibrosis and patients with centriobular ground-glass for median lung parenchyma T1. However, mean and median global lung T1 and mean parenchyma T1 only detected significant differences between patients with emphysema and patients with no lung disease (Figure 3, Table 2).
Median and mean lung T1 values showed similar trends within patient groups, however, median global lung and parenchymal T1 showed significant differences between patients with emphysema and centrilobular ground-glass pathology seen on CT which were not seen using mean global lung analysis. Parenchymal lung T1 values showed more significant differences between patient groups and greater significance in differentiating patients with pathology seen on CT than global lung T1 (Figure 3, Table 2).
Discussion
Median and mean lung T1 values showed similar trends, indicating that both methods can be used in analysis of T1 data. However, median global lung and parenchymal T1 showed significant differences between pathology seen on CT which were not seen using mean global lung analysis, indicating that median T1 values may be a more sensitive measure of lung changes.Similarly, excluding lung vessels from lung T1 analysis increased the sensitivity to lung pathology. This is likely to be because differences in the proportion of lung vessels captured within the imaging slice will affect global lung T1 values.
Low lung T1 may be a useful indicator of lung disease, and in particular emphysema, in patients with PH. A key limitation of this work is that not all patients had CT data available, and the type of CT scan used varied between patients.
Conclusion
Excluding lung vessels from lung T1 calculations and using median as an average metric increased sensitivity of lung T1 to disease. Low lung T1 may be a useful indicator of lung disease, particularly emphysema, in patients with PH.Acknowledgements
This work was supported by MRC grant MR/M008894/1 and Wellcome Trust grant: 205188/Z/16/Z. The views expressed in this work are those of the author(s) and not necessarily those of the NHS, or the Department of Health.References
1. Stadler, A., et al., T1 mapping of the entire lung parenchyma: Influence of respiratory phase and correlation to lung function test results in patients with diffuse lung disease. Magnetic Resonance in Medicine, 2008. 59(1): p. 96-101.
2. Saunders, L.C., et al., Free breathing lung T(1)mapping using image registration in patients with idiopathic pulmonary fibrosis. Magnetic Resonance in Medicine, 2020.
3. Triphan, S.M.F., et al., Echo Time-Dependence of Observed Lung T1 in Patients With Cystic Fibrosis and Correlation With Clinical Metrics. J Magn Reson Imaging, 2020: p. e27271.
4. Triphan, S.M., et al., Echo time dependence of observed T1 in the human lung. J Magn Reson Imaging, 2015. 42(3): p. 610-6.
5. Jobst, B.J., et al., Functional lung MRI in chronic obstructive pulmonary disease: comparison of T1 mapping, oxygen-enhanced T1 mapping and dynamic contrast enhanced perfusion. PLoS One, 2015. 10(3): p. e0121520.
6. Mirsadraee, S., et al., T1 characteristics of interstitial pulmonary fibrosis on 3T MRI-a predictor of early interstitial change? Quant Imaging Med Surg, 2016. 6(1): p. 42-9.
7. Nichols, M.B. and C.B. Paschal, Measurement of longitudinal (T1) relaxation in the human lung at 3.0 Tesla with tissue-based and regional gradient analyses. Journal of Magnetic Resonance Imaging, 2008. 27(1): p. 224-228.
8. Jakob, P.M., et al., Rapid quantitative lung (1)H T(1) mapping. Journal of Magnetic Resonance Imaging, 2001. 14(6): p. 795-9.
9. Look, D.C.a.L., D. R., Time Saving in Measurement of NMR and EPR Relaxation Times. Review of Scientific Instruments 1970. 41(250).
Figures