3216
Correlation of global and regional hyperpolarised 129-Xenon MRI with quantitative CT in patients with idiopathic pulmonary fibrosis
James A Eaden1,2, Guilhem J Collier1, Ho-Fung Chan1, Nicholas D Weatherley1,2, Graham Norquay1, Smitha Rajaram3, Andy Swift1,3, Ronald A Karwoski4, Brian Bartholmai4, Stephen M Bianchi2, and Jim M Wild1,5
1POLARIS, MRI unit, Department of Infection Immunity and Cardiovascular Disease, University of Sheffield, Sheffield, United Kingdom, 2Academic Directorate of Respiratory Medicine, Sheffield Teaching Hospitals NHS Foundation Trust, Sheffield, United Kingdom, 3Sheffield Teaching Hospitals NHS Foundation Trust, Sheffield, United Kingdom, 4Mayo Clinic, Rochester, MN, United States, 5Insigneo institute, University of Sheffield, Sheffield, United Kingdom
1POLARIS, MRI unit, Department of Infection Immunity and Cardiovascular Disease, University of Sheffield, Sheffield, United Kingdom, 2Academic Directorate of Respiratory Medicine, Sheffield Teaching Hospitals NHS Foundation Trust, Sheffield, United Kingdom, 3Sheffield Teaching Hospitals NHS Foundation Trust, Sheffield, United Kingdom, 4Mayo Clinic, Rochester, MN, United States, 5Insigneo institute, University of Sheffield, Sheffield, United Kingdom
Synopsis
Correlations between 129Xe MRI measures of microstructure and gas exchange and CALIPER CT variables were evaluated both globally and regionally in IPF patients. To date, 27 subjects have undergone both baseline 129Xe DW-MRI and CT with 13 of them having baseline dissolved 129Xe imaging using a 3D radial spectroscopic method. Our findings demonstrate several significant correlations between dissolved 129Xe MRI (RBC:TP, TP:Gas, RBC:Gas) and CALIPER variables. Vessel related structures % was the only CALIPER variable that showed a significant correlation between 129Xe RBC:TP globally and in all lung zones. There were no significant correlations between 129Xe DW-MRI and CALIPER variables.
Introduction
Idiopathic pulmonary fibrosis (IPF) is a progressive lung disease, causing a reduction in gas exchange. Hyperpolarised dissolved 129-Xenon (129Xe) MRI can be used as a quantitative marker of gas exchange. The ratio of 129Xe uptake in the red blood cells to the tissue/plasma (RBC:TP) has been shown to be reduced in IPF patients when compared with healthy volunteers1-3. Apparent diffusion coefficient (ADC) is a measure of Brownian gas diffusion in the airspaces, providing information about lung microstructure. Mean diffusive length scale (LmD), is a diffusion weighted (DW) MRI measurement calculated using a stretched exponential fit model which provides additional sensitivity4. Computer-Aided Lung Informatics for Pathology Evaluation and Rating (CALIPER) quantifies various radiological parenchymal features based on histogram signature mapping techniques5 and is a quantitative CT image texture analysis software used in interstitial lung disease (ILD) research.Methods
This is a prospective, observational study of recently diagnosed IPF patients from a tertiary centre. MRI was performed on a 1.5T GE HDx scanner. 129Xe was polarised by spin-exchange optical pumping6. CT scans were performed within a year prior to the corresponding MRI scan. The CALIPER CT variables assessed included: ground glass, reticulation, fibrosis (honeycombing + reticulation), ILD (ground glass + honeycombing + reticulation) and vessel related structures (VRS).A 3D multiple b-value DW-MRI sequence (b=0, 12, 20, 30 s/cm2) was acquired and maps of ADC and LmD were calculated from 129Xe DW-MRI for each imaging voxel using a mono-exponential fit of the first two DW b-values (b=0, 12 s/cm2)4. 550mL of 129Xe was mixed with nitrogen to balance a total inhaled dose of 1L.
MR imaging of 129Xe gas/dissolved compartments used a 4-echo 3D radial spectroscopic imaging (SI) method3 (332 projections with alternated RF excitation of gas and dissolved phase, 2cm isotropic resolution, FOV=40cm, BW=31.25kHz, TR=20ms, 14s acquisition time during breath-hold) and a 1L dose of pure hyperpolarised 129Xe. 129Xe RBC:TP, TP:Gas, RBC:Gas and cardiogenic oscillations amplitude of the RBC signal (RBC %Osc) values were assessed.
Regional values were produced by separating the lung into upper, middle and lower zones, as well as central and peripheral zones. Spearman’s rank correlation was used to determine the strength of correlations. Significance was assumed at p<0.05.
Results
To date, 27 patients have undergone both baseline 129Xe DW-MRI and CT with 13 of them having also undergone baseline dissolved 129Xe imaging. No significant correlations were seen between 129Xe DW-MRI and dissolved 129Xe measurements, either globally or regionally.No significant correlation was seen between any of the CALIPER variables and either 129Xe ADC or 129Xe LmD, both globally and regionally. Examples of CALIPER CT, 129Xe ADC and 129Xe LmD images are illustrated in Figure 1.
Globally, a correlation was observed between 129Xe RBC:TP and CALIPER reticulation % (r = -0.604; p = 0.032), fibrosis % (r = -0.610; p = 0.030) and VRS % (r = -0.676; p = 0.014) (Figure 2). In the peripheral zone, a correlation was found between 129Xe RBC:TP and CALIPER ground glass % (r = -0.599; p = 0.034), ILD % (r = -0.577; p = 0.043) and VRS % (r = -0.604; p = 0.032) (Figure 3). In the central zone, a correlation was seen between 129Xe RBC:TP and VRS % (r = -0.665; p = 0.016). Table 1 demonstrates the correlations between 129Xe RBC:TP and CALIPER variables in the upper, middle and lower zones.
Correlations were observed between 129Xe TP:Gas and CALIPER ground glass % globally (r = 0.582; p = 0.040), as well as in the peripheral zone (r = 0.703; p = 0.009) and central zone (r = 0.577; p = 0.043). In the central zone, a correlation was also found between 129Xe TP:Gas and CALIPER reticulation % (r = 0.588; p = 0.038). No significant correlations were seen between 129Xe TP:Gas and CALIPER variables in the middle or lower zones. However, in the upper zone there was a correlation between 129Xe TP:Gas and CALIPER ground glass % (r = 0.639; p = 0.022), as well as CALIPER ILD % (r = 0.581; p = 0.040).
No significant correlations were observed between 129Xe RBC:Gas and CALIPER variables globally or in the peripheral and central zones. Table 2 demonstrates the correlations between 129Xe RBC:Gas and CALIPER variables in the upper, middle and lower zones. No significant correlation was observed between 129Xe RBC %Osc and any of the CALIPER variables.
Discussion
Our findings demonstrate several significant correlations between dissolved 129Xe MRI and CALIPER CT variables, globally and regionally in IPF patients. There was moderate correlation between 129Xe RBC:TP and CALIPER ILD % in the peripheral and middle zones. However, this was not seen in the lower zone which is surprising as IPF predominantly affects the lung bases. VRS % was the only CALIPER variable that showed a significant correlation between 129Xe RBC:TP globally and in all lung zones.The correlation between global 129Xe RBC:TP and CALIPER fibrosis % contradicts a previous IPF study which found no correlation between global 129Xe RBC:TP and visual CT fibrosis score2. Our findings also contradict a study using DW-MRI with hyperpolarised 3Helium in IPF patients, which demonstrated that global ADC and LmD correlates with visual CT fibrosis score7.
Acknowledgements
Study supported by Boehringer Ingelheim, National Institute for Health Research (NIHR-RP-R3-12-027) and the Medical Research Council (MR/M008894/1). The views expressed in this publication are those of the authors and not necessarily those of the National Health Service, the National Institute for Health Research or the Department of Health.References
- Kaushik SS, Freeman MS, Yoon SW, et al. Measuring diffusion limitation with a perfusion limited gas – Hyperpolarized 129Xe gas-transfer spectroscopy in patients with idiopathic pulmonary fibrosis. J Appl Physiol. 2014; 117:577-585.
- Wang JM, Robertson SH, Wang Z, et al. Using hyperpolarized (129)Xe MRI to quantify regional gas transfer in idiopathic pulmonary fibrosis. Thorax. 2018;73(1):21-8.
- Collier GJ, Eaden JA, Hughes PJC, et al. Dissolved (129) Xe lung MRI with four-echo 3D radial spectroscopic imaging: Quantification of regional gas transfer in idiopathic pulmonary fibrosis. Magn Reson Med. 2020. doi: 10.1002/mrm.28609.
- Chan HF, Stewart NJ, Norquay G, Collier GJ, Wild JM. 3D diffusion-weighted (129) Xe MRI for whole lung morphometry. Magn Reson Med. 2018;79(6):2986-95.
- Bartholmai BJ, Raghunath S, Karwoski RA, et al. Quantitative computed tomography imaging of interstitial lung diseases. J Thorac Imaging. 2013;28(5):298-307.
- Norquay G, Collier GJ, Rao M, et al. 129Xe-Rb spin-exchange optical pumping with high photon efficiency. Phys. Rev. Lett. 2018; 121:153201.
- Chan H-F, Weatherley ND, Johns CS, et al. Airway Microstructure in Idiopathic Pulmonary Fibrosis: Assessment at Hyperpolarized 3He Diffusion-weighted MRI. Radiology. 2019; 291:223-229.
Figures
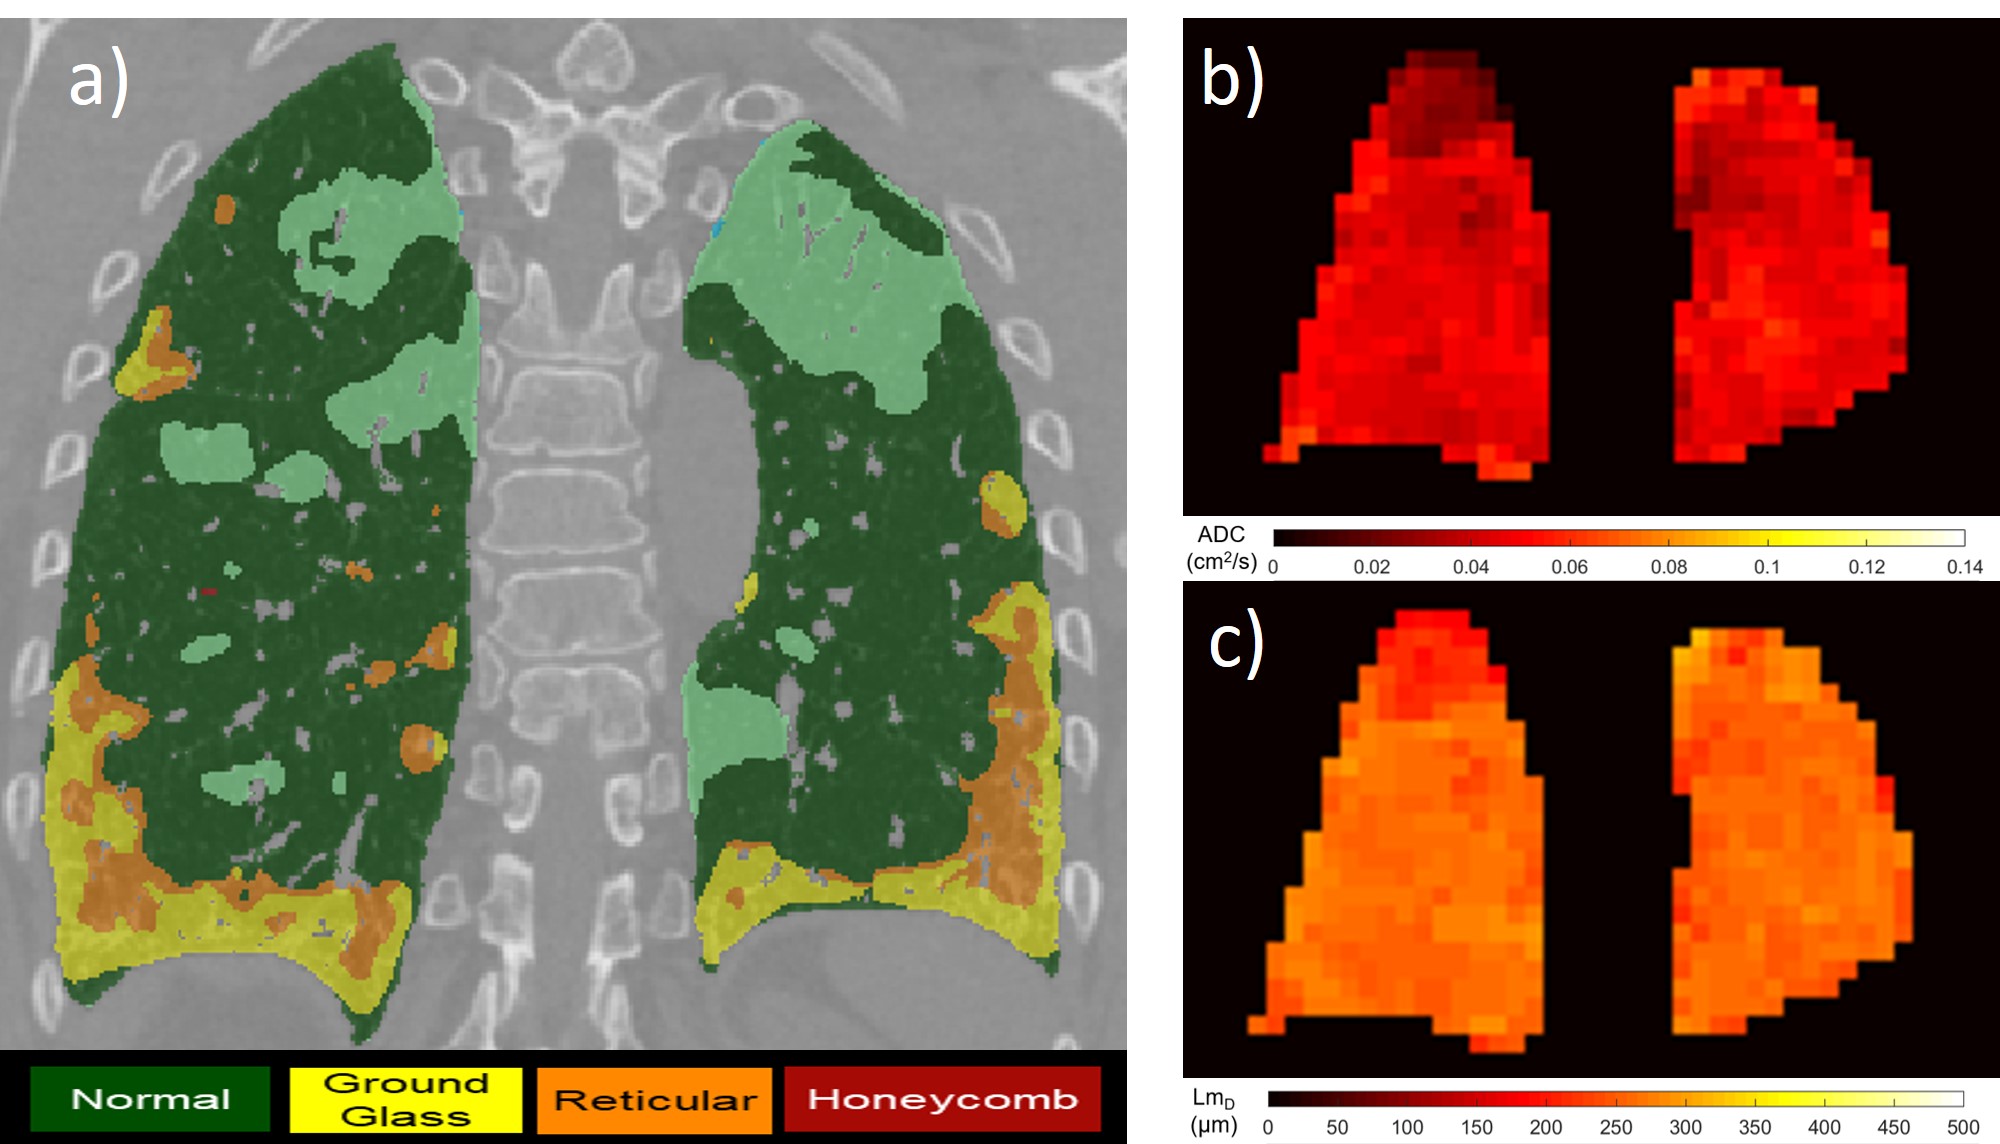
Figure 1. Examples of CALIPER CT (a), 129Xe
ADC (b) and 129Xe LmD (c) images.
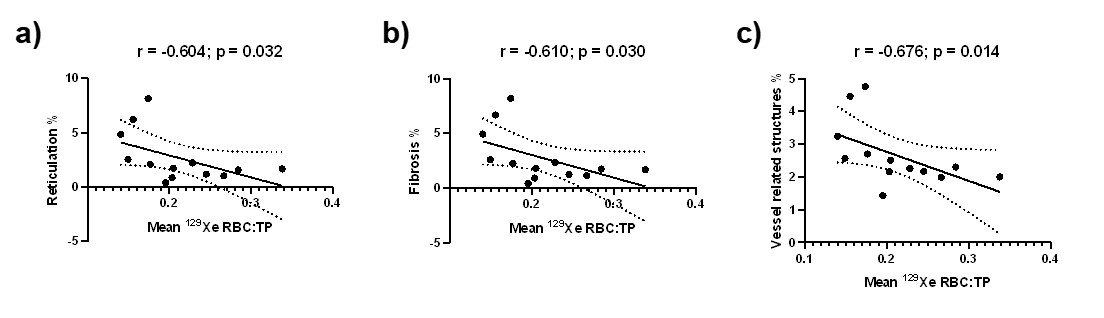
Figure 2. Correlation between global 129Xe RBC:TP and CALIPER reticulation % (a), fibrosis % (b) and vessel related
structures % (c) (n=13).
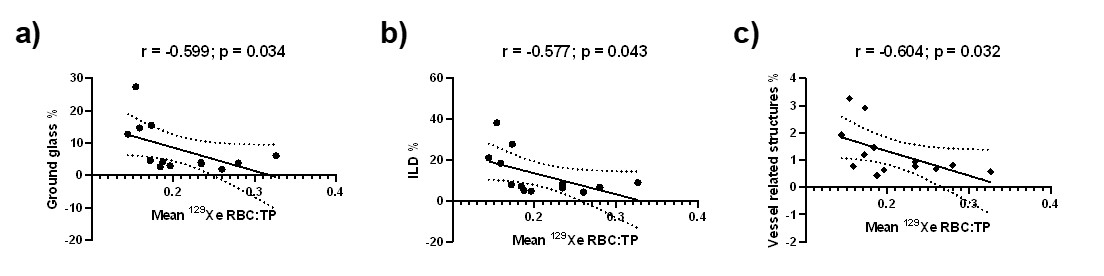
Figure 3. Correlation between peripheral zone 129Xe RBC:TP and CALIPER ground glass % (a), ILD % (b), and vessel related structures
% (c) (n=13).
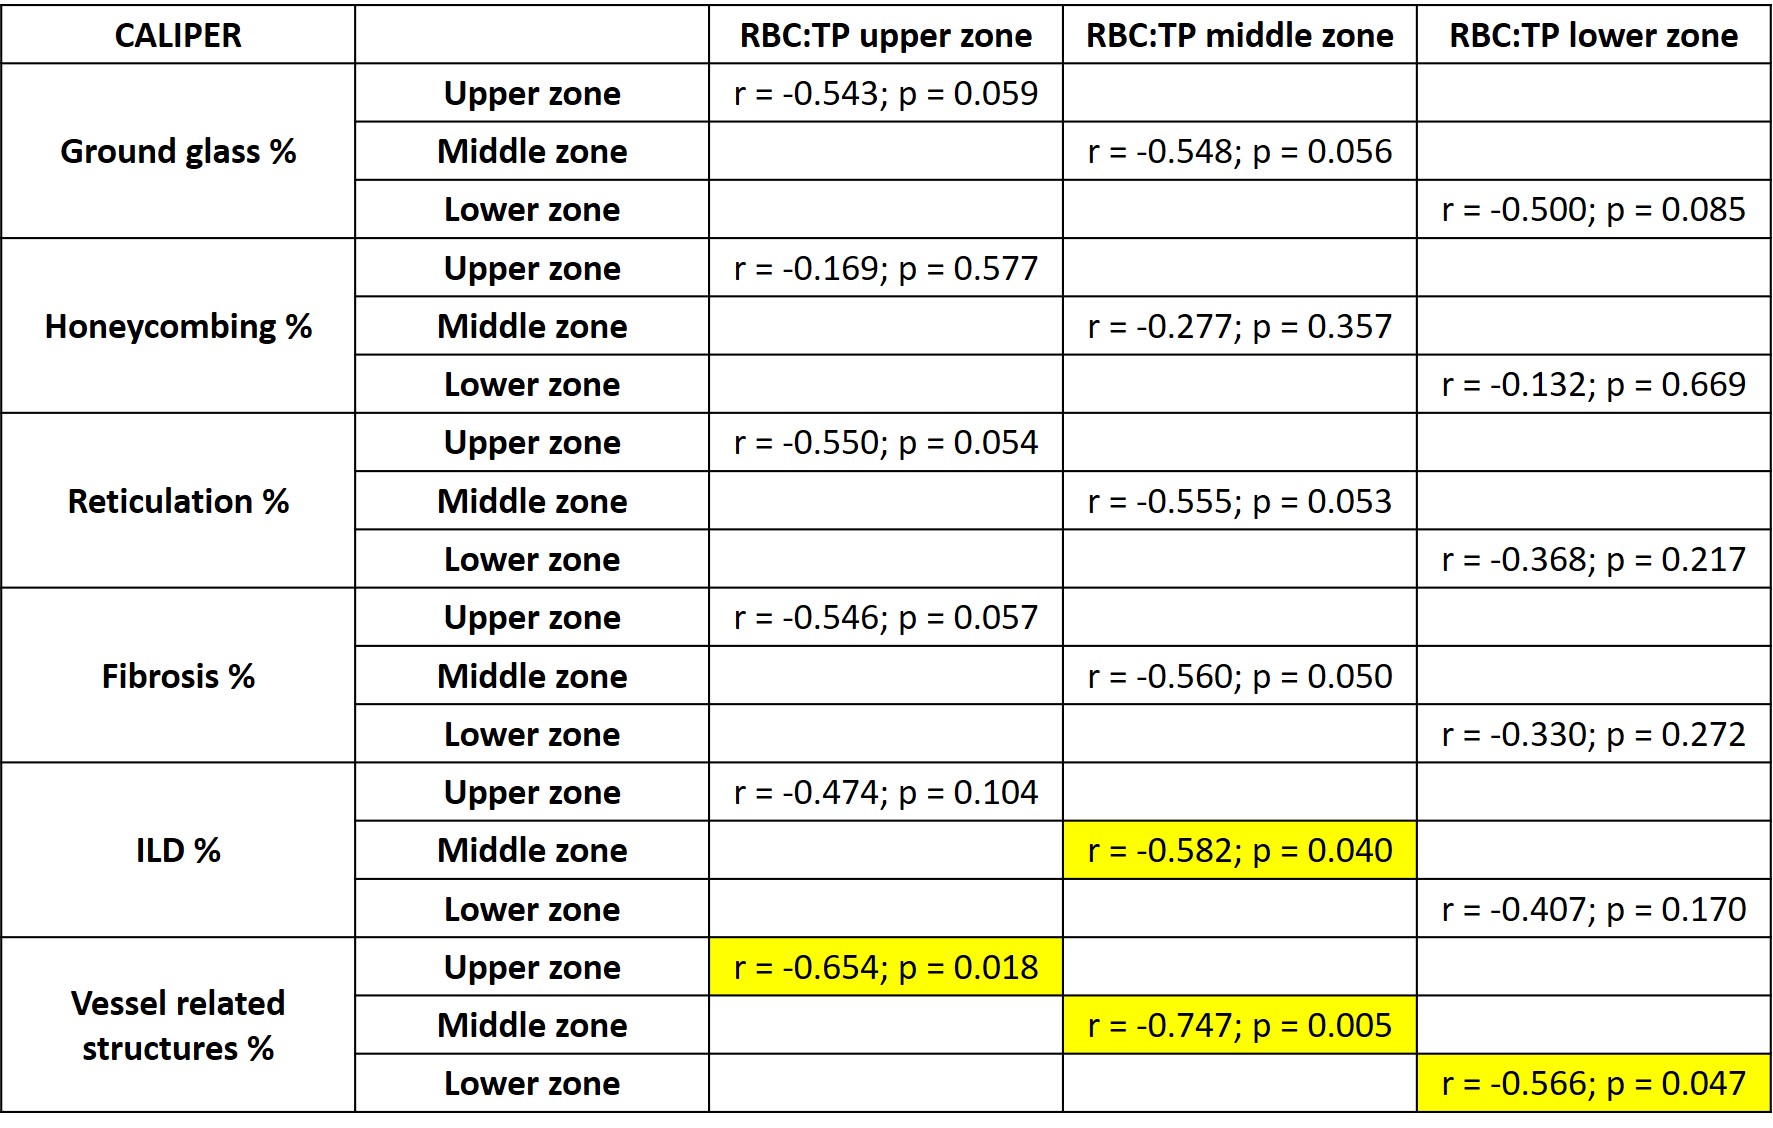
Table 1. Correlations between 129Xe
RBC:TP and CALIPER variables in
the upper, middle and lower zones (n=13). Highlighted values represent
statistical significance.
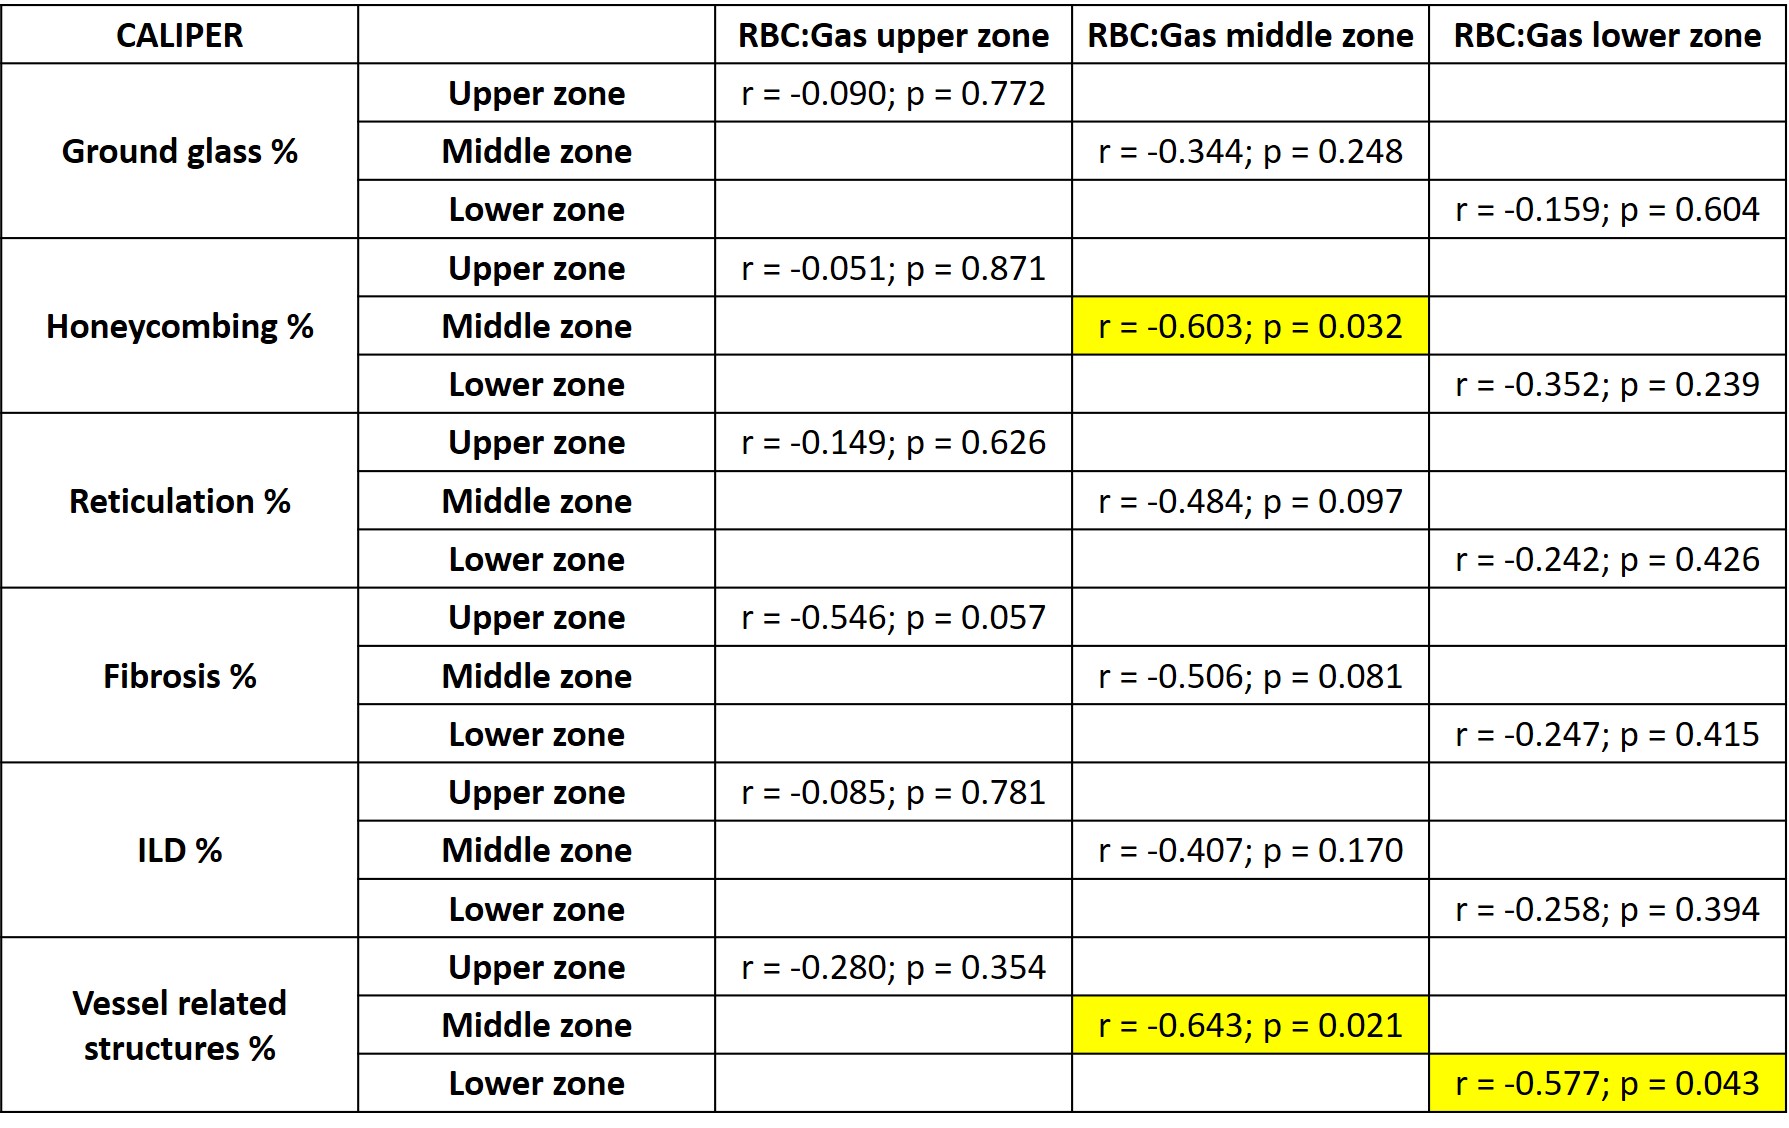
Table 2. Correlations between 129Xe RBC:Gas and CALIPER
variables in the upper, middle and lower zones (n=13). Highlighted values represent
statistical significance.