3214
Comparison of UTE 1H lung MRI with quantitative CT and hyperpolarized 129Xe diffusion-weighted MRI in IPF1Infection, Immunity and Cardiovascular Disease, University of Sheffield, Sheffield, United Kingdom, 2Radiology and Medical Physics, University of Wisconsin, Madison, WI, United States, 3Biomedical Imaging Resource, Mayo Clinic, Rochester, MN, United States, 4Academic Directorate of Respiratory Medicine, Sheffield Teaching Hospitals NHS Foundation Trust, Sheffield, United Kingdom
Synopsis
A simple signal density-based analysis of UTE 1H MRI was compared to hyperpolarized 129Xe diffusion-weighted (DW)-MRI and CALIPER CT in twelve idiopathic pulmonary fibrosis (IPF) patients at baseline and after 1 year. A statistically significant correlation between the normalized UTE signal and CALIPER interstitial lung disease percentage was observed in the lower lung zone. Trends between UTE signal and 129Xe DW-MRI metrics in the lower zone was observed, and no significant longitudinal change in UTE MRI signal was observed. UTE MRI signal is sensitive to IPF lung parenchyma changes and may demonstrate sensitivity to longitudinal changes in a larger cohort.
Introduction
Idiopathic pulmonary fibrosis (IPF) manifests in a usual interstitial pneumonia pattern predominantly in the basal and peripheral lung tissue on high resolution CT (HRCT). Image analysis software tools such as CALIPER (Mayo Clinic, Rochester, USA), can automatically characterize HRCT images for patterns of interstitial lung disease (ILD) on a voxel-wise level.1 Recently, two biomarkers of lung microstructure, ADC and mean alveolar dimension (LmD), from hyperpolarized gas diffusion-weighted (DW) MRI, were shown to be elevated in lungs with IPF, indicative of a loss of acinar integrity related to fibrosis.2,3Developments in MR acquisition techniques have allowed ultra-short echo time (UTE) 1H MRI of the lungs to approach the quality and spatial resolution of HRCT.4 UTE MRI promises similar diagnostic accuracy to HRCT in lungs with pulmonary parenchymal diseases including IPF.5 To date, no comparison of UTE MRI with 129Xe DW-MRI, or an evaluation of the longitudinal sensitivity of UTE MRI in IPF has been made. This works compares a simple signal density-based analysis of UTE MRI with 129Xe DW-MRI and HRCT in lungs with IPF at baseline and after 1 year.
Methods
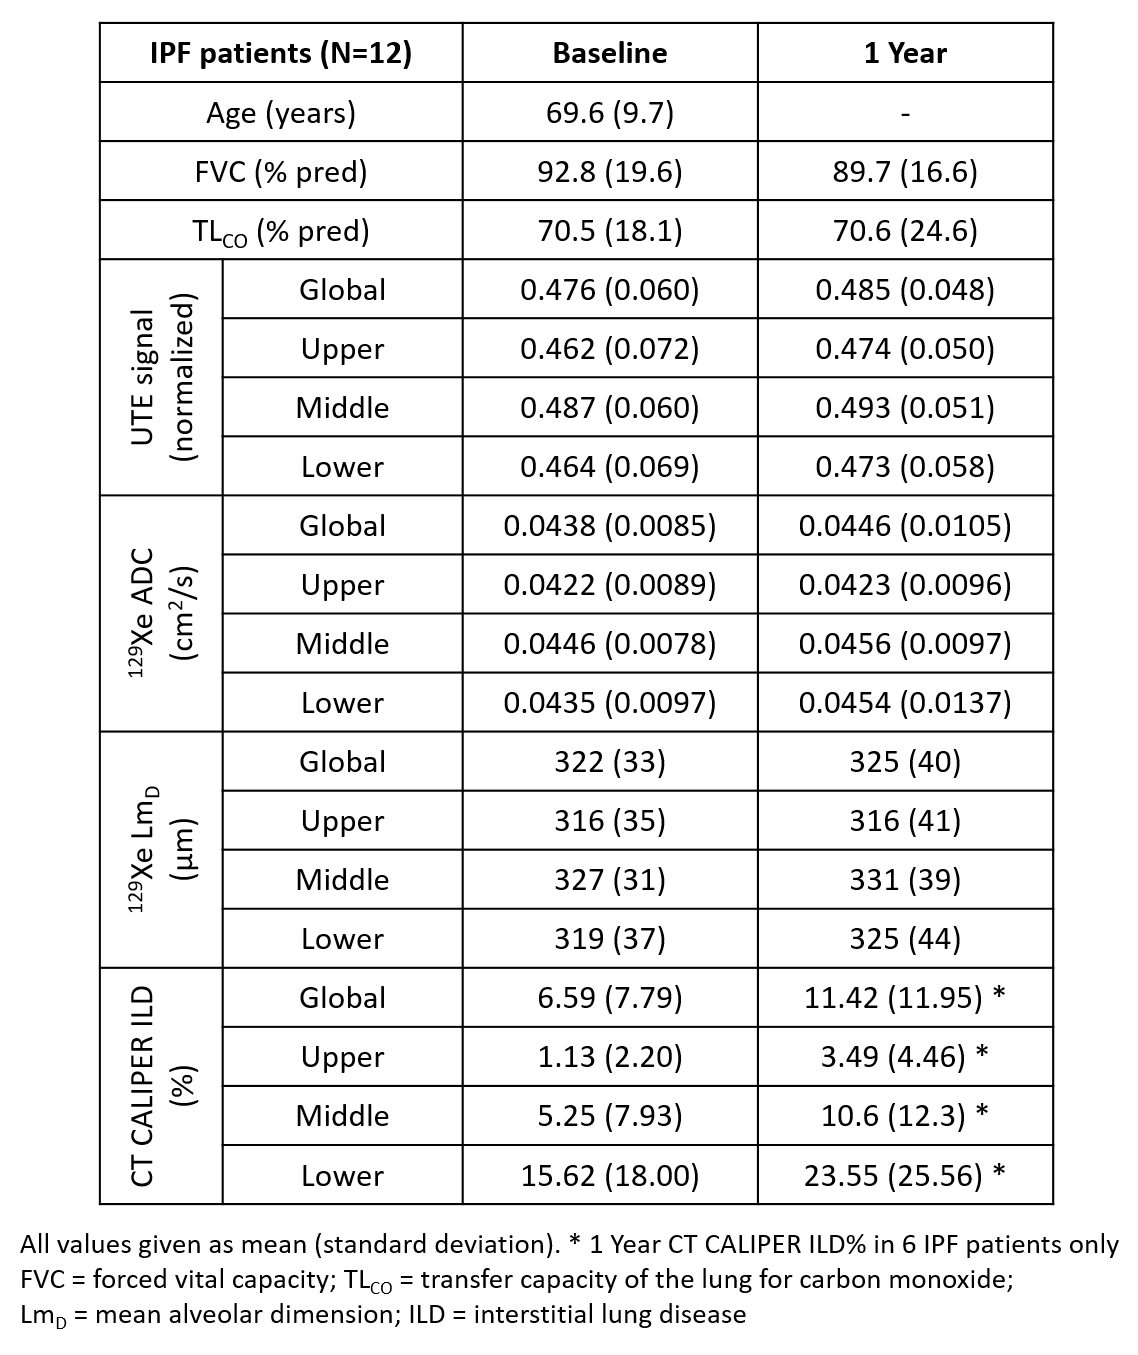
Twelve IPF patients (mean 69.6 years) underwent 1H UTE MRI and hyperpolarized 129Xe DW-MRI on a GE HDx 1.5T scanner at baseline and after 1 year. UTE MRI was acquired using an 8-element cardiac array with a 3D radial sequence during free-breathing with prospective respiratory bellows gating on expiration (reconstructed voxel size was 1.56–1.88 mm isotropic).4 129Xe DW-MRI was acquired after inhalation of a 1L bag (550mL 129Xe + 450mL N2) using a 3D multiple b-value sequence with compressed sensing.6 Each IPF patient also underwent baseline HRCT as close to the MRI visit as possible, and to date six patients have had 1 year HRCT scans.Reconstructed UTE MRI was corrected for receiver array coil signal non-uniformity retrospectively using PURE from GE Orchestra software. The UTE lung parenchyma was semi-automatically segmented using in-house code7, followed by manual editing to remove larger airways and vessels. The UTE parenchyma signal was normalized to chest muscle signal and corrected for T1 and T2* decay.8 The mean chest muscle signal was calculated from the average of twelve ROIs over three UTE image slices corresponding to the carina, top of the diaphragm, and a mid-point slice between the carina and diaphragm. Maps of 129Xe ADC and LmD were calculated for each voxel of the 129Xe DW-MRI as previously described.6 The lung parenchyma in HRCT was characterized with CALIPER software1, and the percentage of lung with an ILD pattern (honeycombing, reticular changes and ground-glass opacities) was calculated.
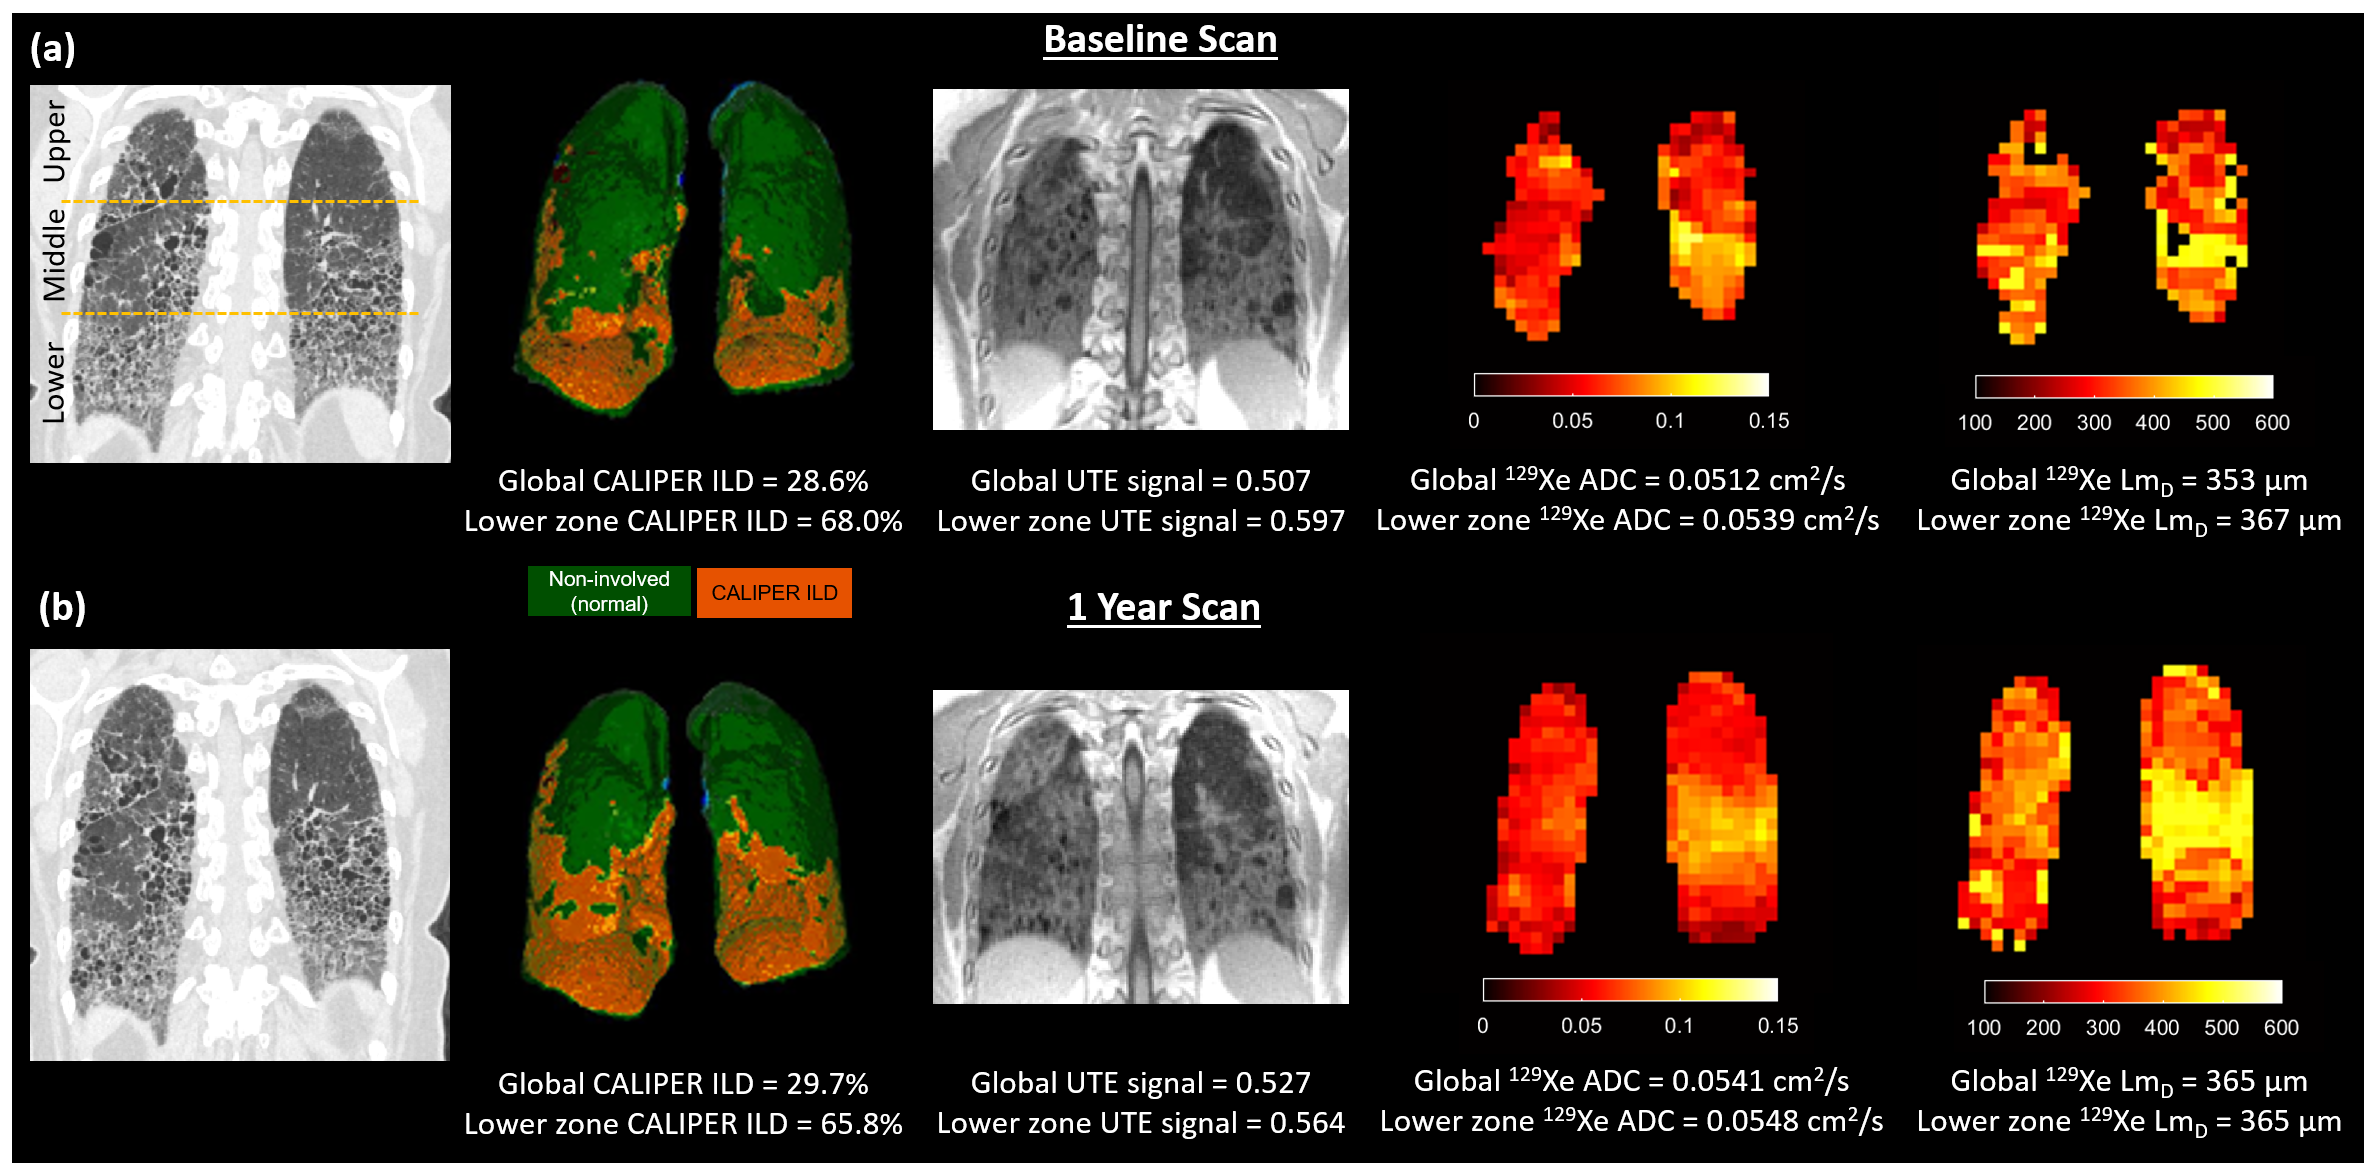
The segmented lung from UTE MRI, 129Xe DW-MRI, and HRCT was separated into three distinct zones corresponding to the upper, middle and lower lung (Figure 1a). All MRI and CT imaging metrics (UTE signal, ADC, LmD, and ILD%) from both baseline and 1 year scans were compared in each respective lung zone and globally with Pearson correlation tests. In addition, Wilcoxon-signed Rank test were performed to determine any significant difference between baseline and 1 year MRI metrics.
Results and Discussion
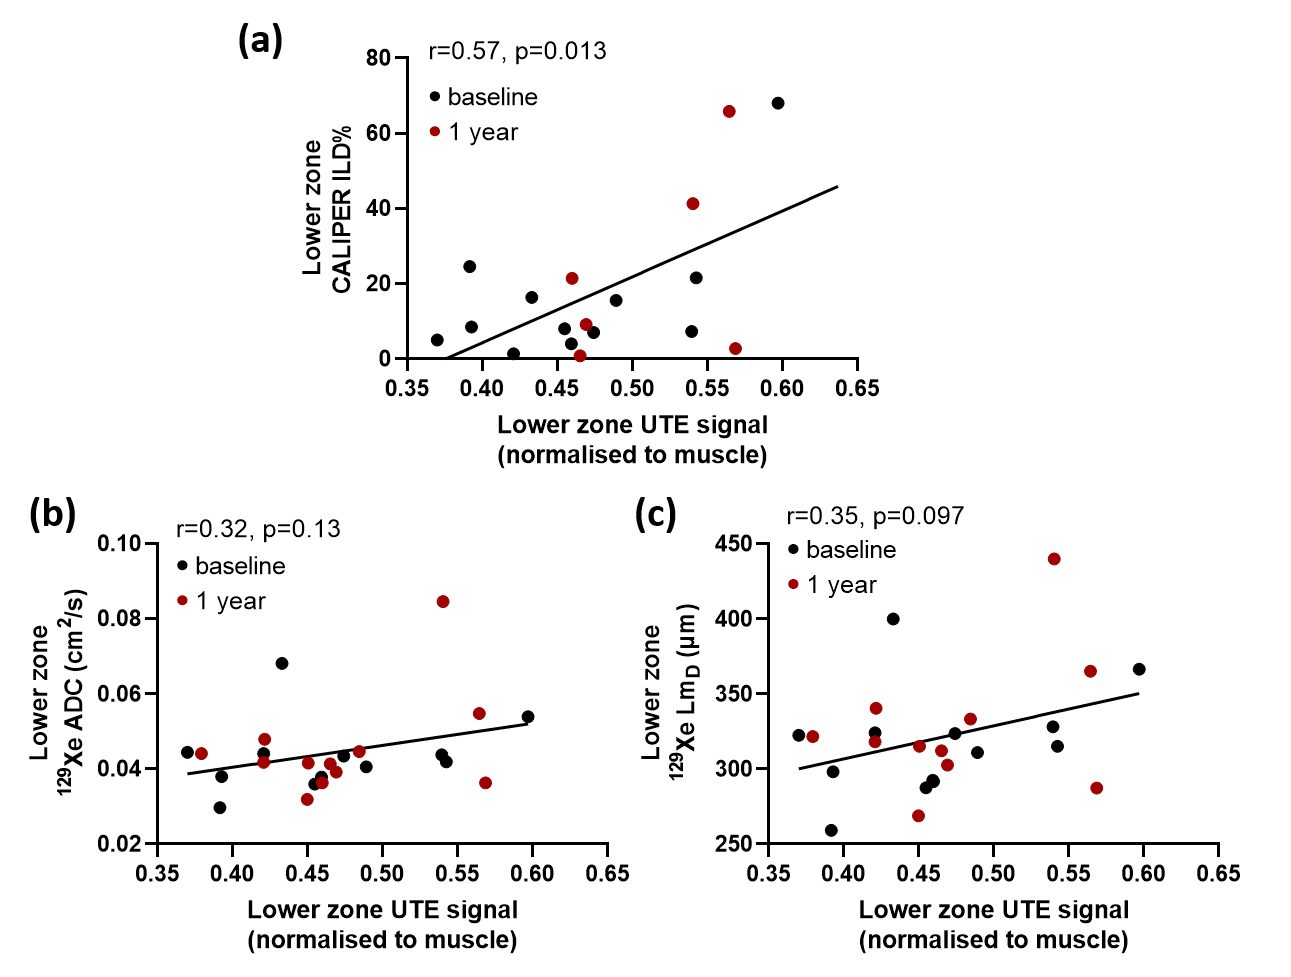
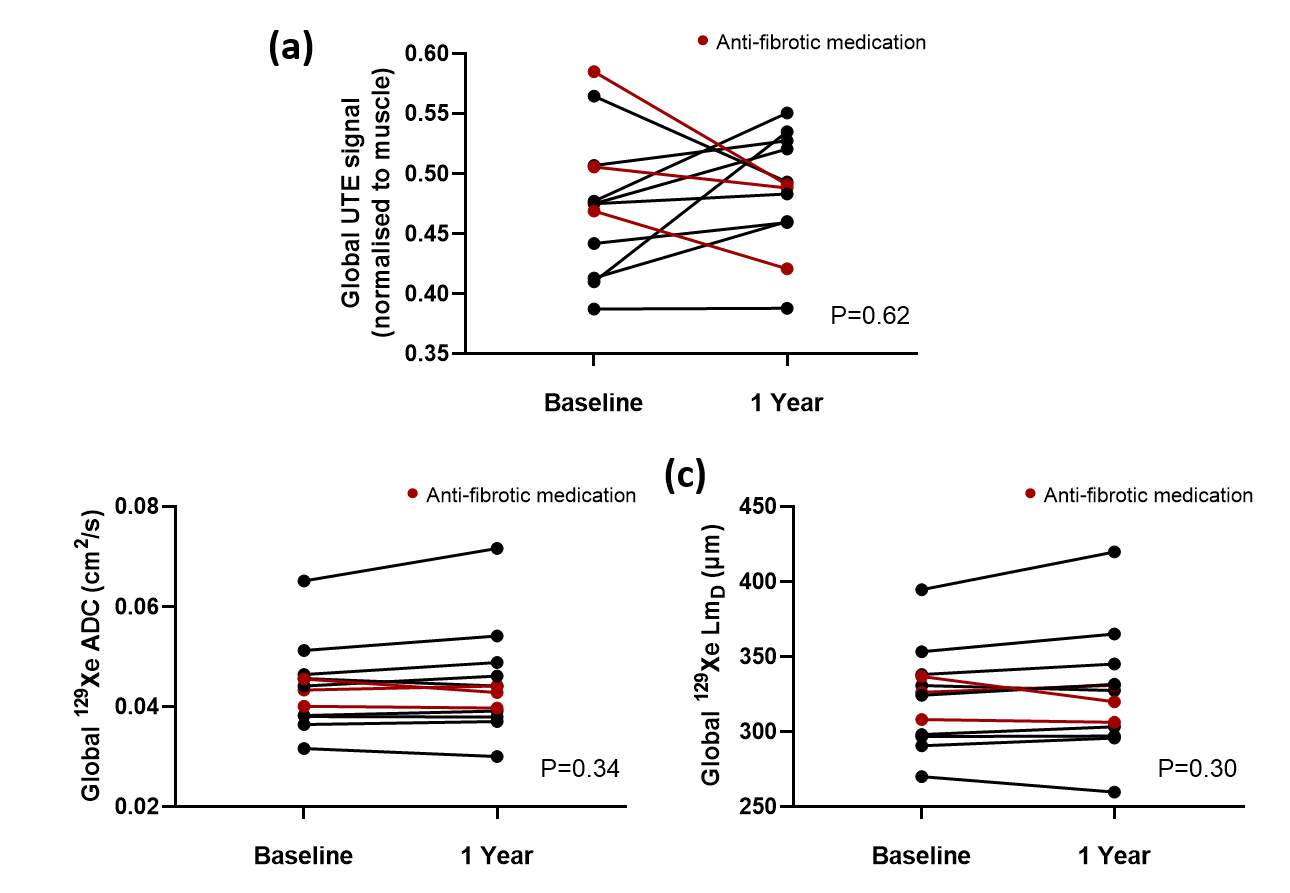
Patient demographics and imaging metrics in each lung zone for baseline and 1 year scans are summarised in Table 1. Examples images for one IPF patient at baseline and after 1 year are shown in Figure 1. With the inclusion of both baseline and 1 year scans, a statistically significant correlation was observed in the lower zone between the normalized UTE signal and the CALIPER ILD% (r=0.57, p=0.013) (Figure 2a). For 129Xe ADC and LmD, a trend with normalized UTE signal in the lower zone was observed, but was not statistically significant (Figure 2b). No significant correlations were observed between imaging metrics globally or in other regional zones. This is somewhat expected as IPF lung disease predominantly has a basal and peripheral distribution. The stronger correlations observed between UTE MRI and CT, when compared to 129Xe DW-MRI, is likely due to both imaging modalities measuring similar aspects of the lung (i.e. changes in parenchyma and airways). In contrast, 129Xe DW-MRI only measures changes in the small/acinar airways.Trends towards an increase in UTE signal, 129Xe ADC and LmD both globally and regionally were observed between baseline and 1 year scans (Figure 3), but were not statistically significant. The lack of a significant difference in 129Xe LmD is contrary to that observed previously with both 3He and 129Xe 2,3, and could be related to differences in IPF patient numbers and disease severity. For example, three IPF patients were on anti-fibrotic medication, and all three patients demonstrated a decrease in either UTE signal, 129Xe ADC and LmD between visits (see red points in Figure 3). The inclusion of more longitudinal CALIPER CT data will be the main focus for future work and will help determine the relative sensitivities of UTE MRI and CT to longitudinal changes.
Conclusion
A statistically significant correlation between the normalized UTE signal and CALIPER ILD% was observed in the lower lung zones in twelve IPF patients. UTE MRI signal is sensitive to changes in the lung parenchyma related to IPF lung disease and may demonstrate sensitivity to longitudinal changes in a larger cohort of IPF patients.Acknowledgements
This work was supported by NIHR grant NIHR-RP-R3-12-027 and MRC grant MR/M008894/1. The views expressed in this work are those of the author(s) and not necessarily those of the NHS, the National Institute for Health Research or the Department of Health.References
1. Bartholmai, B.J., et al., Quantitative computed tomography imaging of interstitial lung diseases. J Thorac Imaging, 2013. 28(5):298-307.
2. Chan, H.F., et al., Airway Microstructure in Idiopathic Pulmonary Fibrosis: Assessment at Hyperpolarized (3)He Diffusion-weighted MRI. Radiology, 2019. 291(1):223-229.
3. Eaden, J.A., et al. Regional hyperpolarised 129-xenon MR spectroscopy and diffusion-weighted MRI in patients with idiopathic pulmonary fibrosis. in Proc. Intl. Soc. Mag. Reson. Med. 2020. 2285.
4. Johnson, K.M., et al., Optimized 3D ultrashort echo time pulmonary MRI. Magn Reson Med, 2013. 70(5):1241-50.
5. Ohno, Y., et al., Pulmonary high-resolution ultrashort TE MR imaging: Comparison with thin-section standard- and low-dose computed tomography for the assessment of pulmonary parenchyma diseases. J Magn Reson Imaging, 2016. 43(2):512-32.
6. Chan, H.F., et al., 3D diffusion-weighted (129) Xe MRI for whole lung morphometry. Magn Reson Med, 2018. 79(6):2986-2995.
7. Hughes, P.J.C., et al., Spatial fuzzy c-means thresholding for semiautomated calculation of percentage lung ventilated volume from hyperpolarized gas and (1) H MRI. J Magn Reson Imaging, 2018. 47(3):640-646.
8. Higano, N.S., et al., Quantification of neonatal lung parenchymal density via ultrashort echo time MRI with comparison to CT. J Magn Reson Imaging, 2017.
Figures