3212
Differentiation of malignant and benign solitary pulmonary nodules using radial sampled T2 mapping and DW-IVIM with reduced FOV1Radiology, Renji Hospital, School of Medicine, Shanghai Jiaotong University, Shanghai, China, 2SIEMENS Healthcare, China, Shanghai, China
Synopsis
We use quantitative parameters of T2 mapping and diffusion-weighted intro-voxel incoherent movement (DW-IVIM) with reduced field of view to distinguishing different type of solitary pulmonary nodules. Our result is the 90%, maximum of T2 value, ADC value, mean and maximum of D value had significant difference between benign and malignant SPNs which mean quantitative T2 mapping and IVIM parameters may provide valuable information and serve as a supplementary imaging marker for differentiating malignant from benign SPNs.
Introduction
Magnetic resonance imaging (MRI) has been explored as an attractive potential alternative to CT due to the lack of ionizing radiation in the diagnosis of lung imaging. Although these are many methods to evaluate solitary pulmonary nodules (SPNs), these is no accurate method distinguishing different type of solitary pulmonary nodules (SPNs) using quantitative parameters of T2 mapping and diffusion-weighted intro-voxel incoherent movement (DW-IVIM) with reduced field of view.Methods
A total number of 42 consecutive patients who underwent surgical lung resection for 45 pulmonary solid nodules or mass that were detected with chest radiography or CT performed at local hospitals or clinics for suspicion of malignancy were examined. All MRI images were acquired on a 3T MR scanner (MAGNETOM Prisma, Siemens Healthcare, Erlangen, Germany) with dedicated 18-channel body and spine matrix coil. In the first part of this study, 42 patients with 45 SPNs who underwent Conventional MR sequences were scanned. Then IVIM images with reduced FOV was obtained by using a single-shot echo planar imaging (EPI) sequence and ZoomIt technique. The imaging parameters were as follows: TR/TE = 6000/71ms, δ =12.1 ms, Δ = 17.9 ms , acquisition matrix = 41 × 128, field of view (FOV) = 260×119mm, slice thickness = 4 mm, intersection gap = 0.4 mm. In addition, 9 different b factors ranging from 0 to 2000 s/mm2 were used (b = 0, 50, 100, 150, 200, 400, 600, 800, 1000 s/mm2). In order to remove the motion artifact for T2 mapping, the radial trajectory was employed with the following parameters:: Multiecho Tubro spin-echo, TR = 1420ms, TE=0, 50, 100, 150ms, Baes resolution = 256, Radial views = 324, slice thickness = 3 mm, FOV = 300×300mm, No. averages = 1. In the second part, the mean, minimum, 10%, 50%, 90%, maximum of T2 value were measured by Mazda(version 4.6) in T2mappingthe minimum, mean, maximum of were measured by PACS in ADC, D(pure diffusion coefficient), D*(pseudo-diffusion coefficient) and f(perfusion fraction) maps. In the third part, to compare the quantitative parameter difference between malignant and benign, all parameter was compared by using Student’s t test and Mann-Whitney U test. A p-value<0.05 was considered statistically significant. All imagine statistical analysis was performed with the statistical software: GraphPad and MedCalc statistical software.Result
According to the result of pathological examination, 45 pulmonary nodules were diagnosed and classified into two groups: benign pulmonary nodules (n=20) and malignant pulmonary nodules (n=25). The 90% and maximum T2 value had significant difference between benign and malignant SPNs. There were the most significant differences between the maximum T2 values for benign and malignant (p = 0.001), with higher T2 values for benign SPNs compared to malignant. The sensitivity and specificity for the differentiation of benign from malignant tumors were 80%and 75% respectively, using a threshold value of ≥130.5ms. The mean of ADC had significant differences between benign and malignant SPNs. The sensitivity and specificity for the differentiation of benign from malignant were 80% and 85% respectively, using a threshold value of ≥1.130 × 10⁻³ mm2 /s. At the same time, the mean and maximum of D value had significant differences between benign and malignant SPNs, whereas the maximum D value (Dmax>0.916 × 10⁻³ mm2 /s) independently distinguished malignant nodules from benign nodules which sensitivity and specificity were 72.73% and 86.6%.Discussion
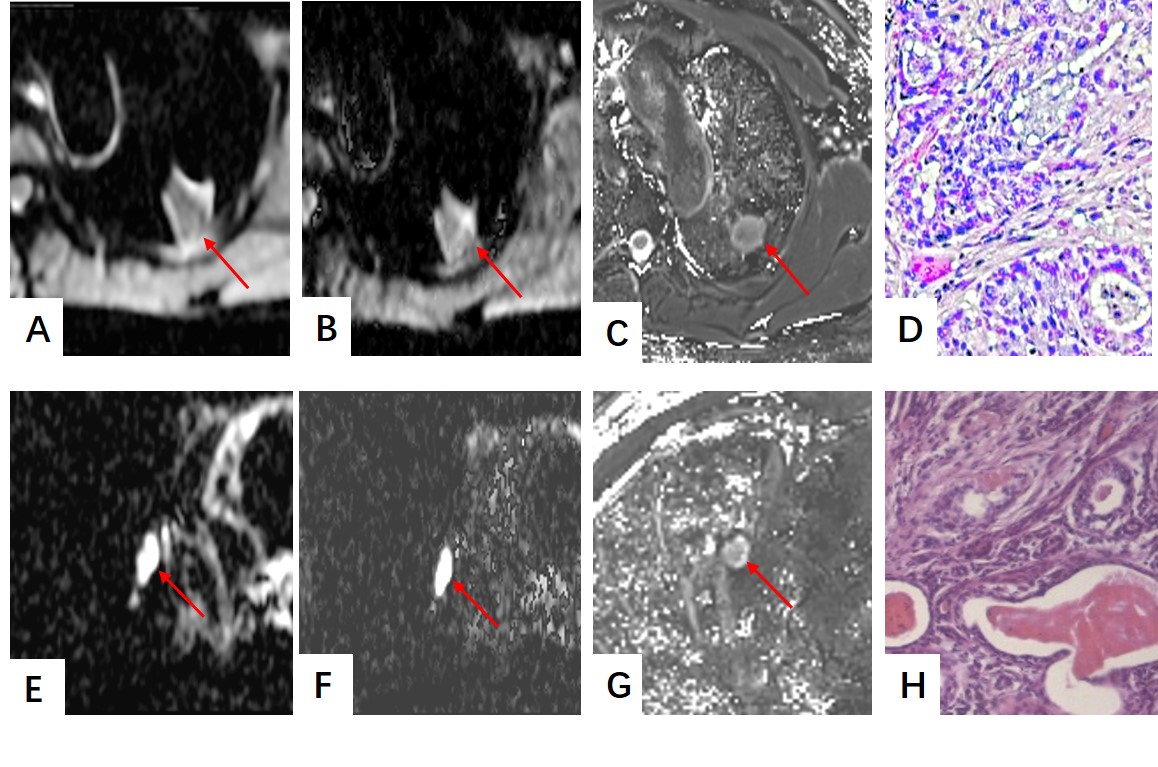
T2 mapping is sensitive to tissue hydration or edema without the need for contrast agents and thus shows the potential to become a ‘non-invasive biopsy’(1, 2). While malignant nodules are associated with nuclear polymorphism, higher cellularity and nuclear-to-cytoplasmic ratios, benign nodules such as inflammation or pulmonary sclerosing pneumocytoma (Fig.1) was characterized by more extracellular fluid space and tissue fluid which would make T2 value rise with malignant nodules. Although DWI and ADC has been an independent biomarker in distinguishing benign from malignant nodules, a small scope DW-IVIM also could provide more sensibility in analysis of the diffusion weighted in SPNs(3-5).Conclusion
Quantitative T2 mapping and DW-IVIM parameters could provide valuable information and serve as a supplementary imaging marker for differentiating malignant from benign SPNs.Acknowledgements
Funding: This research was supported by the National Natural Science Foundation of China (Grant No.81571670).References
1. Adams LC, Bressem KK, Jurmeister P, Fahlenkamp UL, Ralla B, Engel G, et al. Use of quantitative T2 mapping for the assessment of renal cell carcinomas: first results. Cancer Imaging. 2019;19(1):35.
2. Mai J, Abubrig M, Lehmann T, Hilbert T, Weiland E, Grimm MO, et al. T2 Mapping in Prostate Cancer. Investigative radiology. 2019;54(3):146-52.
3. Wan Q, Deng Y-S, Zhou J-X, Yu Y-D, Bao Y-Y, Lei Q, et al. Intravoxel incoherent motion diffusion-weighted MR imaging in assessing and characterizing solitary pulmonary lesions. Sci Rep. 2017;7:43257. 4. Koo CW, Lu A, Takahashi EA, Simmons CL, Geske JR, Wigle D, et al. Can MRI contribute to pulmonary nodule analysis? J Magn Reson Imaging. 2019;49(7):e256-e64.
5. Çakmak V, Ufuk F, Karabulut N. Diffusion-weighted MRI of pulmonary lesions: Comparison of apparent diffusion coefficient and lesion-to-spinal cord signal intensity ratio in lesion characterization. J Magn Reson Imaging. 2017;45(3):845-54.
Figures