3211
Analysis of the diagnostic value of multimodal magnetic resonance imaging for non-small cell lung cancer1Department of Radiology, Zhengzhou University People’s Hospital & Henan Provincial People’s Hospital, Zhengzhou, China, 2Department of Radiology, Henan University People’s Hospital & Henan Provincial People’s Hospital, Zhengzhou, China, 3Henan Provincial People’s Hospital, Zhengzhou, China, 4Central Research Institute, UIH Group, Shanghai, China, 5Central Research Institute, UIH Group, Beijing, China, 6UIH America, Inc. 9230 Kirby Dr. STE600, Houston, TX, United States
Synopsis
Chemical exchange saturation transfer (CEST) is a new type of MRI technology, can selectively label the exchangeable hydrogen protons in endogenous or exogenous free macromolecules. Intravoxel incoherent motion (IVIM) MRI can be separated to obtain information related to true water molecule diffusion and microcirculation perfusion through double exponential model analysis. Our research shows that CEST and IVIM have similar diagnostic performance in the differential diagnosis of lung squamous cell carcinoma and lung adenocarcinoma.
Introduction
Lung cancer is the most common cancer in the world 1, and most cases (85-90%) are non-small cell lung cancer. Chemical Exchange Saturation Transfer (CEST) MRI is a new in vivo molecular imaging technology based on the exchange of saturated protons and protons in the surrounding flowing water 2. Amide proton transfer (APT) imaging is based on CEST-based MRI technology, which can sensitively detect free proteins and peptides in tissues 3. In vivo incoherent motion (IVIM) imaging is a technique that simultaneously evaluates tissue perfusion and diffusion by using single diffusion-weighted imaging with different numbers of b-values 4. At present, there are few researches on the application of CEST and IVIM in lung disease, especially for non-small cell lung cancer, a common tumor. The purpose of this study is to explore the possibility of applying CEST and IVIM techniques to differentially diagnose lung squamous cell carcinoma and lung adenocarcinoma, and to compare which technique has a better diagnostic effect.Materials and Methods
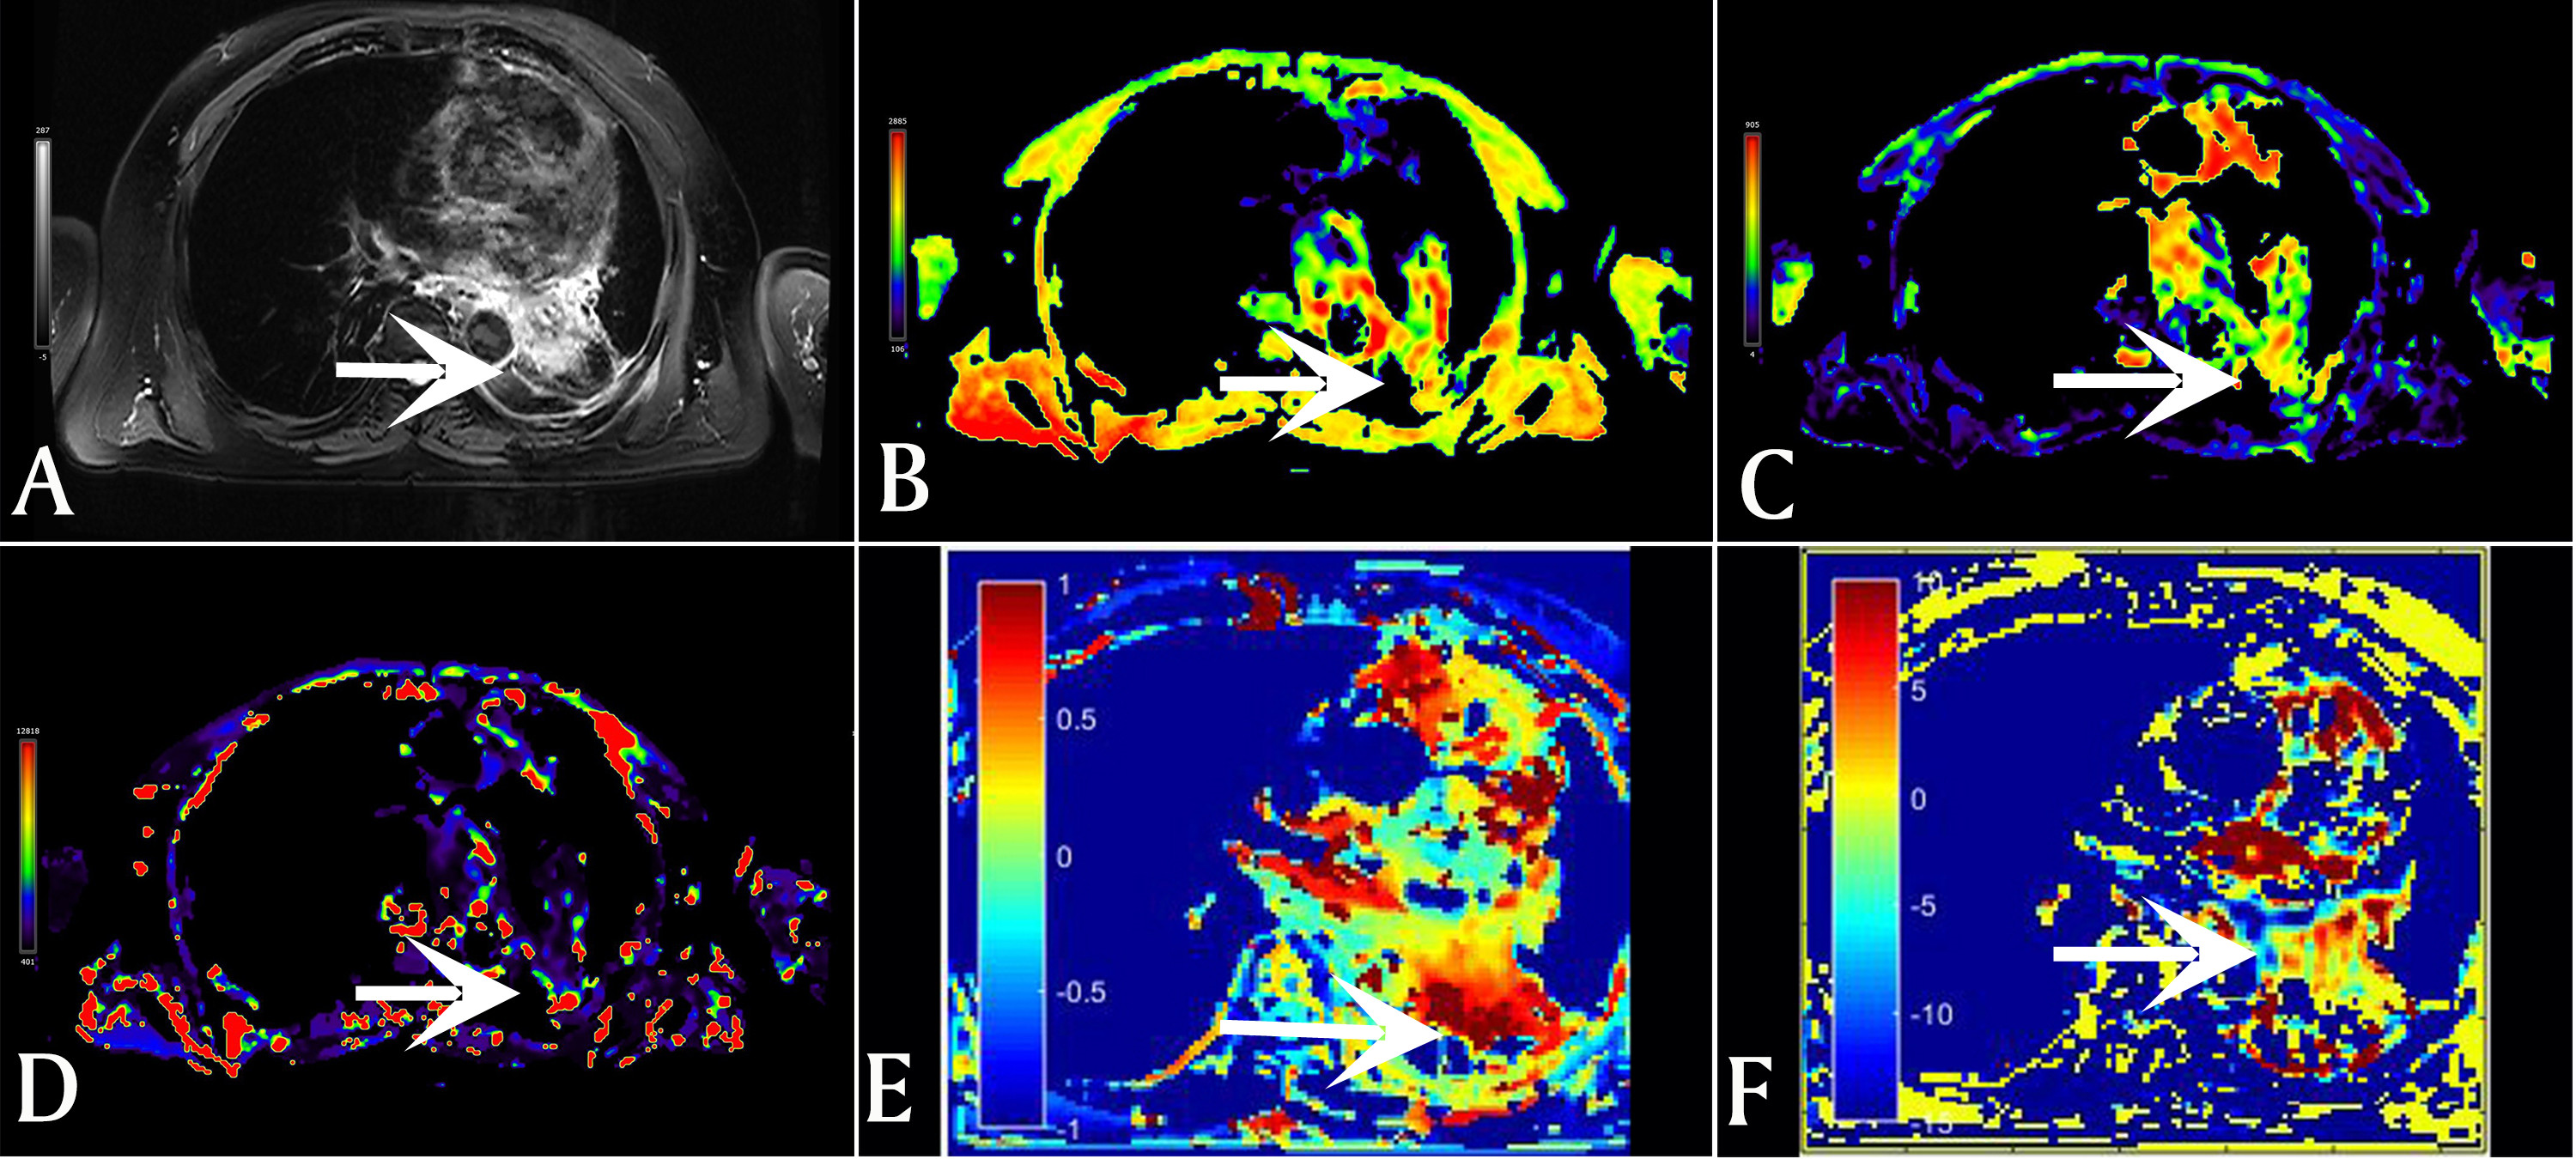
The study protocol was reviewed and approved by the local ethics committee and written informed consent was obtained.Taking pathological results as the gold standard, 18 patients were selected, 12 of which were lung adenocarcinoma and 6 were lung squamous cell carcinoma. MRI was performed on a hybrid 3.0T PET/MR scanner (uPMR790, UIH, Shanghai, China) with an 12 channels phased-array body coil. The IVIM sequence was set with the following parameters: TR= 1620 ms, TE= 69.6 ms; b-values = 0, 25, 50, 100, 150, 200, 400, 600, 800, and 1000 s/mm2, NEX = 1, 1, 2, 2, 4, 4, 6, 6, 8, 10. CEST MRI was performed by using a single slice FSE protocol, parameters are as follows: ETL = 39, B1 = 1.3μT and 2.5μT, Gaussian pulse, 100ms duration, 10 repeat, Δ spanned from [-4.5 4.5] ppm in 31 steps, plus one S0 with no CEST saturation pulse for normalization; 11 low power B1 = 0.13μT, Δ spanned from [-1.0 1.0] ppm images were collected as WASSAR images for B0 map correction, TR/TE/Flip Angle = 4500ms/35.4ms/160o.The ROI was placed to cover as much of the solid tumor as possible to avoid large blood vessels and bleeding, calcification, cystic, and necrotic areas. Data analysis uses SPSS 26.0 and Medcalc 15.0. The analysis between groups used independent samples t test. Pearson correlation coefficient was used to analyze the correlation between MTrasym (3.5ppm) and D, D*, f. The ROC curve is generated to evaluate the diagnostic accuracy and threshold of each parameter. The Delong method was used to compare the area under the curve of different parameters. The Spearman correlation analysis was used to show the correlation between the MTRasym (3.5ppm), D, D*, and f values.P<0.05 was considered statistically significant.Results
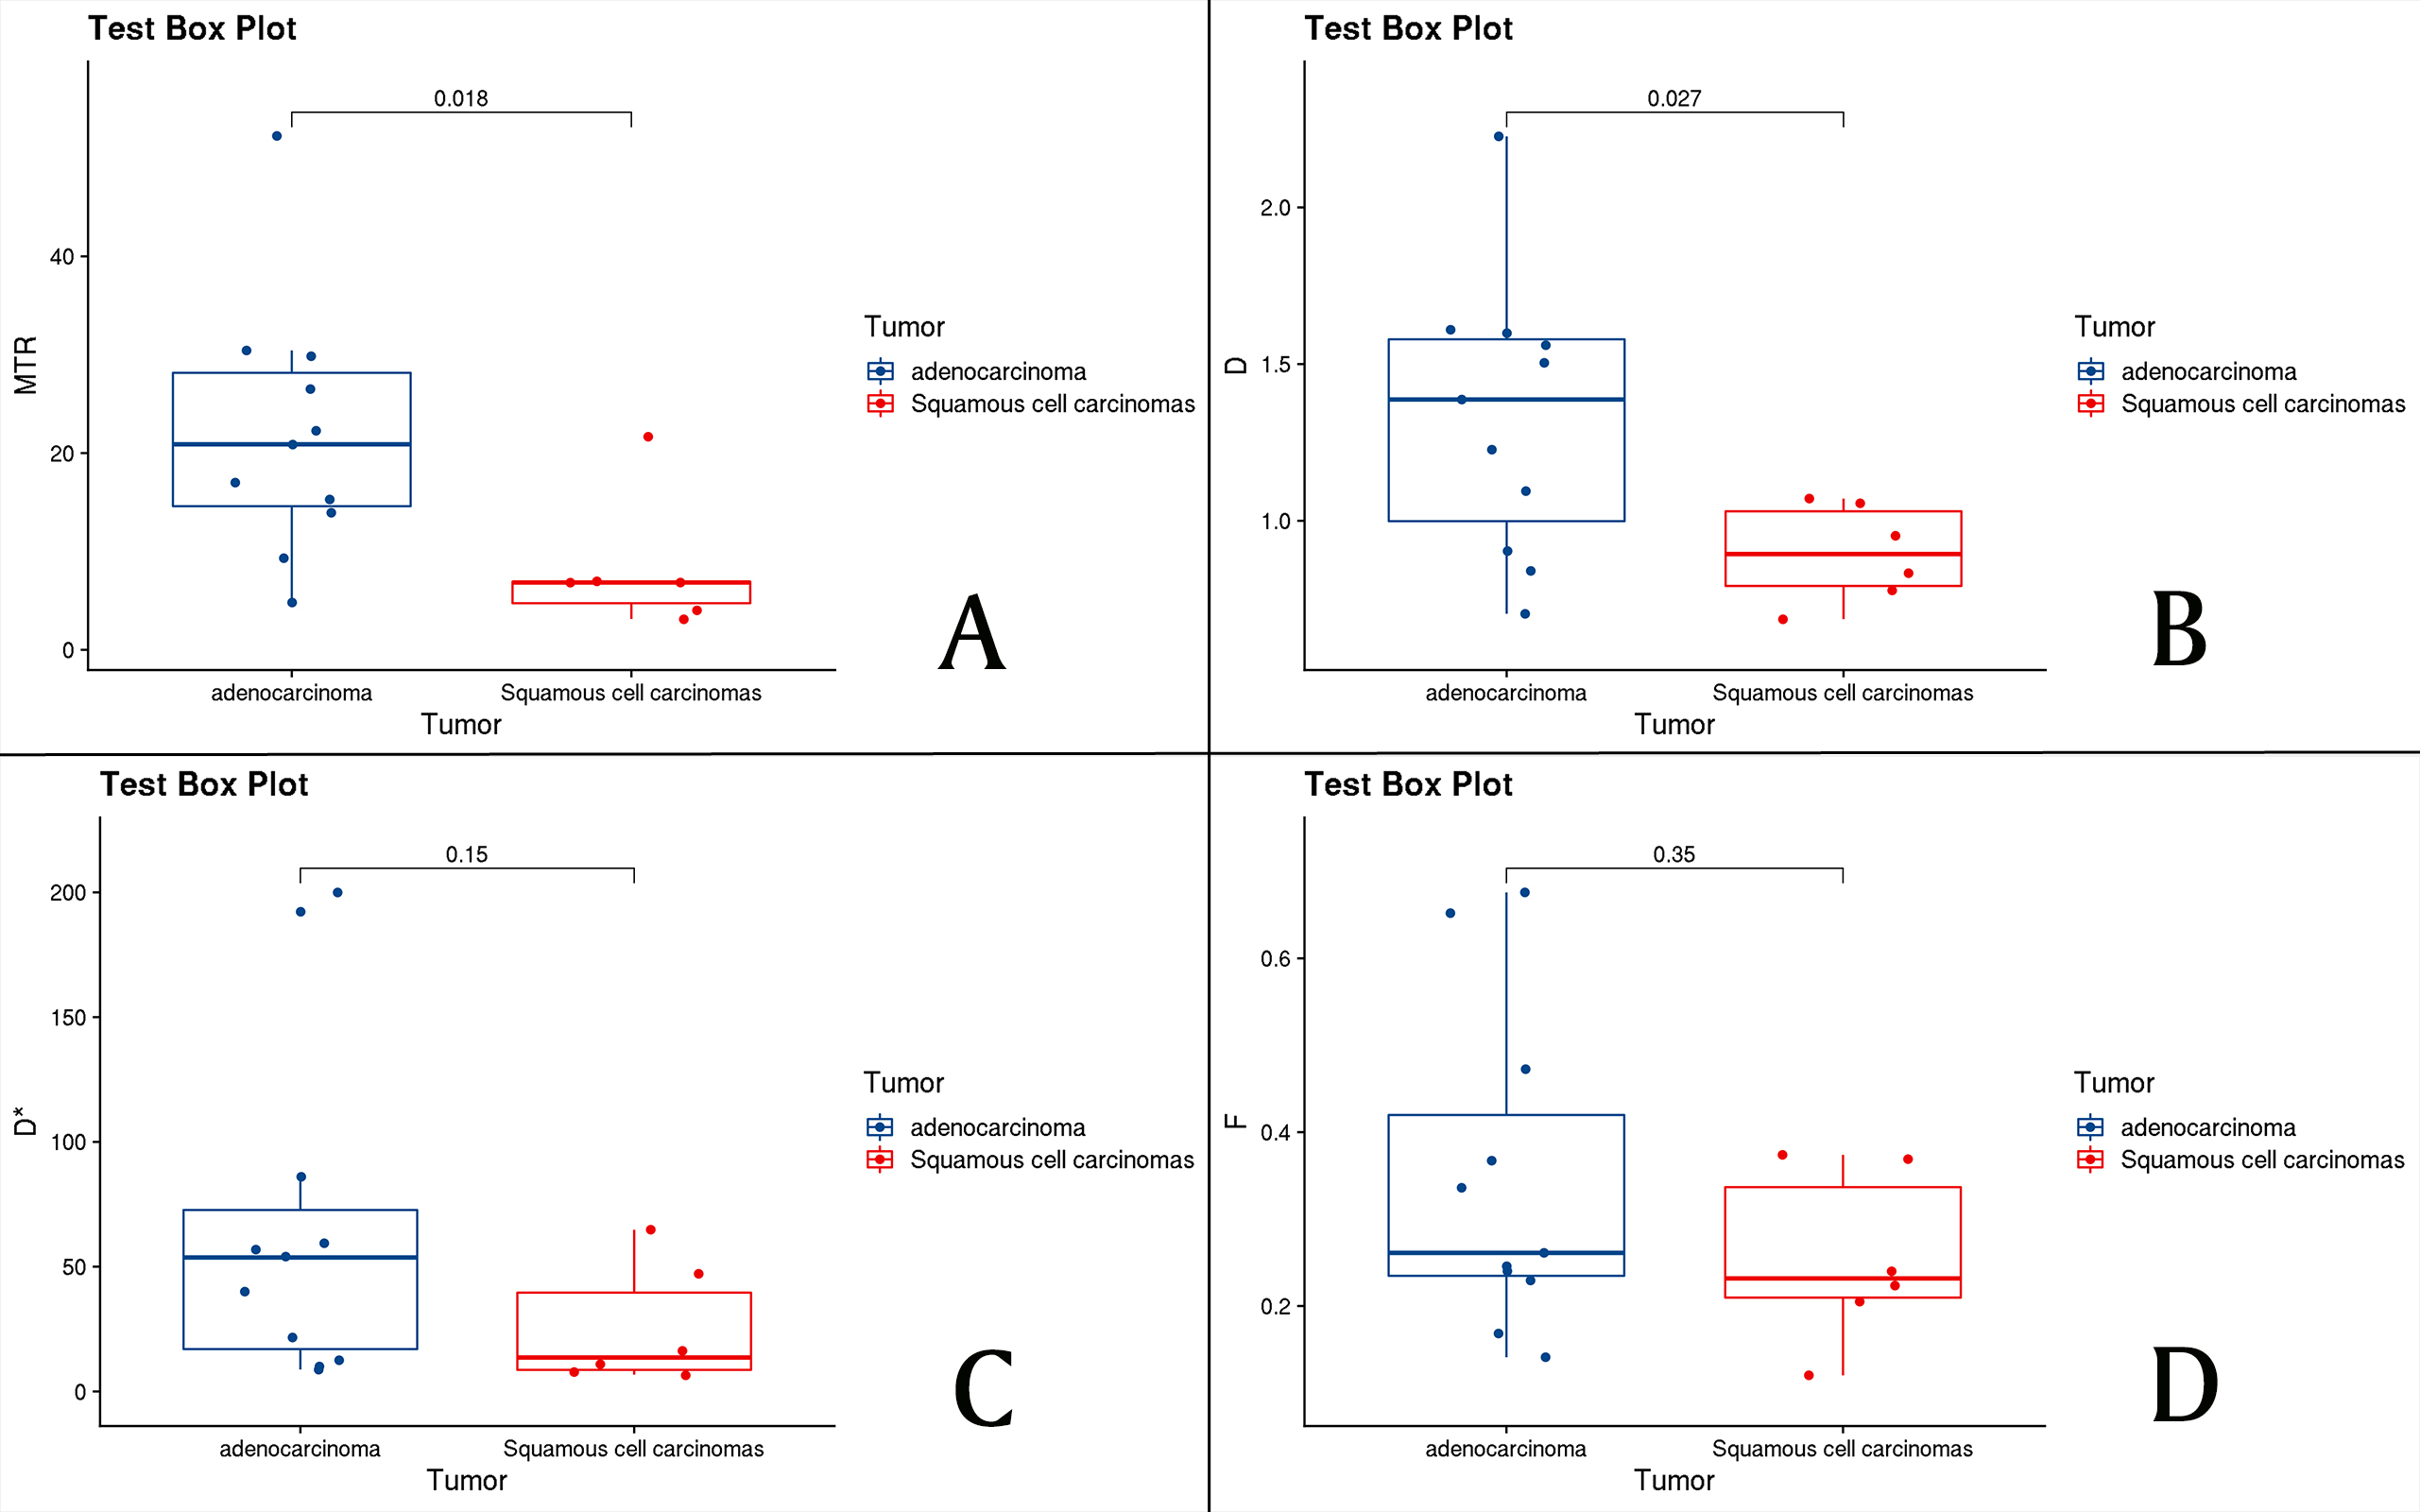
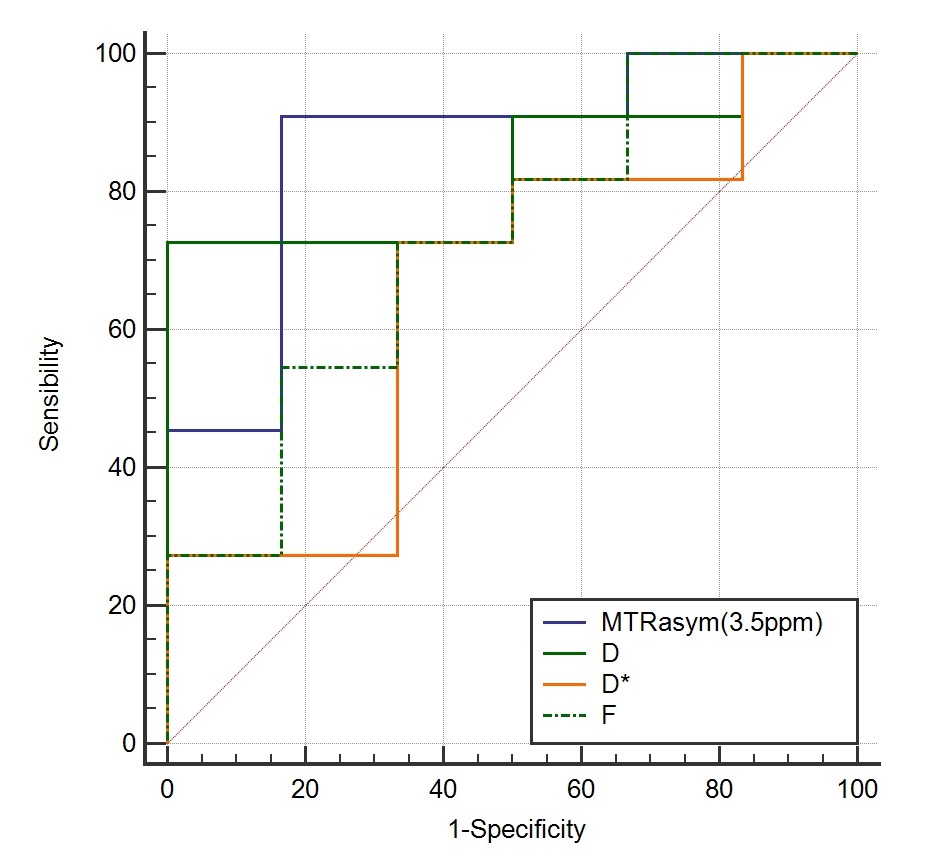
Lung adenocarcinoma [(22.04±12.87)%, (1.33±0.44)×10-3mm2/s)] group of MRasym (3.5ppm) and D values were higher than lung squamous cell carcinoma [(8.25±6.77)%, (0.89± 0.16)×10-3mm2/s] group. The D* and f value of the Lung adenocarcinoma [(67.34±68.22)×10-3mm2/s], (0.34±0.18) group were not significantly different from those of the lung squamous cell carcinoma group[(25.66±24.43)10-3mm2/s, (0.26±0.09) ] . MTRasym (3.5ppm) of APTWI and D value of IVIM showed AUC of 0.864 and 0.833, respectively, with no significant difference (Z=0.209, P=0.83). The Spearman correlation analysis shows that there is no correlation between the four parameters.Discussion
The MRasym (3.5ppm) and D values of the lung adenocarcinoma group were higher than those of the lung squamous cell carcinoma group. The reason may be related to the structure and function of the cells. Compared with lung squamous cell carcinoma, lung adenocarcinoma has a loose structure, can secrete a large amount of mucus, increase the content of protein and peptide, and is conducive to the diffusion of water molecules 5. In addition to these reasons, these results may also be related to the heterogeneity of the microenvironment and the atypicality of cells.Conclusion
CEST and IVIM are both effective diagnostic techniques for lung tumors, and have similar diagnostic effects in the diagnosis of non-small cell lung cancer (NSCLC).Acknowledgements
The National Key R&D Program of China (2017YFE0103600), the Henan Medical Science and Technology Research Program (2018020357 and 2018020367), the National Natural Science Foundation of China (81720108021 and 31470047), and Zhongyuan Thousand Talents Plan Project - Basic Research Leader Talent (ZYQR201810117).References
1. World Health Organization. GLOBOCAN 2012: estimated cancer incidence, mortality and prevalence worldwide in 2012. 2012.
2. Ward KM, Aletras AH, Balaban RS. A new class of contrast agents for MRI based on proton chemical exchange dependent saturation transfer (CEST) [J]. J Magn Reson, 2000, 143: 79-87.
3. Zhou J, Payen JF, Wilson DA, Traystman RJ, van Zijl PC. Using the amide proton signals of intracellular proteins and peptides to detect pH effects in MRI. Nat Med. 2003 Aug;9(8):1085-90.
4. Le Bihan D,Breton E,Lallemand D,et al. Separation of diffusion and perfusion in intravoxel incoherent motion MRimaging.Radiology[J],1988,168: 497-505.
5.Hutchinson BD, Shroff GS, Truong MT, Ko JP. Spectrum of Lung Adenocarcinoma. Semin Ultrasound CT MR. 2019 Jun;40(3):255-264.
Figures