3206
The value of PET/MRI in the identification of non-small cell lung cancer: stretch index diffusion imaging and metabolic parameters1Department of Radiology, Henan University People’s Hospital & Henan Provincial People’s Hospital, School of Basic Medicine, zhengzhou, China, 2Department of Radiology, Zhengzhou University People’s Hospital & Henan Provincial People’s Hospital, Academy of Medical Sciences, zhengzhou, China, 3Department of Radiology, the First Affiliated Hospital of Henan Medical University, Kai Feng, China, 4Central Research Institute, UIH Group, Shanghai, China, zhengzhou, China, 5Central Research Institute, UIH Group, Beijing, China, Bei Jing, China, 6UIH America, Inc, Houston, TX, United States, Houston, TX, United States
Synopsis
PET/MRI is a very promising technology. PET can reflect metabolism, and stretch index diffusion imaging can reflect molecular diffusion rate and heterogeneity. The results show that the combination of the two has the best identification effect, and further analysis shows that SUVmax is negatively correlated with α.
Introduction
Non-small cell lung cancer (NSCLC) accounts for about 80% of all lung cancers. It is one of the most common malignant tumors and the most common cause of death in men [1], 18F-FDG-PET/MRI combines the functional and metabolic characteristics of PET with the good soft-tissue contrast of MRI, which can provide more accurate diagnostic results for lung cancer [2], Compared with double index and single index imaging, stretch index diffusion imaging in MRI can reflect the heterogeneity of diffusion in tumor tissues, allows for the study of the difference between tumor subtypes or heterogeneity between tumors in more depth [3]. At present, some studies apply PET-CT parameters to the differential diagnosis of lung cancer. However, there is no research to use the stretch index model in combination with related parameters in integrated PET/MRI to compare lung cancer. The purpose of this work is to study the stretch index diffusion imaging and volume parameters in distinguishing squamous cell carcinoma (SCC) and adenocarcinoma (AC) and to compare the diagnostic efficacy of different diagnoses using PET/MR.Materials and Methods
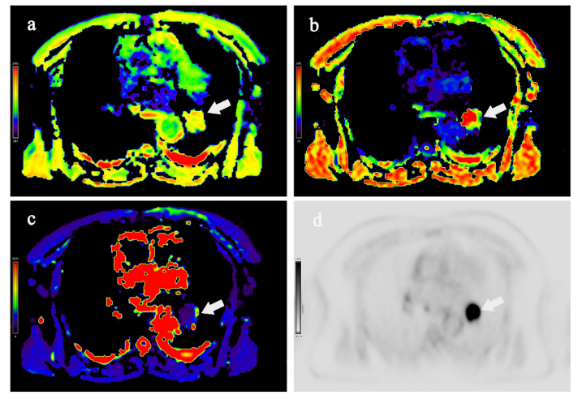
The study protocol was reviewed and approved by the local ethics committee and written informed consent was obtained. In this study, a total of 25 cases of NSCLC, 8 cases of SCC, and 17 cases of AC were selected to be pathologically diagnosed. MRI was performed on a hybrid 3.0T PET/MR scanner (uPMR790, UIH, Shanghai, China) with a 12 channels phased-array body coil. The PET tracer is 18F‑FDG, prepared by the undergraduate laboratory, with radiochemical purity >95%. The patient was fast for at least 6 hours, and fasting blood glucose less than 8mmol/L in the morning, and rest for 5-10 minutes before injection, and then was intravenous injectedion according to the standard dose of 0.15 mCi/kg,The images were acquired 40-60 minutes of quiet rest after injection. The MRI stretch index diffusion sequence was set with the following parameters: TR= 1620 ms, TE= 69.6 ms; b-values = 0, 25, 50, 100, 150, 200, 400, 600, 800, and 1000 s/mm2, number of averages =1, 1, 2, 2, 4, 4, 6, 6, 8, 10. The selection of ROI should try to include all solid areas and not exceed the scope of the lesion, avoiding necrotic tissue, blood vessels, air-containing cavities, and other structures. SUVmax and MTV measurement are measured by VOI analysis of pet-images, TLG is obtained by multiplying SUVmean and MTV. Statistical analysis was performed using SPSS 25.0 and Medcalc19.5.6. The Mann-Whitney U test was applied for between-group analyses, Pearson correlation coefficient was used to analyze the correlation, ROC curve was used to evaluate the diagnostic efficacy of each parameter, Medcalc software was drawn, and the AUCs of different parameters were compared with the Delong test. p<0.05 was considered statistically significant.Results
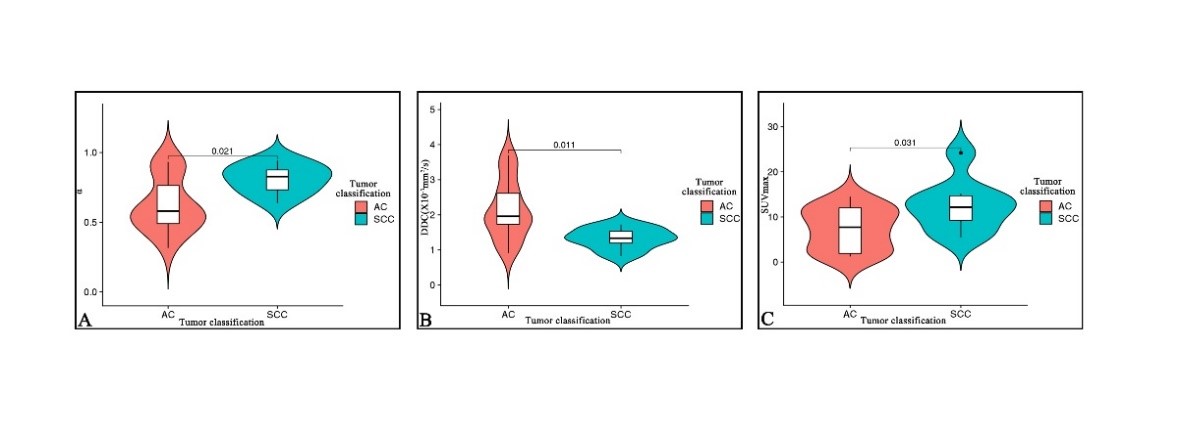
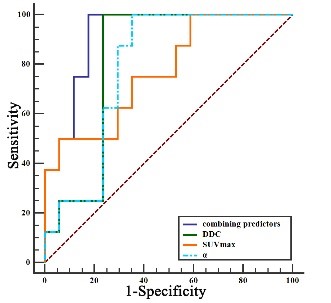
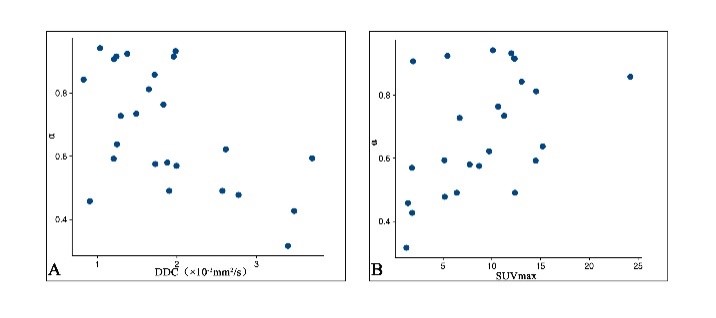
There are significant differences in the values of α (P=0.021), DDC (P=0.011), and SUVmax (P=0.031) between SCC and AC groups (Figure 1, 2), While MTV and TLG are not statistically significant. The α value and SUVmax value of the SCC group (0.81±0.10, 12.56±5.85) are greater than those of the AC group (0.64±0.19, 7.36±4.61), while the DDC value of the SCC group (1.33±0.30) is smaller than that of the AC group (2.14±0.83). The AUC values of the combined predictor, DDC, α, and SUVmax were 0.919, 0.816, 0.787, and 0.772, respectively, but there was no statistically significant difference between them (Figure 3). In NSCLC, Pearson correlation analysis shows that α is moderately negatively correlated with DDC (r=-0.536) and SUVmax is moderately positively correlated (r=0.517), and SUVmax is weakly negatively correlated with DDC (r=-0.335) (Figure 4). Discussion: This study found that the α value and DDC value are different in AC and SCC. Due to the difference in microvessel density and cell density among lung cancer tissues of different pathological subtypes, the diffusion of water molecules is uneven [4]. The cells in SCC are tightly distributed, the cell density is larger and even than that of AC and because there is no glandular structure, the diffusion of water molecules in the tumor tissue is more restricted, and the diffusion rate is reduced. In contrast, the distribution of cells in AC is relatively scattered, the cell density is low, and there are more glandular tube-like structures with more interstitial components, so the water molecules in adenocarcinoma are relatively free to diffuse and less restricted [5]Conclusion
The result research shows that PET/-MRI-based stretch index and SUVmax can distinguish SCC and AC, and the combination of the two has higher diagnostic efficiency. In addition, SUVmax is negatively correlated with α.Acknowledgements
The National Key R&D Program of China (2017YFE0103600), the Henan Medical Science and Technology Research Program (2018020357 and 2018020367), the National Natural Science Foundation of China (81720108021 and 31470047), and Zhongyuan Thousand Talents Plan Project - Basic Research Leader Talent (ZYQR201810117).References
1.Bray F, Ferlay J, Soerjomataram I, Siegel RL, Torre LA, Jemal A. Global cancer statistics 2018: GLOBOCAN estimates of incidence and mortality worldwide for 36 cancers in 185 countries. CA Cancer J Clin. 2018;68(6):394-424.
2.Morsing Anni, Hildebrandt Malene Grubbe, Vilstrup Mie Holm et al. Hybrid PET/MRI in major cancers: a scoping review.[J].Eur. J. Nucl. Med. Mol. Imaging, 2019, 46: 2138-2151.
3.Winfield JM, Orton MR, Collins DJ, et al. Separation of type and grade in cervical tumors using non-mono-exponential models of diffusion-weighted MRI. Eur Radiol. 2017;27(2):627-636.
4.Lee SH, Rimmer A, Gelb E, et al. Correlation Between Tumor Metabolism and Semiquantitative Perfusion Magnetic Resonance Imaging Metrics in Non-Small Cell Lung Cancer. Int J Radiat Oncol Biol Phys. 2018;102(4):718-726.
5.Zhang J, Chen L, Chen Y, et al. Tumor vascularity and glucose metabolism correlated in adenocarcinoma, but not in squamous cell carcinoma of the lung. PLoS One. 2014;9(3):e91649.
Figures