3205
Computed DWIs with different b values vs. Actual DWI vs. FDG-PET/CT: Capability for N-Stage Assessment in NSCLC Patients.1Radiology, Fujita Health University School of Medicine, Toyoake, Japan, 2Joint Research Laboratory of Advanced Medical Imaging, Fujita Health University School of Medicine, Toyoake, Japan, 3Division of Functional and Diagnostic Imaging Research, Department of Radiology, Kobe University Graduate School of Medicine, Kobe, Japan, 4Canon Medical Systems Corporation, Otawara, Japan, 5Diagnostic Radiology, Hyogo Cancer Center, Akashi, Japan
Synopsis
No major papers that directly compared the capability for N-stage evaluation among cDWIs with different b values, aDWI and FDG-PET/CT in NSCLC patients. We hypothesize that cDWI has a potential for improving diagnostic performance of N-stage in NSCLC patients as compared with aDWI as well as FDG-PET/CT, when set appropriate b value. The purpose of this study is to directly compare the capability for N-stage evaluation among cDWI with different b values, aDWI and FDG-PET/CT in NSCLC patients.
Introduction
Accurate TNM staging in non-small cell lung cancer (NSCLC) is fundamental clinical question from clinicians to determine appropriate therapeutic strategy. Since 1990s, positron emission tomography (PET) or PET fused with CT (PET/CT) combined with [18F] fluoro-2-D-glucose (FDG) has been applied to answer this question, although the diagnostic accuracy of PET or PET/CT is recently suggested as having some limitations. Since 2000s, magnetic resonance imaging (MRI) has also been suggested as another promising modality in this setting by means of short TI inversion recovery (STIR) turbo spin-echo (SE) imaging as well as diffusion-weighted imaging (DWI) (1-3). In addition, DWI has been widely applied for N-stage assessment in non-small cell lung cancer (NSCLC) patients (2-4). However, image quality of DWI at 3T MR system is relatively lower than that at 1.5T MR system (3). Recently, computed DWI (cDWI) generated from actually obtained DWI (aDWI) at two different b values has been reported as useful for improving image quality and improving diagnostic performance in prostatic cancer (5). However, there are no major papers that directly compared the capability for N-stage evaluation among cDWIs with different b values, aDWI and FDG-PET/CT in NSCLC patients. We hypothesize that cDWI has a potential for improving diagnostic performance of N-stage in NSCLC patients as compared with aDWI as well as FDG-PET/CT, when set appropriate b value. The purpose of this study is to directly compare the capability for N-stage evaluation among cDWIs with different b values, aDWI and FDG-PET/CT in NSCLC patients.Materials and Methods
245 consecutive operable NSCLC patients (127 men, 118 women; mean age 75 years) prospectively underwent actual DWI (aDWI) on a 3T system (Vantage Titan 3T, Canon Medical Systems Corporation, Otawara, Japan) with b value at 0 and 1000 s/mm2, FDG-PET/CT, surgical treatment and pathological and follow-up examinations. In each subject, computed DWIs were generated at 400 (cDWI400), 600 (cDWI600) and 800 (cDWI800) s/mm2. According to pathological examination results, 114 metastatic nodes and 114 out of 2581 non-metastatic nodes were measured contrast ratio (CR) on each computed DWI between each lymph node and chest wall muscle, ADC on aDWI and SUVmax by ROI measurements. To compare differentiation capability on a per node basis, ROC analysis was performed. Then, diagnostic performance was compared among all methods by McNemar’s test. On a per patient basis, agreement of N-stage classification between each index and pathological examination result was evaluated by kappa statistics. Finally, accuracy of N-stage classification was also compared among all methods by McNemar’s test.Results
Representative case is shown in Figure 1. All CR, ADC and SUVmax had significant differences between metastatic and non-metastatic lymph nodes (p<0.05). Figure 2 shows the results of ROC analysis for differentiating metastatic from non-metastatic lymph nodes. Area under the curve (AUC) of CR600 (AUC=0.86) was significantly larger than that of SUVmax (AUC=0.77, p=0.003), CR400 (AUC=0.79, p<0.0001) and CR800 (AUC=0.81, p<0.0001). AUC of CR800 was also significantly larger than that of CR400 (p=0.02). Figure 3 shows the results of compared differentiation capability for metastatic from non-metastatic lymph nodes on a per node basis. Sensitivity of each CR was significantly higher than that of SUVmax (p<0.05). Specificity of SUVmax was significantly higher than that of CR400 and CR800 (p<0.05). Accuracy of CR600 was significantly higher than that of other CRs, ADC and SUVmax (p<0.05). Figure 4 demonstrates agreement of N-stage between evaluated and final N-stage and compared diagnostic accuracy for N-stage on a per patient basis. Agreement with final diagnosis by each index was significant and substantial (0.71<κ<0.79, p<0.0001). Accuracy of CR600 was significantly higher than that of CR400 and CR800 (p<0.05).Conclusion
cDWI is considered as the new promising method for improving diagnostic performance of lymph node metastasis and N-stage evaluation, when compared with aDWI and FDG-PET/CT in NSCLC patients. In addition, b value at 600s/mm2 would be better to be applied for generating cDWI rather than other b values in this setting.Acknowledgements
This study is technically and financially supported by Canon Medical Systems Corporation.References
- Ohno Y, Hatabu H, Takenaka D, et al. Metastases in mediastinal and hilar lymph nodes in patients with non-small cell lung cancer: quantitative and qualitative assessment with STIR turbo spin-echo MR imaging. Radiology. 2004 ; 231(3): 872-879.
- Ohno Y, Koyama H, Yoshikawa T, et al. N stage disease in patients with non-small cell lung cancer: efficacy of quantitative and qualitative assessment with STIR turbo spin-echo imaging, diffusion-weighted MR imaging, and fluorodeoxyglucose PET/CT. Radiology. 2011 ; 261(2): 605-615.
- Ohno Y, Koyama H, Yoshikawa T, et al. Diffusion-weighted MR imaging using FASE sequence for 3T MR system: Preliminary comparison of capability for N-stage assessment by means of diffusion-weighted MR imaging using EPI sequence, STIR FASE imaging and FDG PET/CT for non-small cell lung cancer patients. Eur J Radiol. 2015 ; 84(11): 2321-2331.
- Peerlings J, Troost EG, Nelemans PJ, et al. The Diagnostic Value of MR Imaging in Determining the Lymph Node Status of Patients with Non-Small Cell Lung Cancer: A Meta-Analysis Radiology. 2016 ; 281(1): 86-98.
- Ueno Y, Takahashi S, Kitajima K, et al. Computed diffusion-weighted imaging using 3-T magnetic resonance imaging for prostate cancer diagnosis. Eur. Radiol., 2013;23:3509-3516.
Figures
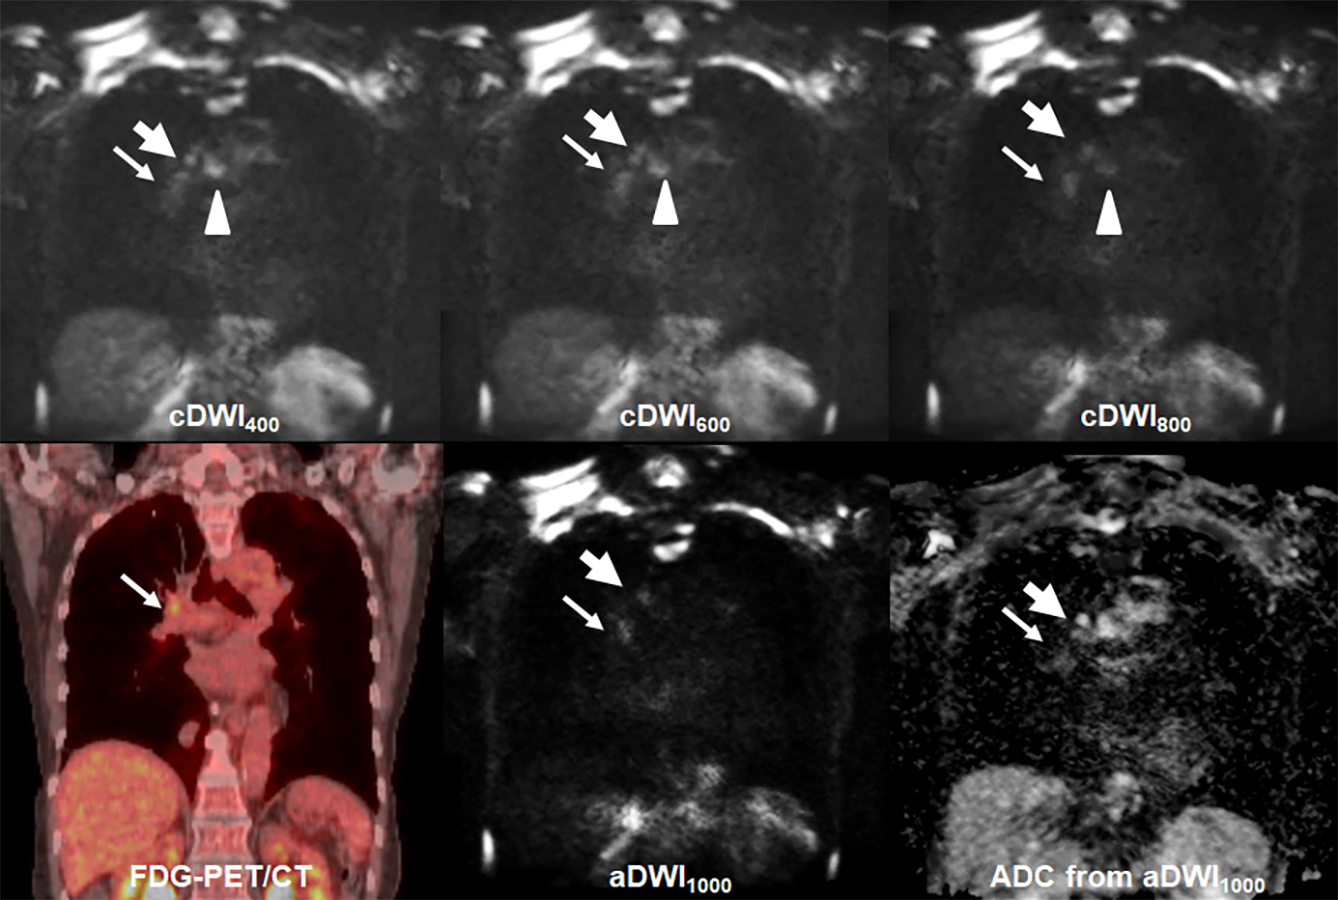
Figure 1. 72-year old invasive adenocarcinoma with N2 disease
cDWI at each b value demonstrates right hilar, right lower paratracheal, subcarina lymph node metastases (arrow, large arrow and arrow head). However, PET/CT shows only right hilar lymph node metastasis (arrow). On the other hand, aDWI and ADC demonstrate right hilar and right lower paratracheal lymph node metastases (arrow and large arrow). This case was assessed as N2 case on each cDWI and aDWI and considered as true-positive. However, this case was evaluated as N1 case on PET/CT and considered as false-negative case.
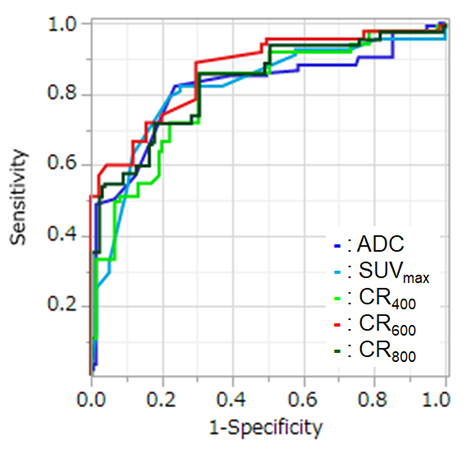
Figure 2. Result of ROC analysis for distinguishing metastatic from non-metastatic lymph nodes.
Area under the curve (AUC) of CR600 (AUC=0.87) was significantly larger than that of SUVmax (AUC=0.77, p=0.003), CR400 (AUC=0.79, p<0.0001) and CR800 (AUC=0.81, p<0.0001). In addition, AUC of CR800 was also significantly larger than that of CR400 (p=0.02).
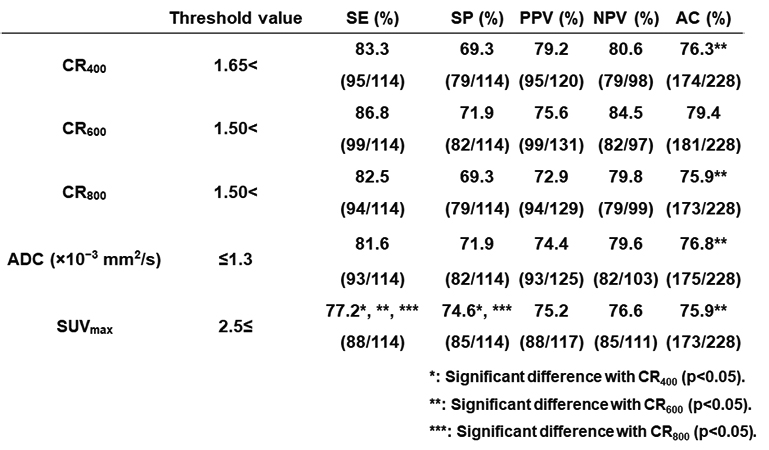
Figure 3. The results of compared differentiation capability for metastatic from non-metastatic lymph nodes.
Sensitivity of each CR was significantly higher than that of SUVmax (p<0.05). Specificity of SUVmax was significantly higher than that of CR400 and CR800 (p<0.05). Accuracy of CR600 was significantly higher than that of other CRs, ADC and SUVmax (p<0.05).
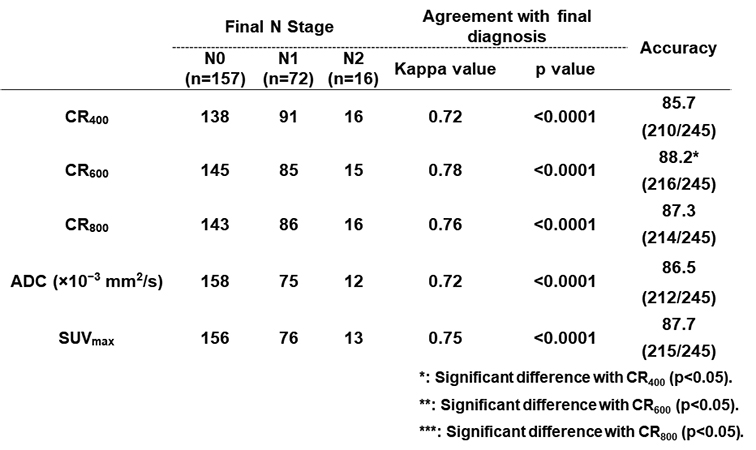
Figure 4. Agreement of N-stage between evaluated and final N-stage and diagnostic accuracy for N-stage on a per patient basis.
Agreement with final diagnosis by each index was significant and substantial (0.71<κ<0.79, p<0.0001). Accuracy of CR600 was significantly higher than that of CR400 and CR800 (p<0.05).