3203
Fetal magnetic resonance imaging of normal lumbar spine development in vivo1Radiology, the Third Affiliated Hospital of Zhengzhou University, Zhengzhou, China, 2Ultrasound, the Third Affiliated Hospital of Zhengzhou University, Zhengzhou, China, 3Obstetrics and Gynecology, the Third Affiliated Hospital of Zhengzhou University, Zhengzhou, China
Synopsis
In the last few years, fetal magnetic resonance (MR) has been more and more used in the obstetrics and gynecology. We measure the height and length of each lumbar vertebra body ossification center and the height of each intervertebral gap, and our results show a good linear correlation between normal lumbar vertebra body ossification center development and gestational age in vivo
Introduction
In the last few years, fetal magnetic resonance (MR) has been more and more used in the obstetrics and gynecology. We measure the height and length of each lumbar vertebra body ossification center and the height of each intervertebral gap, and our results show a good linear correlation between normal lumbar vertebra body ossification Fetal MR could be helpful for the diagnosis and treatment because of more detailed information obtained by the MR. Before evaluating the fetal spine, it is important to understand the development of fetal spine at different GAs. We find few of published dates on the normal appearances of vertebrae and intervertebral space, and most of them were posthumous. The aim of this study is to describe the normal MR imaging appearances of the fetal lumbar spine in vivo at different GAs.center development and gestational age (GA) in vivo.Material and Methods
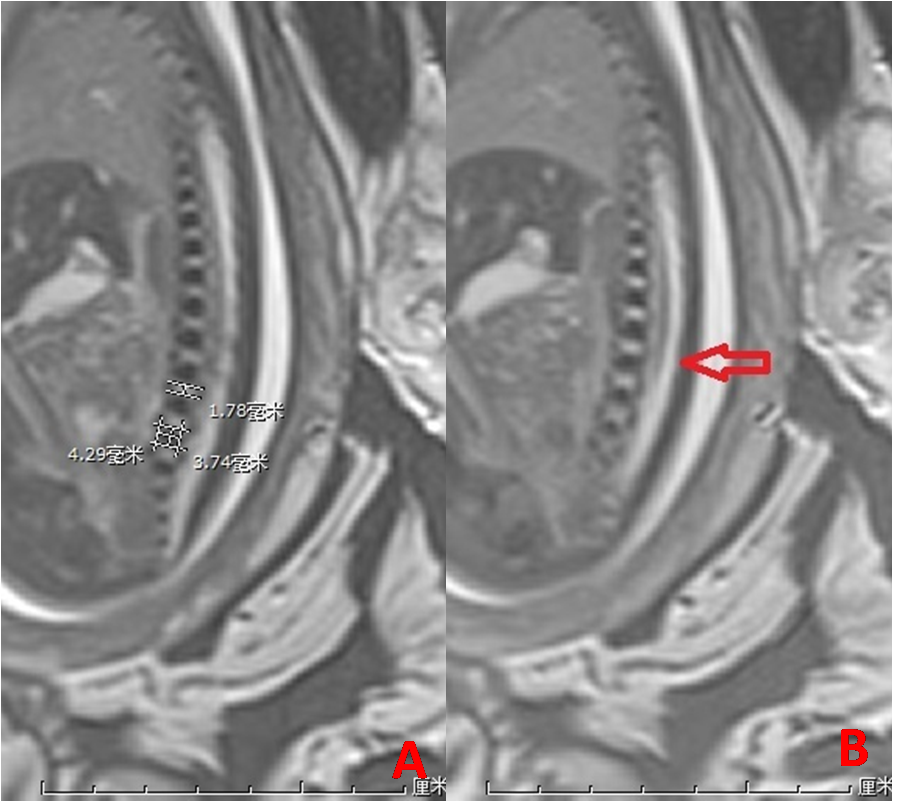
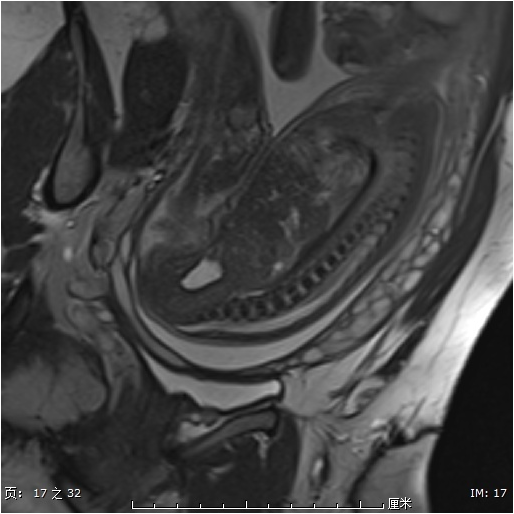
This retrospective study was approved in the Third Affiliated Hospital of Zhengzhou University. Between September 2017 and October 2020, 93 fetuses, from 22 to 37 gestational weeks (mean, 27.1 gestational weeks), were imaged in our hospital. The GA was estimated by the combination of the woman’s last menstrual period and the assessments made by sonography around 20 weeks, sometimes, by the pregnant woman’s referring obstetrician. None of the fetal spines had positive findings. All the MR images were obtained by 3.0T MR (Skyra, Siemens Medical Systems, Germany) with an eight-channel body surface coil. Three-plane imaging of T2WI of fetal spines was acquired. All had the mid-sagittal plane of steady state free precession sequence (Trufi, Siemens, repetition time/echo time =740/2.4ms; field of view, 35X45cm; thickness, 3mm; -0.6mm gap; voxel size, 1.1X1.1X3.0mm; FA, 58°; NEX, 1) of the lumbar spine which could show the lumbar vertebra and conus medullaris (CM). All the MR images were transferred to PACS (Synapse, Fujifilm medical system, Japan). All the measurements were carried on the mid-sagittal plane of Trufi (Figure 1). The location of CM was determined by the mid-sagittal and axial planes. SPSS 20.0 was used for the data analysis. Simple linear regression analysis was made between GA and heights of lumbar vertebra body ossification center (LVBOC), lengths of LVBOC, heights of intervertebral gap (IVP).Results
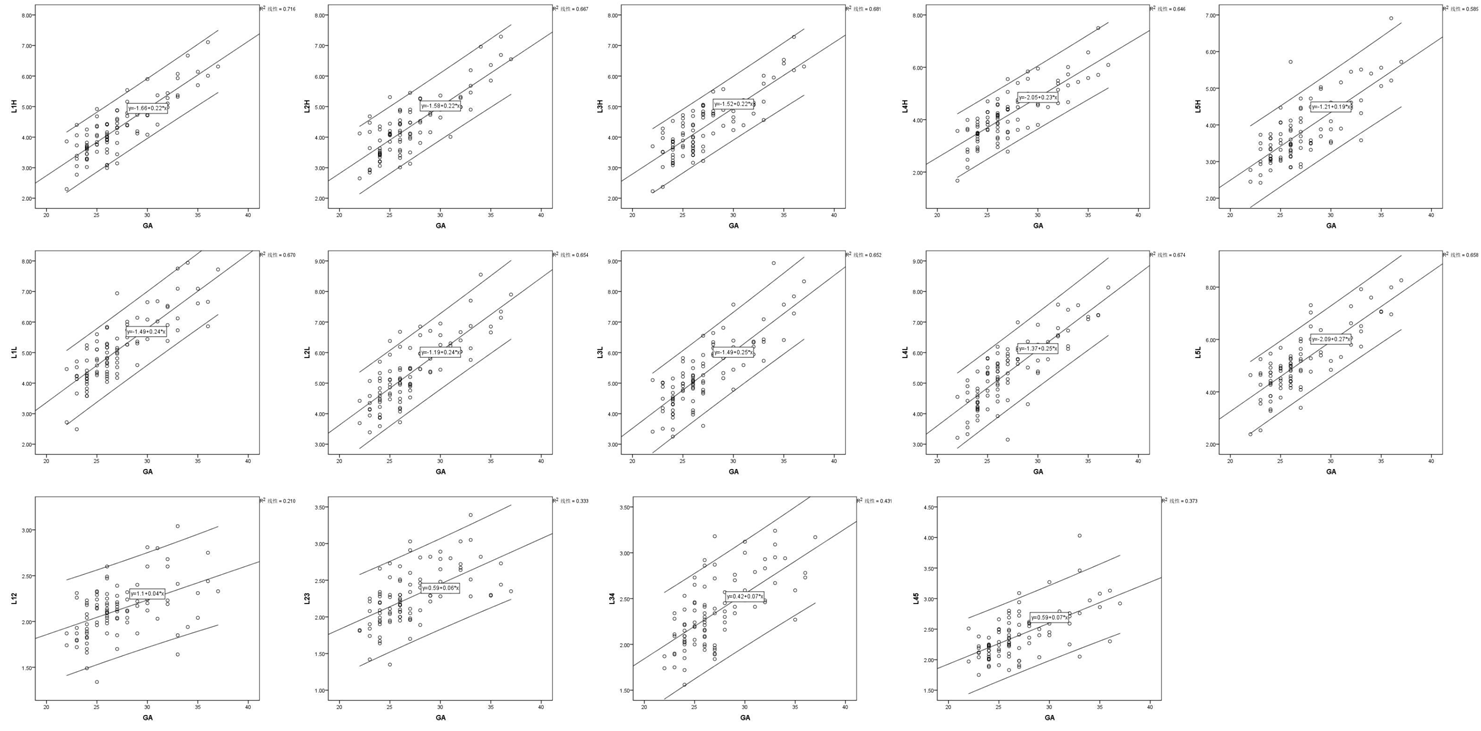
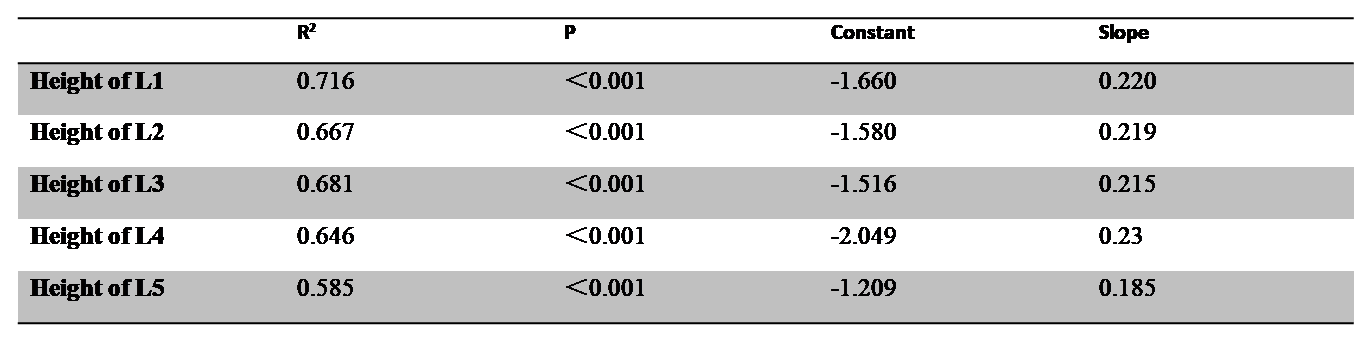
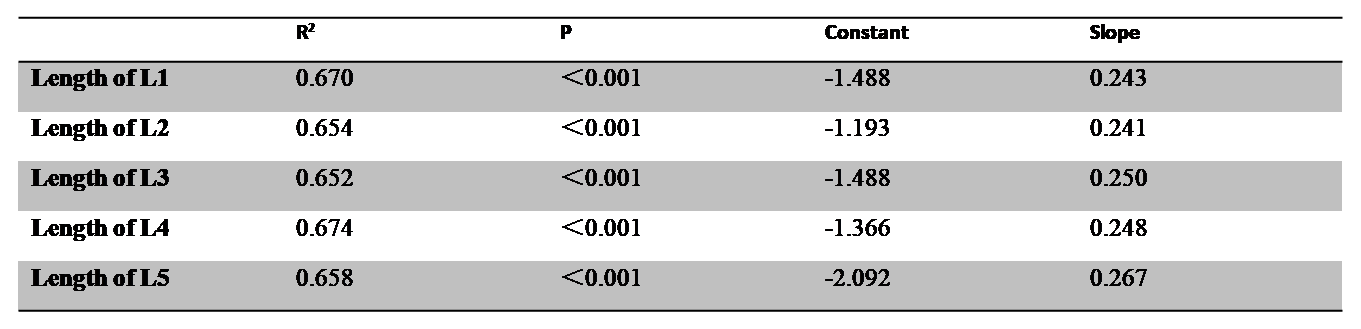
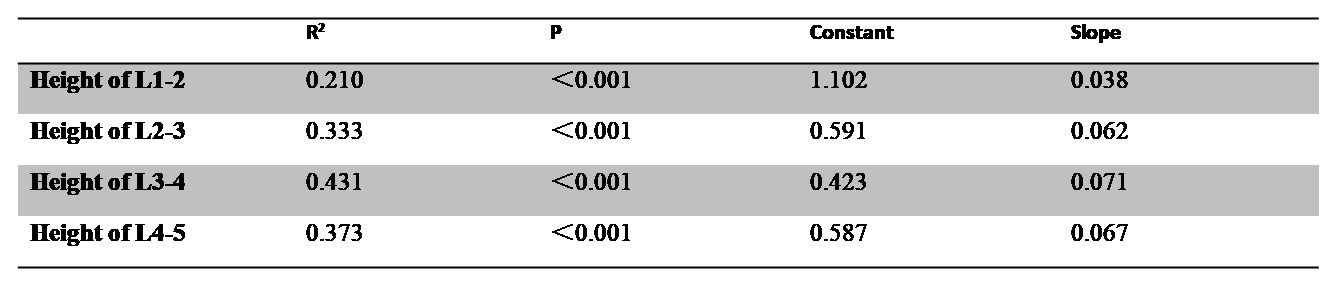
There are good linear correlations between the heights of LVBOC and GA (P<0.001), lengths of LVBOC and GA (P<0.001), heights of IVP and GA (P<0.001) (Figure 3). The results of correlation are shown in the Table 1-3. Scatter plots are shown in Figure 4-6. The LVBOCs may show linear T2 hyperintensity in the mid-sagittal plane (14/465 vertebra) (Figure 2). The positions of conus level lies from L1 to L3. There are 19 cases with the CM at the L1 level, 29 cases at the L1-2 level, 38 cases at L2 level, 6 cases at L2-3 level and 1 case at L3 level.Discussion
The development of vertebra includes 3 periods, membranous development, chondrification and ossification[1]. The ossification of vertebra begins from thoraco-lumbar junction[1,2]. At present, fetal MR is imaged after 18 gestational weeks, and at this time, all the lumbar ossification centers could be seen[1, 3]. In this study, we find the linear relationship between the heights of LVBOC and GA, lengths of LVBOC and GA, heights of IVP and GA. Very interesting, the slopes of heights of L1 to L4 with GA are very closely, and the slope of L5 is less than 0.2, but the slopes of lengths of every LVBOC are very closely. It’s uncertain about the course of the linear T2 hyperintensity in LVBOC since the autopsy is impossible, and microscopic rests of notochordal cells within the vertebral body may be one of the possible explanations. The locations of CM are beyond L3 level[4, 5].Conclusion
We demonstrate a good linear relationship between the development of normal lumbar spine and gestational age in vivo by MR.Acknowledgements
Henan Province Medical Science and Technology Research Project (grants LHGJ20190382)References
[1] DIAS M S. Normal and Abnormal Development of the Spine[J]. Neurosurgery Clinics of North America, 2007,18(3): 415-429.
[2] JIAN N, LIN N, TIAN M, et al. Normal development of costal element ossification centers of sacral vertebrae in the fetal spine: a postmortem magnetic resonance imaging study[J]. Neuroradiology, 2019,61(2): 183-193.
[3] PRAYER D, MALINGER G, BRUGGER P C, et al. ISUOG Practice Guidelines: performance of fetal magnetic resonance imaging[J]. Ultrasound Obstet Gynecol, 2017,49(5): 671-680.
[4] DUCZKOWSKA A, BEKIESINSKA-FIGATOWSKA M, HERMAN-SUCHARSKA I, et al. Magnetic resonance imaging in the evaluation of the fetal spinal canal contents[J]. Brain and Development, 2011,33(1): 10-20.
[5] ZEITOUN D, EL H F, SARIALI E, et al. Evaluation of spinal cord compression and hyperintense intramedullary lesions on T2-weighted sequences in patients with cervical spondylotic myelopathy using flexion-extension MRI protocol[J]. Spine J, 2015,15(4): 668-674.
Figures