3202
Evaluation of lumbar facet joint and intervertebral disc degeneration using histogram analysis of T2 and T2*values1Tongji Hospital, Tongji Medical College, Huazhong University of Science and Technology, Wuhan, China, 2MR Research,GE Healthcare, Beijing, China
Synopsis
Lumbar intervertebral disc (IVD) and lumbar facet joint (LFJ) are the primary and important load-bearing structures in spine. Any abnormality of the anterior IVD and the two posterior LFJs may lead to spinal instability and low back pain (LBP). The current study demonstrates that LFJ degeneration occurs earlier and progresses more slowly than IVD degeneration. Histogram analysis of T2 and T2* values is feasible for detecting and grading IVD but not LFJ degeneration.
main text
IntroductionLow back pain (LBP) is a serious health problem among adolescents and especially in middle-aged and elderly populations, leading to a major economic burden on health care systems worldwide [1]. Lumbar intervertebral disc (IVD) degeneration is recognized as the leading cause of LBP, while lumbar facet joint (LFJ) degeneration is another source of pain accounting for 15–45% of LBP [2]. Histogram analysis is a popular approach for obtaining quantitative measurements and characterizing microstructural heterogeneity. At present, only few articles have explored the feasibility of MRI histogram analysis in disc degeneration, and no studies have been performed to evaluate LFJ degeneration using histogram analysis. Therefore, the aim of this study was to examine the feasibility of T2 and T2* value histogram analysis for detection of IVD and LFJ degeneration and to explore the correlation between IVD and LFJ degeneration.
Methods
This study was approved by the institutional review board of our hospital. 203 lumbar IVDs and 406 LFJs of 42 subjects with chronic LBP were examined using both morphological MRI (sagittal and axial T2WI) and quantitative MRI (axial T2 and T2* mapping) on a 3T MRI system (GE Discovery MR 750, GE Healthcare, Waukesha, WI, USA). All IVDs and LFJs were, respectively, visually graded according to the Pfirrmann grading [3] and the Weishaupt grading system [4]. Pfirrmann grades I and II were defined as “normal” and grades III to V as “abnormal”. Similarly, Weishaupt grades 0 and 1 were defined as “normal” and grades 2 to 3 as “abnormal”. The degeneration incidence (DI) in each age group was calculated as: DI=Abnormal / (Abnormal+Normal). Histograms were generated with FireVoxel software (Department of Radiology, New York University, USA). Chi-square tests were used to compare the DI differences in different age groups, the DI differences between the IVDs and LFJs in the same age groups. Receiver operating characteristic (ROC) curves analysis was used to determine the sensitivity and specificity of all histogram parameters(mean, median, 10th, 25th, 75th and 90th percentile, inhomogeneity, entropy, skewness, kurtosis)for identifying normal and abnormal IVDs/LFJs.
Results
The agreement for Pfirrmann grade of IVDs between the two radiologists was good (κ=0.732,p<0.001). 106 discs (52.2%) were graded as normal (29 as Pfirrmann I and 77 as II) and 97 (47.8%) as abnormal (60 as Pfirrmann III and 37 as IV). The agreement for Weishaupt grading of LFJs was poor (κ=0.309,p<0.001). 231 (56.9%) LFJs were graded as normal (25 as grade 0 and 206 as grade 1) and 165 (43.1%) as abnormal (147 as grade 2 and 28 as grade 3).
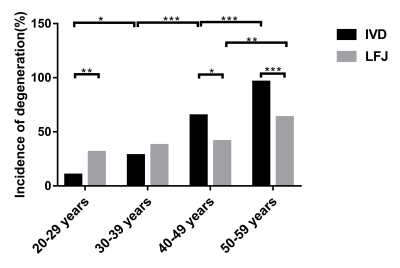
All subjects were divided into four groups based on age with 12 subjects in the 20-29 years group, 11 in the 30-39 years group, 9 in the 40-49 years group, and 10 in the 50-59 years group. The DI of both IVDs and LFJs increased with age, the DI of IVDs for 4 successive age groups was 10.34%, 28.30%, 65.00% and 96.15%; the DI of LFJs was 31.03%, 37.74%, 41.25% and 63.46%, successively (Fig.1). For IVDs, significant differences were found between adjacent age groups (c2=5.822, p=0.016; c2=12.554, p<0.001; c2=15.274, p<0.001, successively). For LFJs, significant difference was only found between 40-49 year and 50-59 year age groups (c2=8.975, p=0.003). The DI of LFJ was higher than for the IVD in both 20-29 years and 30-39 years groups, but the difference was only statistically significantly in the 20-29 years group (c2=9.039, p=0.003). In the 40-49 and 50-59 years groups, the DI of LFJ was statistically significantly lower than that of IVD (c2=6.018, p=0.014; c2=19.433, p<0.001).
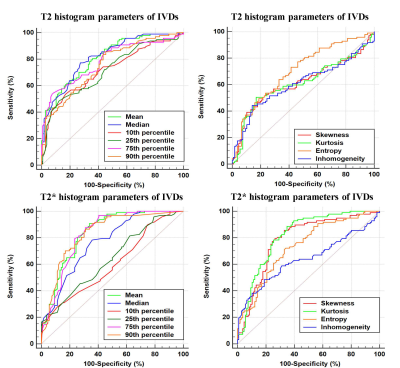
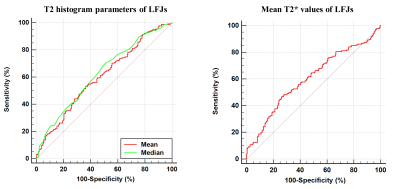
For T2 histogram parameters, mean, median, 10th, 25th, 75th, 90th percentiles, and entropy generated the higher AUC (AUC = 0.810, 0.815, 0.717, 0.715, 0.784, 0.754, 0.703, respectively) than kurtosis, and skewness (AUC = 0.613, 0.612, respectively) for differentiating normal and abnormal discs. For T2* histogram parameters, mean, median, 75th, 90th percentiles, skewness, kurtosis and entropy generated the higher AUC (AUC = 0.836, 0.765, 0.829, 0.832, 0.787, 0.817, 0.736, respectively) than 10th and 25th percentiles (AUC = 0.601, 0.639, respectively) for differentiating normal and abnormal discs (Fig. 2). Fig. 3 show that only the mean T2 and T2* values and the median of T2 values were reliable for identifying normal (Weishaupt grades 0 and 1) and abnormal (grades 2 and 3) LFJs with AUC (AUC = 0.601, 0.604, 0.626, respectively). Other histogram parameters could not differentiate between normal and abnormal LFJs (p>0.05).
Discussion and conclusions
The data presented in this study demonstrates that LFJ DI was higher than IVD at younger ages (20-39 years), but the percentage of IVD degeneration in older age groups (40-59 years) was overwhelmingly greater. These results provide the evidence that LFJ degeneration occurs earlier than IVD degeneration, challenging the commonly accepted paradigm of the degenerative process beginning at the IVDs. The current study found that all T2 and T2* histogram parameters were capable of distinguishing discs with no or mild degeneration from abnormal discs with severe degeneration and the diagnostic performance of histogram analysis on LFJ degeneration was not good enough.
Acknowledgements
Funding: This work was supported by projects of the National Natural Science Foundation of China (NSFC) (No. 31630025 and 81930045)References
1.A.Y. Wong, J. Karppinen, D. Samartzis, Low back pain in older adults: risk factors, management options and future directions, Scoliosis and spinal disorders 12 (2017) 14.
2. R. Perolat, A. Kastler, B. Nicot, J.M. Pellat, F. Tahon, A. Attye, O. Heck, K. Boubagra, S. Grand, A. Krainik, Facet joint syndrome: from diagnosis to interventional management, Insights Imaging 9(5) (2018) 773-789.
3. C.W. Pfirrmann, A. Metzdorf, M. Zanetti, J. Hodler, N. Boos, Magnetic resonance classification of lumbar intervertebral disc degeneration, Spine 26(17) (2001) 1873-8.
4. D. Weishaupt, M. Zanetti, N. Boos, J. Hodler, MR imaging and CT in osteoarthritis of the lumbar facet joints, Skeletal Radiol 28(4) (1999) 215-9.
Figures


