3199
Histogram analysis of IDEAL-IQ and UTE images better assists to detect abnormalities of the lumbar vertebral bone marrow in patients with different stages of chronic kidney disease1Wuhan Tongji Hospital, Wuhan, China, 2MR Research, GE Healthcare, Beijing, China
Synopsis
Mineral bone disease (MBD) has an extremely high incidence in patients with chronic kidney disease (CKD) and significantly affects the prognosis and quality of life of patients. However, the current diagnostic methods are difficult to determine the type and severity of CKD-MBD. In our study, histogram analysis of IDEAL-IQ showed kurtosis and R2* could distinguish bone marrow changes in patients with CKD at different stages in indication of altered skeletal health and bi-component analysis of UTE images demonstrated short T2* value possibly in reflection of trabecular bone was highly correlated with blood biochemical indicators.
Chronic kidney disease (CKD) has been recognized as a leading public health problem worldwide. The global estimated prevalence of CKD is 13.4% (11.7–15.1%), and patients with end-stage kidney disease is estimated between 4.902 and 7.083 million. [1] Fractures in patients with end-stage kidney disease results in significant excess mortality, worse quality of life, and social burden. [2-4] MBD is a common complication in patients with CKD. [2] CKD-MBD may lead to mineralization, altered bone morphology, and/or bone turnover. Despite various technologies such as clinical diagnosis guidance, laboratory biochemical exams, and imaging modalities help us understand bone diseases in CKD, most results show controversial and cause undermanagement of bone fragility. [5, 6] The gold standard diagnosis of renal osteodystrophy is bone biopsy, but it is very traumatic and not easy to implement. This study aims to explore the feasibility of histogram analysis of Iterative Decomposition of water and fat with Echo Asymmetry and Least-squares estimation-Intelligence Quotient (IDEAL-IQ) sequence and bi-component analysis of Ultrashort echo time (UTE) imaging [7] to detect bone marrow changes of different CKD stages and seek a non-invasive and sensitive method in contribution to accurate early diagnosis of CKD-MBD.
Materials and Methods
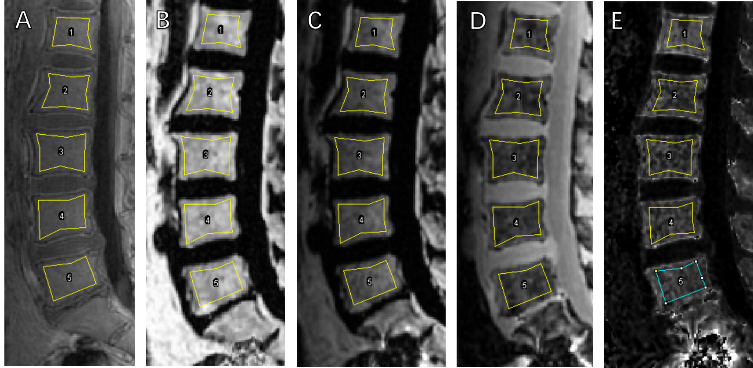
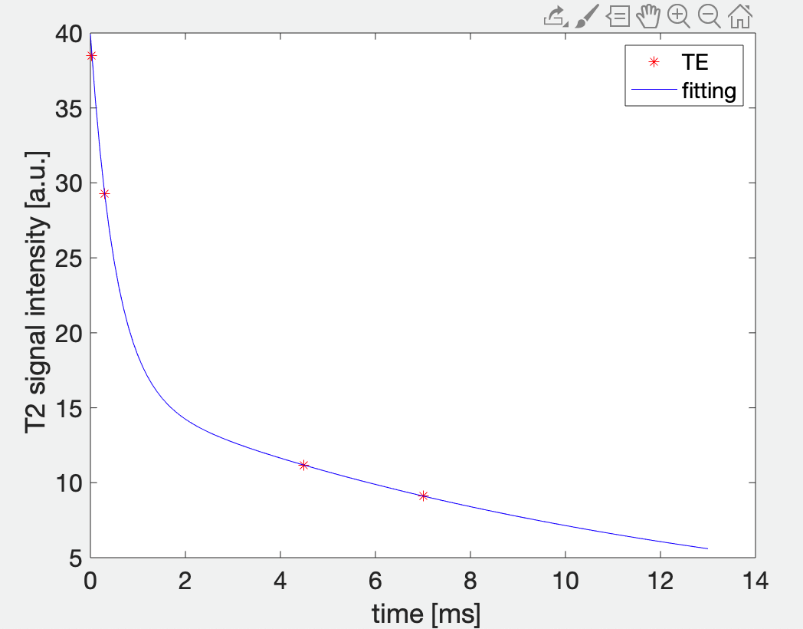
This study was approved by the Institutional Review Board of our hospital and all recruited subjects gave the informed consent. 19 patients aged 18-70 years who had been diagnosed with CKD but have not received dialysis were included in the study and were divided into two groups, respectively, with eGFR at the range of 30-90 ml/min/1.73m2 and eGFR lower than 15 ml/min/1.73m2 without dialysis. Patients with any disease known to affect bone or receive medication that may affect bone density were excluded. All blood biochemical indexes (blood routine, renal function, serum electrolyte, β-CTX [β-crosslaps], osteocalcin [OC], and, PTH [parathyroid hormone]) were obtained within one week before the MRI examination. All patients underwent sagittal lumbar IDEAL-IQ, UTE with four echoes and T2WI scans on a 3.0 T scanner (Signa Pioneer, GE Healthcare) with both abdomen and spine bed coils. ROIs of L1-L5 vertebra were drawn in the mid-sagittal and the two parasagittal positions on UTE which shows the clearest cortical boundary, avoiding the cortical bone, obvious osteosclerosis zone and small arteries behind the vertebral body. And then copied ROI to Fat fraction, R2*, water and fat (Figure 1). Histogram analysis of IDEAL-IQ and bi-component analysis of UTE was used to obtain T2* value (Figure 2). Statistical analyses within and between groups were carried out using IBM SPSS Statistics 26 (Armonk, NY, USA).
Results
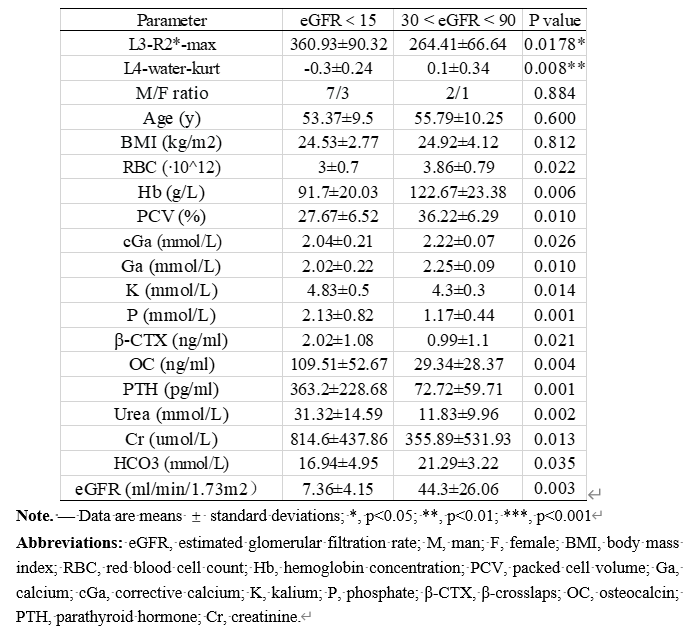
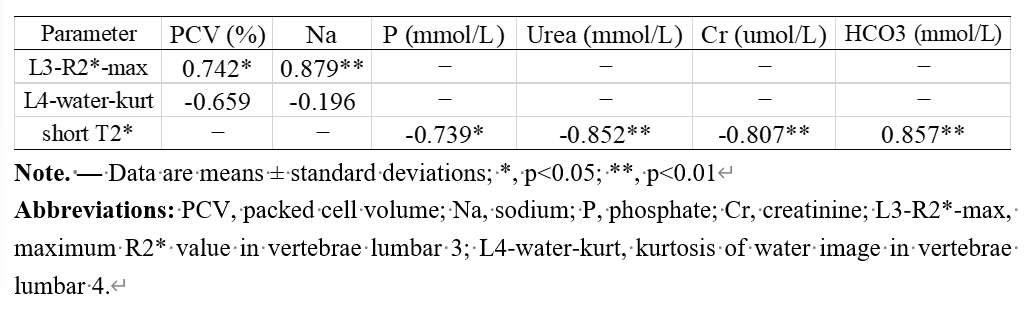
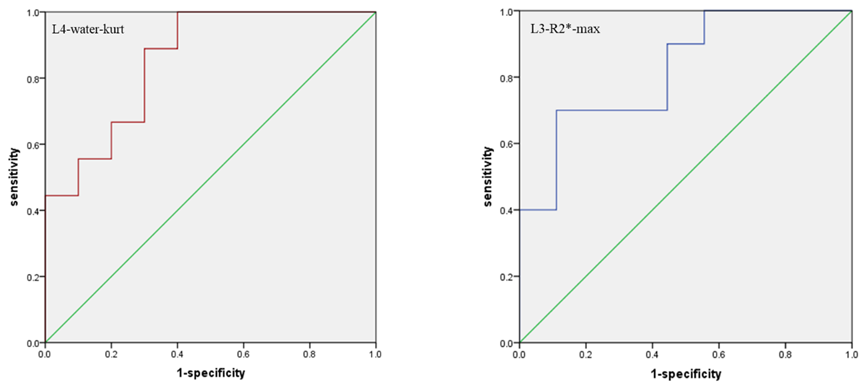
A total of 19 patients with matched gender, age and body mass index (BMI) were recruited in the study (Table 1). Blood biochemical indexes in Table 1 showed significant differences between patients with different range of eGFR. One histogram-based IDEAL-IQ and R2* value showed significant differences between patients with different range of eGFR (Table 1). The area under the curve (AUC) of L4-water-kurt and L3-R2*-max were 0.856 (P = 0.009) and 0.822 (P = 0.018), respectively. (Figure 3) Pearson correlation coefficient between L3-R2*-max and Na as well as PCV (%) and between short T2*and phosphorus as well as Urea, Cr and HCO3- were shown in Table 2.
Discussion and conclusions
RBC, Hb, PCV are indicators of anemia. As CKD progresses, anemia becomes more severe.[8] β-CTX, OC and PTH are indicators of bone metabolism. With the progression of renal failure, the subsequent abnormal secretion of PTH leads to the deterioration of trabecular bone microstructure, the thinning of cortical bone and the increase of cortical porosity.[9-11] The kurtosis of water image in L4 and maximum of R2* value in L3 showed significant differences between groups and had high discrimination ability of different CKD stages (stage 2 and 3 vs. stage 5) with AUC equal to 0.856 and 0.822, respectively. Kurtosis as the maximum height of histogram distribution is an excellent indicator of organizational heterogeneity.[12] In CKD patients, renal anemia leads to opposite transformation of red bone marrow turning into yellow bone marrow and subsequently increases bone marrow heterogeneity. Consistent with the previous study,[8, 13] our results showed that the heterogeneity of the water distribution in the bone marrow became more significant as CKD progressed. In addition, the positive correlation of maximum R2* value in L3 and PCV and Na was found in our study. With the progression of CKD, the microstructure of bone trabecula is getting deteriorated and may be substituted by adipose tissue. [14] There is a higher correlation of increased bone marrow fat and the decrease bone density and T2* can reflect changes in bone marrow composition [15, 16]. Therefore, our finding of R2* showed the bone marrow changes in our patients with anemia. The histogram analysis of two structural and functional images acquired with an IDEAL-IQ and UTE sequences may be a potential tool to distinguish mild CKD stage from severe one, which should be verified with a larger sample size in future research.
Acknowledgements
No acknowledgement found.References
References: [1]. Lv, J.C. and L.X. Zhang, Prevalence and Disease Burden of Chronic Kidney Disease. Adv Exp Med Biol, 2019. 1165: p. 3-15.
[2]. Reiss, A.B., et al., CKD, arterial calcification, atherosclerosis and bone health: Inter-relationships and controversies. Atherosclerosis, 2018. 278: p. 49-59.
[3]. Pimentel, A., et al., Fractures in patients with CKD-diagnosis, treatment, and prevention: a review by members of the European Calcified Tissue Society and the European Renal Association of Nephrology Dialysis and Transplantation. Kidney Int, 2017. 92(6): p. 1343-1355.
[4]. Wagner, J., et al., Increased bone fractures among elderly United States hemodialysis patients. Nephrol Dial Transplant, 2014. 29(1): p. 146-51.
[5]. Sharma, A.K., et al., Emerging role of high-resolution imaging in the detection of renal osteodystrophy. Nephrology, 2016. 21(10): p. 801-811.
[6]. Ketteler, M., et al., Executive summary of the 2017 KDIGO Chronic Kidney Disease-Mineral and Bone Disorder (CKD-MBD) Guideline Update: what's changed and why it matters. Kidney Int, 2017. 92(1): p. 26-36.
[7]. Wurnig, M.C., et al., Characterization of trabecular bone density with ultra-short echo-time MRI at 1.5, 3.0 and 7.0 T - comparison with micro-computed tomography. NMR in Biomedicine, 2014. 27(10): p. 1159-1166.
[8]. Babitt, J.L. and H.Y. Lin, Mechanisms of anemia in CKD. J Am Soc Nephrol, 2012. 23(10): p. 1631-4.
[9]. Leonard, M.B., A structural approach to the assessment of fracture risk in children and adolescents with chronic kidney disease. Pediatr Nephrol, 2007. 22(11): p. 1815-24.
[10]. Evenepoel, P., et al., Bone-Vascular Axis in Chronic Kidney Disease. Advances in Chronic Kidney Disease, 2019. 26(6): p. 472-483.
[11]. Pimentel, A., et al., Fractures in patients with CKD-diagnosis, treatment, and prevention: a review by members of the European Calcified Tissue Society and the European Renal Association of Nephrology Dialysis and Transplantation. Kidney Int, 2017. 92(6): p. 1343-1355.
[12]. Baek, H.J., et al., Percent change of perfusion skewness and kurtosis: a potential imaging biomarker for early treatment response in patients with newly diagnosed glioblastomas. Radiology, 2012. 264(3): p. 834-43.
[13]. Gonzalez, F.M., et al., Knee MRI patterns of bone marrow reconversion and relationship to anemia. Acta Radiol, 2016. 57(8): p. 964-70.
[14]. Leonard, M.B., A Structural Approach to Skeletal Fragility in Chronic Kidney Disease. Seminars in Nephrology, 2009. 29(2): p. 133-143.
[15]. Kwack, K.S., et al., Comparison of proton density fat fraction, simultaneous R2*, and apparent diffusion coefficient for assessment of focal vertebral bone marrow lesions. Clin Radiol, 2020. 75(2): p. 123-130.
[16]. Li, G., et al., Comparison of chemical shift-encoded water-fat MRI and MR spectroscopy in quantification of marrow fat in postmenopausal females. J Magn Reson Imaging, 2017. 45(1): p. 66-73.
Figures