3198
Comparison of T2 relaxation time from synthetic MRI and conventional T2 mapping in the diagnosis of intervertebral disc degeneration
Xiaoqing Liang1, Weiyin Vivian Liu2, Yitong Li1, and Xiaoming Li3
1Radiology, Tongji Hospital, Tongji Medical College, Huazhong University of Science and Technology, Wuhan, China, 2MR Research, GE Healthcare, Beijing, China, 31Radiology, Tongji Hospital, Tongji Medical College, Huazhong University of Science and Technology, Wuhan, China
1Radiology, Tongji Hospital, Tongji Medical College, Huazhong University of Science and Technology, Wuhan, China, 2MR Research, GE Healthcare, Beijing, China, 31Radiology, Tongji Hospital, Tongji Medical College, Huazhong University of Science and Technology, Wuhan, China
Synopsis
Synthetic MRI has become a recent research hotspot due to its advantages of short-time acquiring multiple sets of weighted images and quantitative maps in one time. Synthetic MRI has been successfully used for the diagnosis of many cerebral diseases, but its feasibility and stability in other tissues and lesions need to be further studied. The current study demonstrates that the utility of synthetic MRI is slightly better than conventional T2 mapping in diagnosing intervertebral disc degeneration. In addition, one-time MAGiC scan on lumbar vertebrae should be concerned for clinical diagnosis.
Introduction and purpose
Degeneration of lumbar intervertebral discs (IVDs) is recognized as the most common and important cause of low back pain (LBP). T2 mapping is considered to be an objective tool to quantify IVD degeneration1,2. However, the long scan time of conventional T2 mapping limits its clinical application. Synthetic MRI is a novel imaging method that can generate both multiple relaxation weighted images and quantitative relaxation maps in a short time. These advantages broaden the clinical practicality of T2 quantification in various diseases. Histogram analysis is a tool to display the frequency distribution of measured single-voxel T2 values in the region of interests (ROIs). The purpose of this study is to explore whether the T2 parameters derived from synthetic MRI and conventional T2 mapping are different in discs with different degeneration grades using histogram analysis.Materials and methods
This study was approved by the institutional review board of our hospital. 50 lumbar IVDs of 10 healthy volunteers (6 women and 4 men, mean age was 26.80±3.16 years, range 22-33 years) were examined using conventional T2 mapping and synthetic MRI (Magnetic Resonance Image Compilation, MAGiC) sequence on a 3.0T MRI (Signa Pioneer, GE Healthcare). All IVDs were visually graded according to the Pfirrmann grading3. All ROIs of the IVDs were manually drawn in the middle 4 consecutive sagittal slices on MAGiC T2 maps and conventional T2 maps with FireVoxel (Department of Radiology, New York University, New York, USA). Then the software automatically generated T2 histogram-derived parameters, including mean, median, 10th, 25th, 75th and 90th percentile, skewness, kurtosis and entropy. The correlations and difference between T2 histogram-derived parameters from MAGiC and conventional data were assessed by Pearson correlation analysis and Paired T test. The correlations between all T2 histogram-derived parameters from MAGiC and conventional T2 mapping and the Pfirrmann grade were assessed by the Spearman coefficient tests. Receiver operating characteristic (ROC) curves analysis were used to determine the sensitivity, specificity and the areas under the ROC curve (AUC) of T2 histogram-derived parameters for identifying Pfirrmann grading. The comparison of AUC was completed by Z test.Results
All the parameter values of 50 IVDs were shown in Table 1. T2 value from MAGiC was higher than that from conventional T2 mapping. Paired t test exhibited that all T2 histogram-derived parameter from MAGiC were different from that from conventional data with exception of entropy (Table 2 upper, P<0.05). Pearson correlation analysis indicated that T2 histogram-derived parameters obtained from MAGiC and conventional T2 mapping have moderate to high correlations with r ranging from 0.496 to 0.759 (Table 2 and Figure 1, p<0.001).The agreement for Pfirrmann grade of IVDs between the two radiologists was excellent (κ=0.804,P<0.001). 11 discs (22%) were graded as Pfirrmann I and 19 (38%) as II, 15 (30%) as III and 5 (10%) as IV. Each T2 histogram-derived parameter has a statistically significant relationship with Pfirrmann grade (P < 0.05) with exception of skewness and kurtosis from conventional data (Table 2 bottom). Correlation coefficient r value was not significantly different between the two sets of parameters. Table 4 shows the AUC, sensitivity and specificity of all T2 histogram-derived parameters for identifying adjacent Pfirrmann grades. Mean, median and entropy from MAGiC, kurtosis and entropy from conventional T2 mapping have ability to distinguish Pfirrmann grade Ⅰ and Ⅱ (P < 0.05), but Z test indicated that only the AUC of mean and median from MAGiC was statistical higher than mean and median from conventional T2 (P < 0.05, Fig. 2). Mean, median, skewness and entropy from MAGiC, median from conventional T2 mapping have ability to distinguish Pfirrmann grade Ⅱ and Ⅲ (P < 0.05), but the AUC of these parameters was not statistically significant between the two groups (P>0.05). For discriminating grade Ⅲ and Ⅳ, Mean, median, skewness, kurtosis and entropy from MAGiC, mean, median and entropy from conventional T2 mapping had good performance, but only median and skewness from MAGiC generated statistical higher AUC than that from conventional T2 mapping (P < 0.05).Discussion and conclusions
T2 values obtained from MAGiC were significantly higher than that from conventional T2 mapping (91.87 vs. 58.69). The current T2 values from MAGiC was close to the previous result on synthetic MRI4. However, the MAGiC-derived parameters were different to traditional T2 histogram-derived parameters, such as positional parameters (mean, median, 10th, 25th, 75th and 90th percentile) and shape-related parameters (skewness, kurtosis), which should be further explored if the diagnosis of degenerated IVD is different. The current results exhibited that the diagnostic efficacy of MAGiC-derived T2 values for IVD degeneration is higher than traditional data, but is lower than the previous study.4,5 The possible reasons were as follows: firstly, the sample size in this research is limited; second, the included subjects are young and normal volunteers. Therefore, larger sample are needed to verify the role and practicality of MAGiC for intervertebral disc degeneration. In addition, ten continuous slices at least should be used in one MAGiC scanning prolonged the scan time since at least 5 times of MAGiC should be performed to cover each lumbar spine with each field of view parallel to each vertebrae. One-time MAGiC scan on lumbar vertebrae might be relatively impractical in clinics for diagnosis.Acknowledgements
Funding: This work was supported by projects of the National Natural Science Foundation of China (NSFC) (No. 31630025 and 81930045)References
1. Watanabe A, Benneker LM, Boesch C, Watanabe T, Obata T, Anderson SE (2007) Classification of intervertebral disk degeneration with axial T2 mapping. AJR Am J Roentgenol 189(4):936–942.2. Stelzeneder D, Messner A, Vlychou M, Welsch GH, Scheurecker G, Goed S, Pieber K, Pflueger V, Friedrich KM, Trattnig S (2011) Quantitative in vivo MRI evaluation of lumbar facet joints and intervertebral discs using axial T2 mapping. Eur Radiol 21(11):2388–2395.3. C.W. Pfirrmann, A. Metzdorf, M. Zanetti, J. Hodler, N. Boos, Magnetic resonance classification of lumbar intervertebral disc degeneration, Spine 26(17) (2001) 1873-8.4. Jiang Y, Yu L, Luo X et al (2020) Quantitative synthetic MRI for evaluation of the lumbar intervertebral disk degeneration in patients with chronic low back pain. Eur J Radiol 124:1088585. Zhang W, Zhu J, Xu X, Fan G (2020) Synthetic MRI of the lumbar spine at 3.0 T: feasibility and image quality comparison with conventional MRI. Acta Radiol 61:461-470Figures
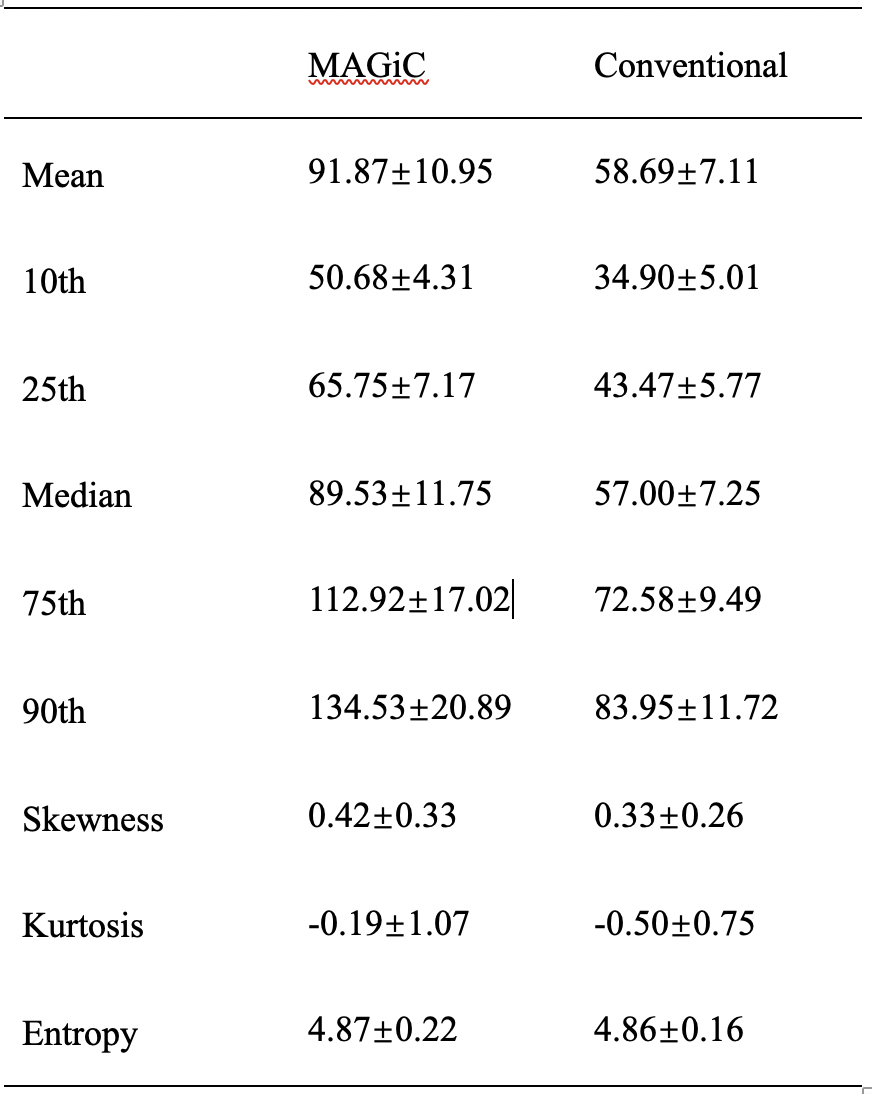
Table 1. Parameter values of 50 intervertebral discs.
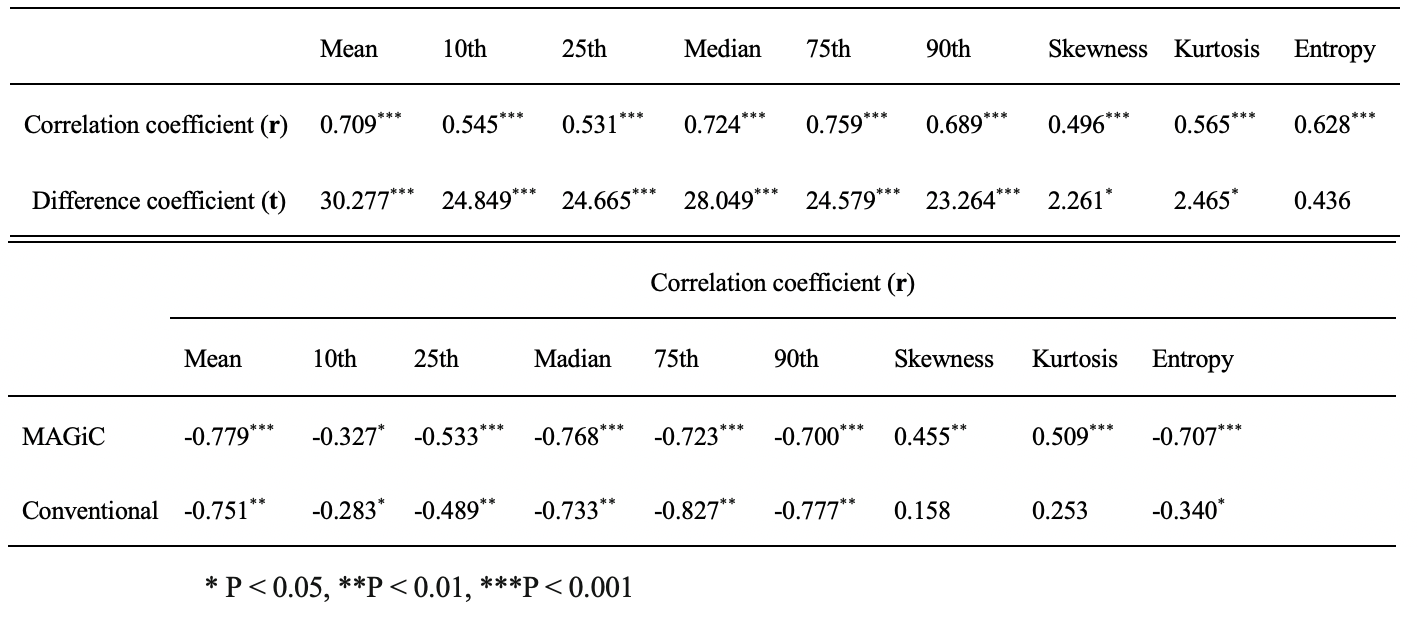
Table 2. (Upper) The correlations and differences between T2 histogram-derived parameters from MAGiC and conventional T2 mapping. (Bottom) The correlations between T2 histogram-derived parameters from MAGiC and conventional data and Pfirrmann grade.
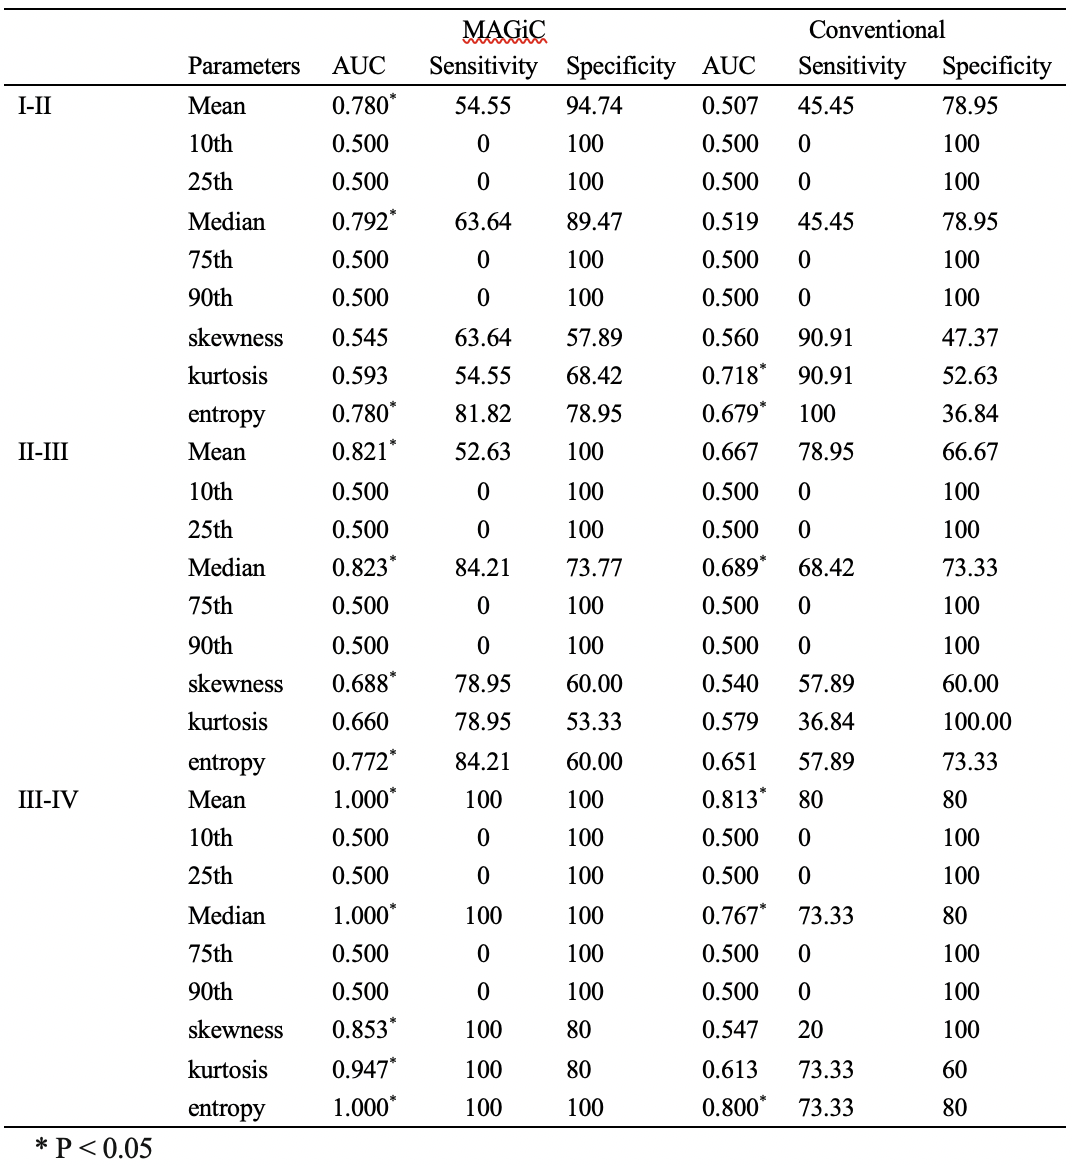
Table 3. Receiver operating characteristic curves analysis were used to determine the sensitivity, specificity and the areas under the ROC curve (AUC) of T2 histogram-derived parameters for identifying Pfirrmann grading.
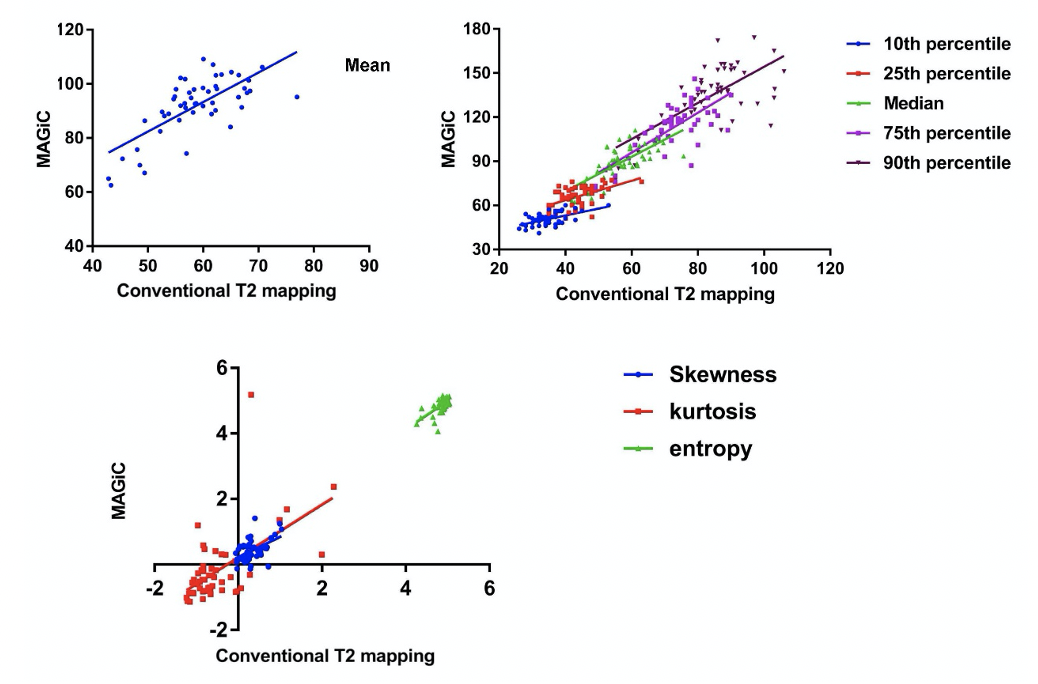
Figure 1. T2 histogram-derived parameters obtained from MAGiC and conventional T2 mapping have moderate to high correlations.
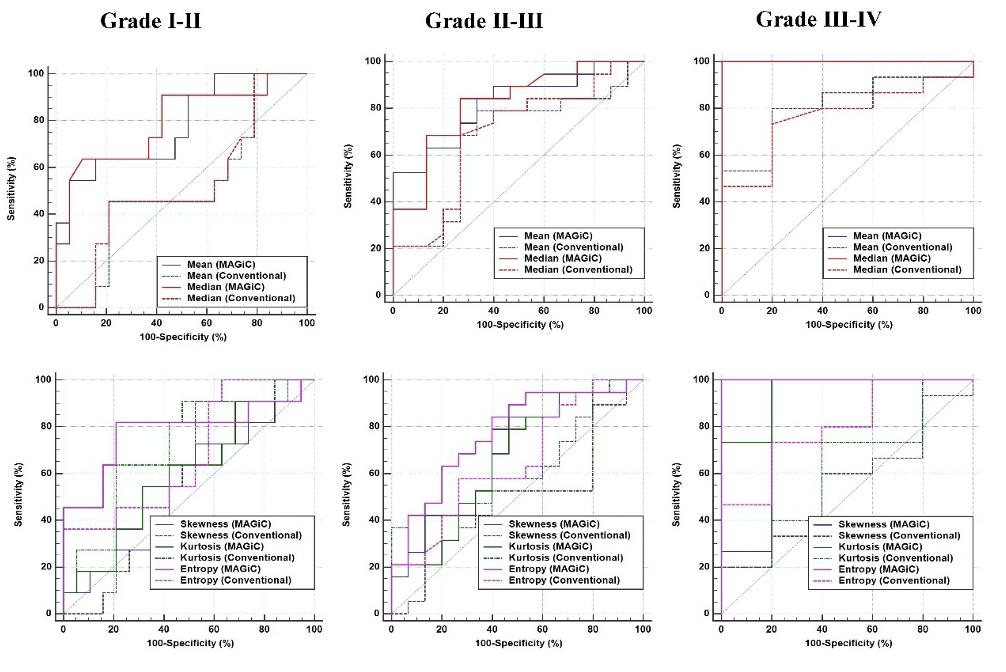
Figure 2. Receiver operating characteristic curves analysis.