3194
BOLD and IDEAL-IQ evaluation for lumbarparaspinal muscle changes in patients with chronic low back pain1The First Affiliated Hospital of Kunming Medical University, Kunming, China, 2The First Affiliated Hospital of Kunming Medical University, kunming, China, 3GE healthcare, China, Beijing, China
Synopsis
This study analyzed the relationship between the cross-sectional area (CSA), effective lateral relaxation rate (R2* value), fat fraction (FF value) of lumbar paraspinal muscles of patients with chronic low back pain (CLBP group) and asymptomatic control group (Control group). The multifidus muscle and erector spinae muscle at the central level of the L4/L5 intervertebral disc were the target muscles.BOLD and IDEAL-IQ provided a new idea for imaging evaluation of lumbar paraspinal muscles. Our study concluded that BOLD and IDEAL-IQ are feasible to evaluate the changes of lumbar muscle morphology and function in patients with CLBP.
INTRODUCTION
Low back pain is a common musculoskeletal condition, with considerable associated disability, work absenteeism, health care costs and so on. It has been estimated that more than 85% of people suffer from low back pain at some time during their lives[1,2]. Fat infiltration in paraspinal muscles is frequently demonstrated in cross-sectional imaging of spines[3].Although some studies have shown an association between low back pain and paraspinal muscles degeneration. There are few studies assessing paraspinal muscle fat infiltration and lumbar disc degeneration. As a real-time imaging technology, ultrasound is simple and repeatable. But it has always been so difficult to overcome subjectivity that the accuracy of the results is still controversial. CT can provide information such as muscle density and CSA. But unfortunately, it is far from meeting the needs of today’s era of precision medicine. As the L4/L5 intervertebral disc is so prone to produce lesions that the intervertebral discs were the target muscles in our study. The purpose of this study was to evaluate the changes of lumbar paravertebral muscles in patients with chronic low back pain using BOLD and IDEAL-IQ.METHODS
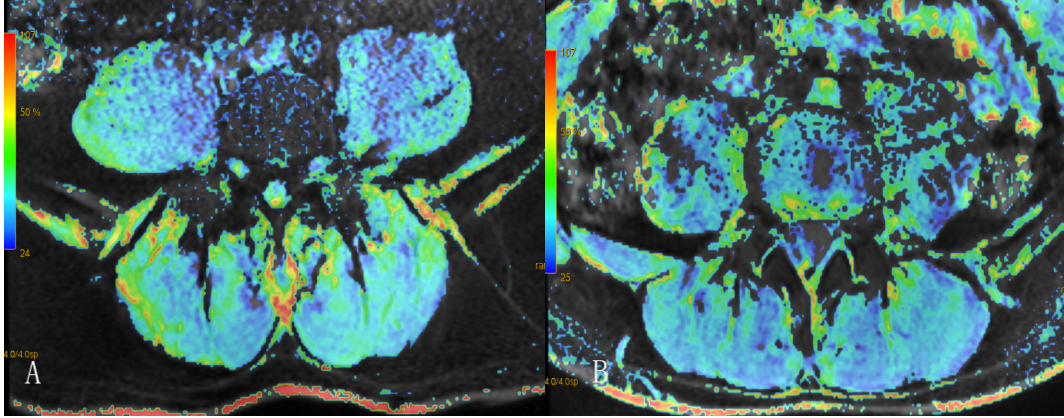
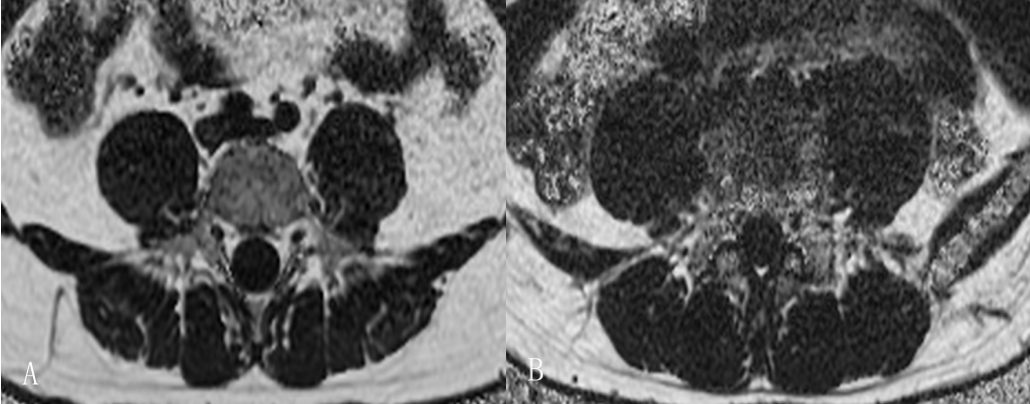
This study was approved by the institutional review board, and written informed consent was obtained from all patients. A total number of 30 patients in CLBP group and 15 persons in Control group from 25 to 69 years old (mean 41.32±6.35 years old) underwent examination using a 3.0T MR scanner (Discovery MR750w, GE, USA) with an 8-channel CTL Target Array Coil. sagittal conventional T2WI, axial T2WI, BOLD and IDEAL-IQ images were acquired at every examination of target level. The original scan data were transferred to the workstation (AW4.6, GE, USA) for analyses. The CSA, R2* and FF values of each muscle at L4/L5 central level of intervertebral disc were measured on the corresponding sequences. BOLD and IDEAL-IQ imaging pseudo-color images are reconstructed (Figure 1 and 2). SPSS 26.0 statistical software was used to analyze the data. Independent sample T test was used to compare the difference of T2 and FF value between LBP group and control group.RESULTS
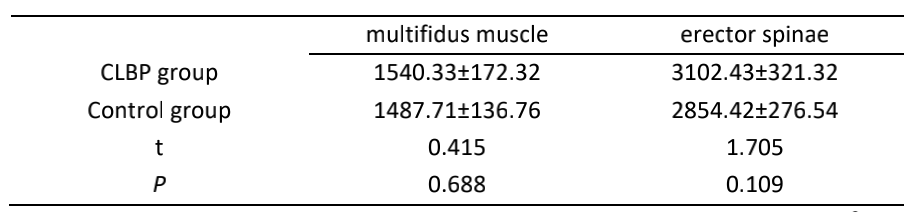
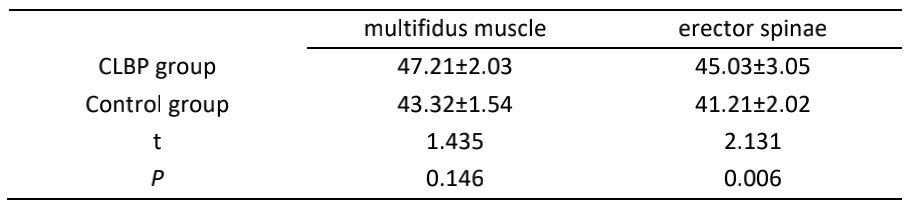
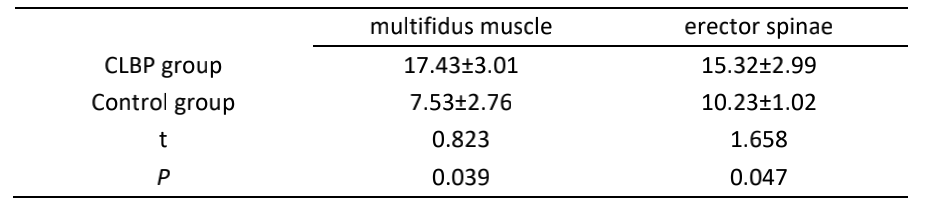
At the central level of L4/L5 intervertebral disc, the difference of CSA between CLBP group and control group was not statistically significant (P > 0.05). There was also no statistically significant difference in the R2* value of the multifidus muscle between the two groups (P > 0.05). However, there was a significant difference in the R2* value of theerector spinae muscle between the CLBP group (45.03±3.05) and control group (41.21±2.02) at the same level (P=0.006). The difference in FF value of multifidus muscle between CLBP group (17.43±3.01) and control group (7.53±2.76) was statistically significant (P=0.039).This difference of erector spinae muscle was also evident(P=0.047) between CLBP group (15.32±2.99) and control group (10.23±1.02) (Table 1,2, 3).DISCUSSION AND CONCLUSION
Conventional imaging parameters (the CSA of lumbar paraspinal muscle) reveal the amount of muscle or the degree of fat infiltration. It is difficult to provide value in terms of muscle function.Several studiesused subjective or semi-quantitative methods to evaluate the infiltration of lumbar paraspinal muscle fat and intervertebral disc degeneration [4,5]. In this study, we can see that in patients with CLBP, the change of lumbar paravertebral muscle function may be earlier than morphology. BOLD and IDEAL-IQ imaging may be useful methods for the evaluation of lumbar paravertebral muscles changes in CLBP, which will provide a new perspective to reveal the relationship between paraspinal muscles and degenerative diseases of the lumbar spine. In this study, there were some deficiencies for no histopathological comparison of lumbar paraspinal muscles.Acknowledgements
No acknowledgement found.References
[1] Ogon I , Takebayashi T , Takashima H , et al. Magnetic resonance spectroscopic analysis of multifidus muscles lipid content and association with spino-pelvic malalignment in chronic low back pain[J]. British Journal of Radiology, 2017, 90(1073):20160753.
[2] Dagenais S, Tricco AC, Haldemann S. Synthesis of recommendations for the assessment and management of low back pain from recent clinical practice guidelines. Spine J 2010;10(6):514–29.
[3] Crawford RJ, Filli L, Elliott JM, et al. Age- and level-dependence of fatty infiltration in lumbar paravertebral muscles of healthy volunteers. AJNR Am J Neuroradiol.2016;37:742–8.
[4] Urrutia J, Besa P, Lobos D, et al. Lumbar paraspinal muscle fat infiltration is independently associated with sex, age, and intervertebral disc degeneration in symptomatic patients. Skeletal Radiol, 2018, 47(7): 955-961.[5]Teichtahl AJ, Urquhart DM, Wang Y, et al. Lumbar disc degeneration is associated with modic change and high paraspinal fat content-a 3.0 T magnetic resonance imaging study. BMC Musculoskeletal Disord, 2016, 17(1): 439.
Figures