3192
Quantitative T2 parametric value in assessment of abnormal lumbar paraspinal muscle in patients with low back pain
Yinqi Liu1, Huiting Deng1, Weiyin Liu2, and Kun Zhang1,3
1Department of Radiology, First Affiliated Hospital of Hunan University of Chinese Medicine, Changsha, China, 2MR Research, GE Healthcare, Beijing, China, 3College of Integrated Traditional Chinese and Western Medicine, Hunan University of Chinese Medicine, Changsha, China
1Department of Radiology, First Affiliated Hospital of Hunan University of Chinese Medicine, Changsha, China, 2MR Research, GE Healthcare, Beijing, China, 3College of Integrated Traditional Chinese and Western Medicine, Hunan University of Chinese Medicine, Changsha, China
Synopsis
Chronic low back pain (CLBP) has been reported to be associated with low back dysfunction with the characteristics of decreased cross-section area (CSA) of paraspinal muscles and increased adipose content. In our study, T2 value at L4/L5 multifidus muscle was significantly higher in LBP group than in HCs. The multifidus muscle is the most medial in the low back extensor group and has the maximum strain stress when spinal movement and balance maintenance, so it might easily cause the abnormality of the low back muscle group. T2 mapping could be a good predictor of detecting minimal variation of multifidus muscles.
Introduction
Chronic low back pain (CLBP) is referred that pain, muscle tension and stiffness accompanied with or without radical pain of low extremity for over three months.1 World Health organization (WHO) has reported that low back pain is the most common musculoskeletal disease; its presence affects everyone at certain time and 4% to 33% of population suffer low back pain at any time. 2 Patients have to endure not only long-trem pain and pian-induced functional impairments; thereafter LBP hinders their daily activities, including work, sports and so on and even brings vast financial burden to individuals, families and the government.Many studies have indicated that CLBP is associated with low back dysfunction and decreased cross-section area (CSA) of paraspinal muscles and increased adipose content.3-6 To date, studies of T2-mapping has shown that protein loss and adipose replacement in muscle prolong T2 value.7-8 Therefore, this study aims to evaluate the abnormality and deterioration of paraspinal muscles with T2 mapping and to quantitatively compare T2 value differences of lumbar paraspinal muscle between patients with low back pain and healthy controls (HCs).Materials and Method
6 patients with LBP and 6 HCs underwent lumbar spine examination using routine MRI and T2-mapping imaging on 3.0T MR scanner (Signa HDxt, GE Healthcare). Regions of interest (ROIs), including the middle level of L4 and L5 of the bilateral multifidus muscle and the erector spinae muscle, were delineated on the T2 maps (Figure 1). Independent samples t-test was used to compare T2 value in the ROIs between two groups.Results and Discussion
T2 value at the middle of L4 and L5 levels of the multifidus muscle was significantly higher in LBP group than in HCs (P < 0.05).No significant difference of T2 values of the erector spinae muscle between two groups was found (P > 0.05). The multifidus muscle is located at both sides of spinous process of the first to the fifth lumbar and the most medial in the low back extensor group. It has the maximum strain stress when spinal movement and balance maintenance. Compared to erector spinae muscle, the multifidus muscle is innervated by a single segment, and there is no communication between branches, which is more likely to cause muscle degeneration. In addition, there was no difference of T2 values between the left and the right multifidus muscle as well as erector spinae muscle at the level of L4 and L5 middle in each group (P >0.05). It is speculated that degeneration-prone L4/L5 and L5/S1 discs cause denervation of paraspinal muscles at the corresponding level and is related to the influence of nerve root compression on the motor function of the multifidus muscle.9-10Conclusions
T2-mapping imaging enables to detect minimal variation of multifidus muscles in patients with low back pain.Acknowledgements
Funding: None.References
- Koes B W,van Tulder M W,Thomas S,Diagnosis and treatment of low back pain.[J] .BMJ, 2006, 332: 1430-4.
- Woolf AD, Pfleger B. Burden of major musculoskeletal conditions. Bull World Health Organ 2003;81:646-656.
- Wan Q,Lin C,Li X et al. MRI assessment of paraspinal muscles in patients with acute and chronic unilateral low back pain. Br J Radiol, 2015, 88: 20140546.
- Hebert Jeffrey J,Kjaer Per,Fritz Julie M et al. The relationship of lumbar multifidus muscle morphology to previous, current, and future low back pain: a 9-year population-based prospective cohort study.Spine, 2014, 39: 1417-25.
- Wallwork Tracy L,Stanton Warren R,Freke Matt et al. The effect of chronic low back pain on size and contraction of the lumbar multifidus muscle .Man Ther, 2009, 14: 496-500.
- Chan Suk-Tak,Fung Po-Kwan,Ng Nim-Yu et al. Dynamic changes of elasticity, cross-sectional area, and fat infiltration of multifidus at different postures in men with chronic low back pain.[J] .Spine J, 2012, 12: 381-8.
- Kim Hee Kyung,Laor Tal,Horn Paul S et al. T2 mapping in Duchenne muscular dystrophy: distribution of disease activity and correlation with clinical assessments.[J] .Radiology, 2010, 255: 899-908.
- Arpan Ishu,Forbes Sean C,Lott Donovan J et al. T2 mapping provides multiple approaches for the characterization of muscle involvement in neuromuscular diseases: a cross-sectional study of lower leg muscles in 5-15-year-old boys with Duchenne muscular dystrophy NMR Biomed, 2013, 26: 320-8.
- Ozcan-Eksi E E, Eksi M S, Akcal M A. Severe Lumbar Intervertebral Disc Degeneration Is Associated with Modic Changes and Fatty Infiltration in the Paraspinal Muscles at all Lumbar Levels, Except for L1-L2: A Cross-Sectional Analysis of 50 Symptomatic Women and 50 Age-Matched Symptomatic Men World Neurosurg, 2019, 122: e1069-e1077.
- Teichtahl A J, Urquhart D M, Wang Y, et al. Lumbar disc degeneration is associated with modic change and high paraspinal fat content - a 3.0T magnetic resonance imaging study[J]. BMC Musculoskelet Disord, 2016, 17(1): 439.
Figures
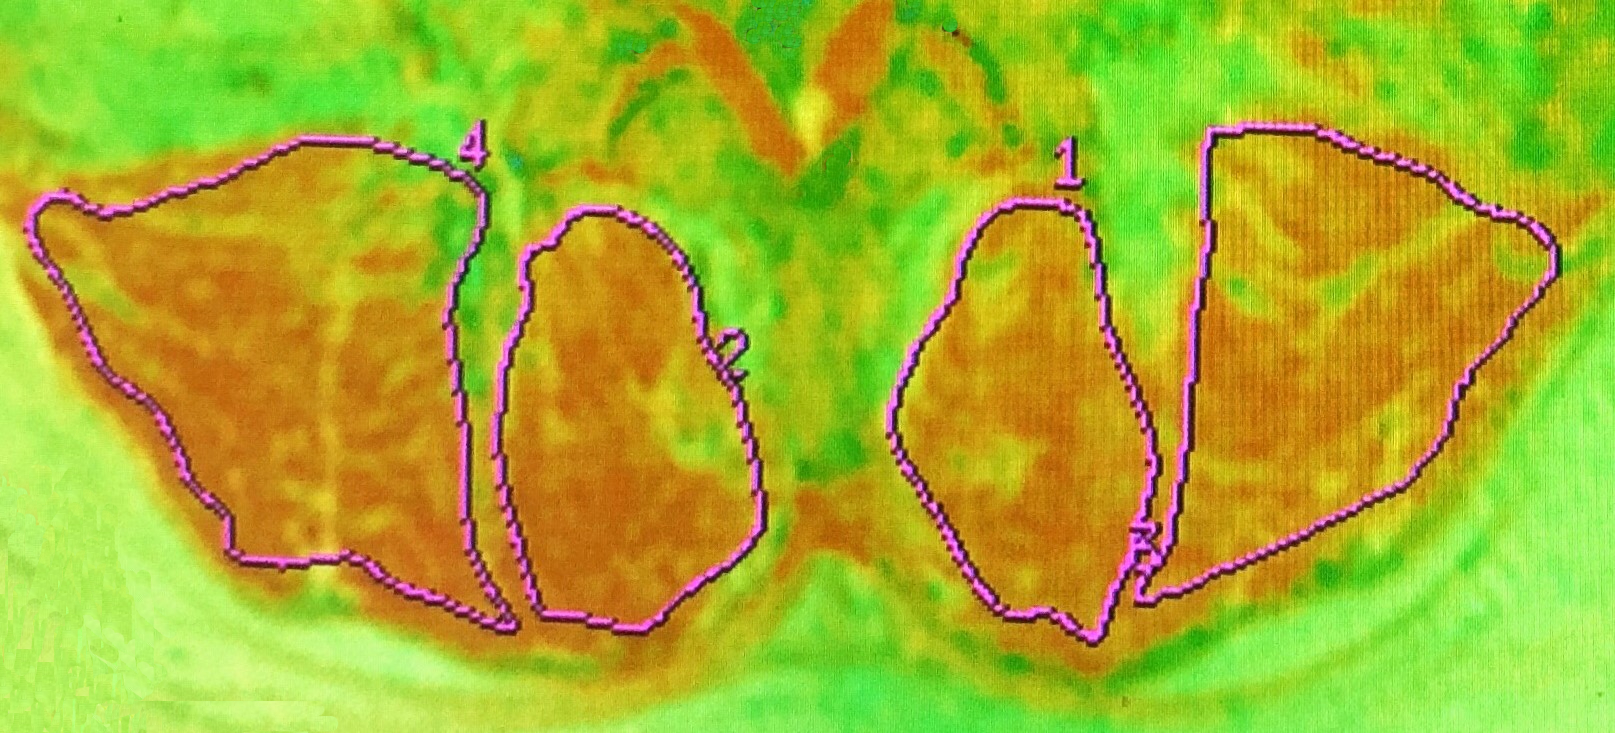
Figure 1 ROIs of the bilateral multifidus (MF) and erector
spinae(ES) respectively were drawn on T2mapping imaging