3182
1H MRS: a tool to study age-related changes in intracellular metabolites in the deep spinal muscles?1Radiology Physics, Department of Clinical Physics and Bioengineering, University Hospital, Coventry, United Kingdom, 2Centre for Sport, Exercise and Life Sciences, Coventry University, Coventry, United Kingdom, 3Coventry NIHR CRF, Human Metabolic Research Unit, University Hospital, Coventry, United Kingdom, 4Department of Physics, University of Warwick, Coventry, United Kingdom
Synopsis
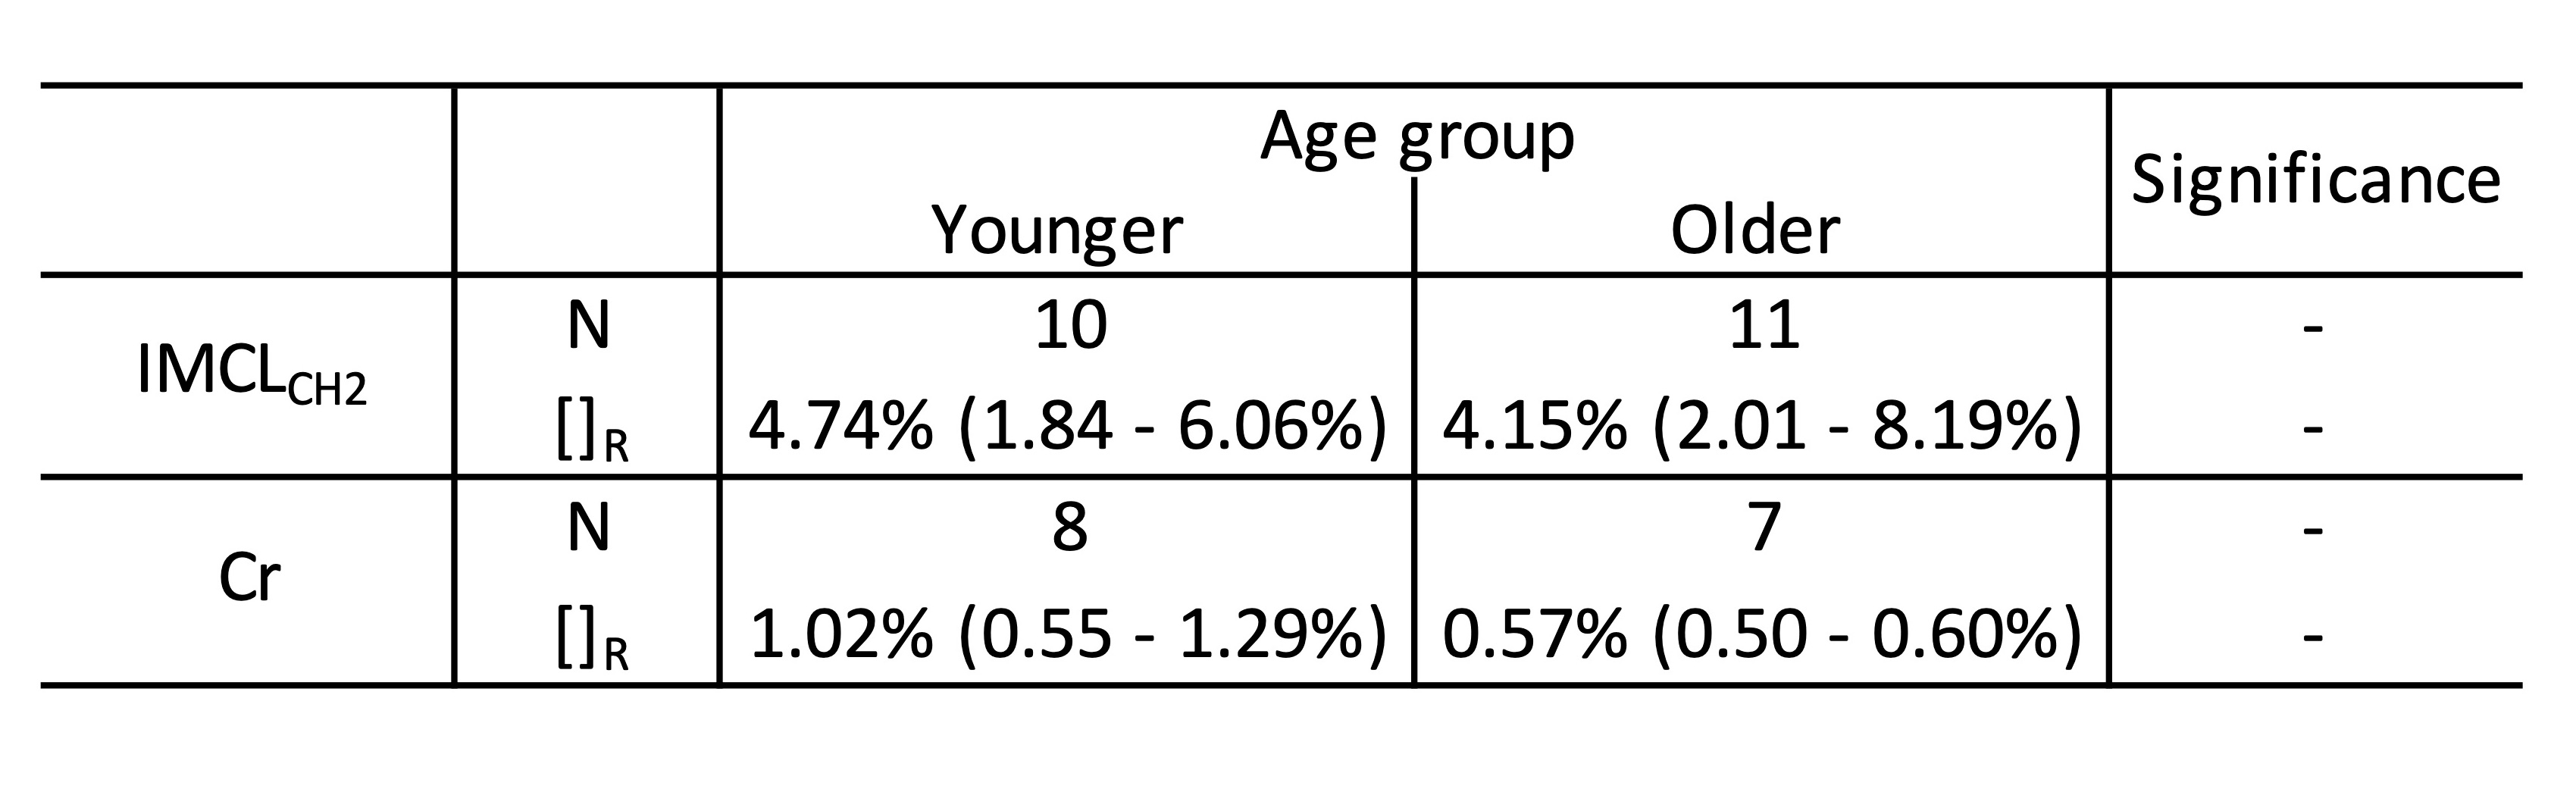
1H MRS was used to investigate relative concentrations of methylene intracellular lipids [IMCLCH2]R and creatine [Cr]R in the psoas of groups of younger (19-30yrs) and older (61-81yrs) fit male volunteers. No difference was found between groups for either metabolite (p>0.05). However, the median value for [Cr]R in the older group (median;Q1-Q3=1.02;0.55-1.29%) was much higher than in the younger group (0.57;0.50-0.60%) suggesting [Cr]R could partially explain reduction in muscle strength with age being greater than predicted by loss of muscle mass. There was no correlation between metabolite concentrations (r2=0.21) so [Cr]R may possibly be a marker for age-related changes in muscle.
Introduction and Background
The loss of muscle strength with age is greater than predicted by the loss of muscle mass1,2 suggesting there are also changes in fibre architecture and/or changes in myocellular metabolite concentrations. Understanding age related changes in the spinal muscles is particularly important as these may play a role in the increasing incidence of falls with age2-4. Whilst much attention has been focussed on changes in muscle mass and fat infiltration, and more recently on fibre architecture1,5, little is known about changes in myocellular metabolites with age. In this study we used 1H magnetic resonance spectroscopy (MRS) to investigate changes in the concentrations of methylene intracellular lipids (IMCLCH2) and creatine (Cr) in the psoas muscle with age.Method
Two groups of 12 healthy fit adult male volunteers were studied: a younger group; and an older group where age related changes would be expected1 (table 1). On a GE Discovery 750W 3T scanner (GE Healthcare, UK) the right psoas muscle was identified on T2 sagittal and axial images and on coronal scout images. Using these images, a 20mm sided cubic box was positioned away from any fat deposits in the central portion of the psoas with the top of the box aligned with the superior end-plate of the fourth lumbar vertebra. Within this box, 8 water suppressed and 2 non-water suppressed free induction decay (fid) measurements were obtained from the 40-element table spine coil and a 48-element body array coil using the Probe-SV sequence with coil elements selected automatically by the scanner.After zero-order rephrasing and combining the complex fids from the multi-element coils, a 12-component HSVD decomposition of the signal was performed6. The amplitudes of the real parts of decaying exponential components identified were determined by least squares fitting. Having centred the residual water peak at 4.7ppm, components corresponding to the IMCLCH2 peak (1.25-1.35ppm)7-9 and Cr peak (2.95-3.15)7-9 were identified (figure 1). As there was no chemical standard, the ratio of the integral of these peaks to the integral of the unsuppressed water peak were determined to give relative concentrations of the metabolites, [IMCLCH2]R and [Cr]R, respectively. Metabolite concentrations were non-normally distributed hence values have been summarized using the median and interquartile range. Statistical comparisons of metabolite concentrations were performed using the Mann-Whitney U-test. Metabolite peaks were not always detected, and the number in each group for each metabolite were compared using a χ2 test. Statistical significance was taken as p < 0.05 throughout.
Results
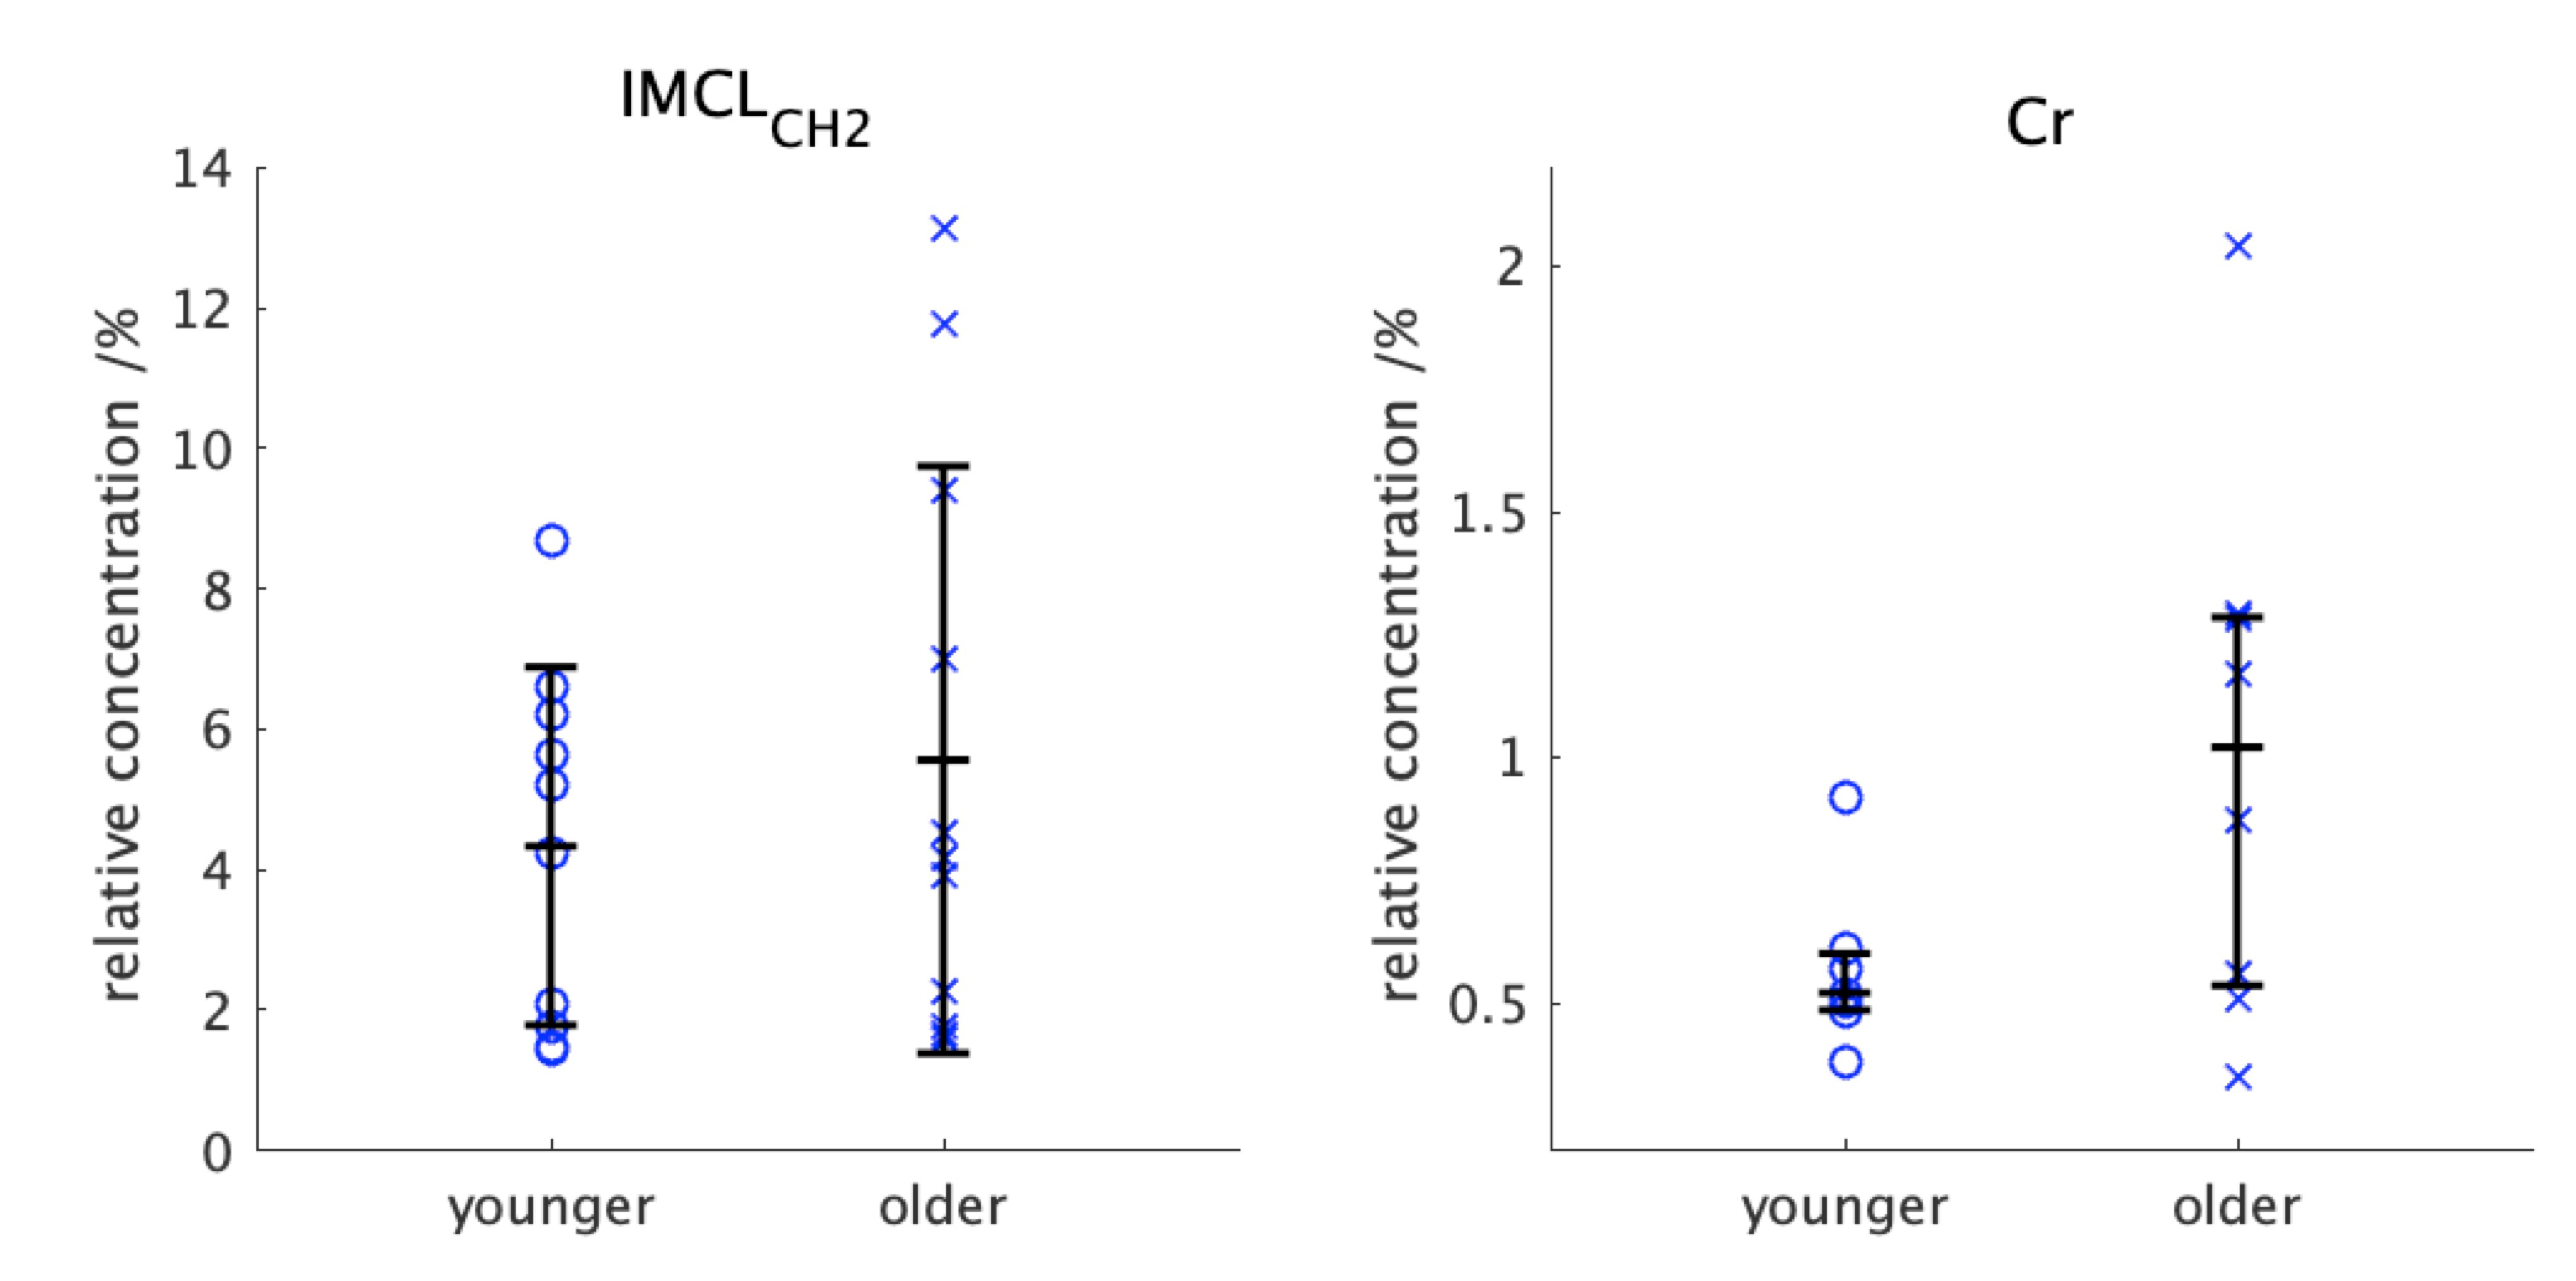
Whilst IMCLCH2 peaks were identified for the majority of participants in both groups, Cr peaks were only identified in about 75% of both groups due to the poor signal to noise ratio of the fids but there were no statistical differences in the numbers of each metabolite identified between groups (table 2). There was no difference in [IMCLCH2]R between the younger and older groups but the [Cr]R was much higher in the older group than in the younger group, however, this difference failed to reach statistical significance p=0.23 (table 2). Figure 2 shows the wide variation in concentration values in the older group when compared with the younger group. The correlation between [IMCLCH2]R and [Cr]R gave r2 = 0.21.Discussion
Whilst most studies using 1H MRS metabolites in muscle have used large muscles of the leg, the deep spinal muscles are challenging because the distance to the receiver coils is much greater giving fids with a poor signal-to-noise ratio that challenge traditional MRS analysis techniques including AMARES10. Only being able to resolve 75% of the Cr peaks shows a need to improve the signal-to-noise ratio of the measurements. Options include restricting investigations to more superficial spinal muscles, increasing the number of fids to average, and increasing the magnetic field strength.Related work on the data set used in this study has shown group differences in the psoas consistent with age related changes in the older group11. Whilst there was no difference in the [IMCLCH2]R between groups, the median [Cr]R was much higher in the older group, although this was not statistically significant due to the high spread of values. The older group were unusually very fit for their age; physical activity is known to preserve muscle function in ageing12 and this may explain some of the high spread of values.
Increasing [Cr] indicates a reduced concentration of phosphocreatine [pCr]13,14, a determinant of muscle strength. Therefore our finding of increased creatine in the older group may be part of the explanation of the greater reduction in muscle strength with age than predicted by the loss of muscle mass1,2. Whilst there is a large spread of values for the [Cr]R in the older group many of those values were above the upper quartile for the younger group. This, coupled with no correlation between metabolite concentrations raises the interesting possibility that [Cr] might be a specific marker for metabolic changes in muscle with age.
Acknowledgements
The authors acknowledge the support of Michael Diokno, and the staff of the MRI Department; and Alison Campbell and the staff of the Human Metabolic Research Unit at University Hospitals Coventry and Warwickshire NHS Trust.References
- Boutin RD, Yao L, Canter RJ, Lenchik L. Sarcopenia: current concepts and imaging implications. AJR 2015;205:W255-W266.
- Rosenburg IH, Sarcopenia: origins and clinical relevance. J. Nutr. 1997;127:990S-991S.
- Janssen I, Heymsfield S and Ross R. Low relative skeletal muscle mass (Sarcopenia) in older persons is associated with functional impairment and physical disability. Journal of the American Geriatrics Society 2002;50(5):889-896.
- Dallaway A, Kite C, Giffen C, Duncan M, Tallis J, Renshaw D, Hattersley J. Age-related degeneration of the lumbar paravertebral muscles: systematic review and three-level meta-regression. Exp. Gerontol. 2020;133:110856.
- Giraudo C, CavaliereA, Lupi A, Guglielmi G, Quaia, E. Established paths and new avenues: a review of the main radiological techniques for investigating sarcopenia. Quant. Imaging Med. Surg. 2020;10(8):1602-1613.
- Vanhamme L, Fierro RD, Huffel SV, de Beer R. Fast removal of residual water in proton spectra. J. Mag. Res. 1998;132:197-203.
- Krssak M, Peterson KF, Dresner A, DiPietro L, Vogel SM, Rothman DL, Shulman GI, Roden M. Intramyocellular lipid concentrations are correlated with insulin sensitivity in humans: a 1H spectroscopy study. Diabetologia 1999, 42:113-116.
- Torriani M, Thomas BJ, Halpern EF, Jensen ME, Rosenthal DI, Palmer WE. Intramyocellular lipid quantification: repeatability with 1H MR spectroscopy. Radiology 2005;236(2):609-614.
- Weis J, Johansson L, Ortiz-Nieto F, Ahlstrom H. Assessment of lipids in skeletal muscle by LCModel and AMARES. J. Magn. Reson. Imaging 2009;30:1124-1129.
- Vanhamme L, van den Boogaart A, Huffel SV. Improved methods of accurate and efficient quantification of MRS data with use of prior knowledge. J. Mag. Res. 1997;129:35-43.
- Dallaway, A Hattersley John, Diokno M, Tallis J, Renshaw D, Wilson A, Wayte S, Weedall A, Duncan M. Age-related degeneration of lumbar muscle morphology in healthy younger versus older men, Aging Male, in press.
- Dipietro L, Campbell WW, Buchner DM, Erickson KI, Powell KE, Bloodgood B, Hughes T, Day KR, Piercy KL, Vaux-Bjerke A, Olson RD, Hillman CH, Jakicic JM, Janz, KF, Katzmarzyk, PT, King AC, Kraus WE, Macko, RF, Marquez DX, McTiernan A, Pate RR, Pescatello, LS, Whitt-Glover MC. Physical activity, injurious falls, and physical function in aging: an umbrella review. Med Sci Sports Exerc. 2019; 51(6): 1303-1313.
- Arnold DL, Mathews PM, Radda GK. Metabolic recovery after exercise and assessment of mitochondrial function in vivo in human skeletal muscle by means of 31P NMR. Magn. Reson. Med. 1984;1:307-315.
- Ripley E, Clarke GD, Hamidi V, Martinex RA, Settles FD, Solis C, Deng S, Abdul-Ghani M, Tripathy D, DeFronzo RA. Reduced skeletal phosphocreatine concentration in type 2 diabetic patients: a quantitate image-based phosphorous-31MR spectroscopy study. Am. J. Physiol. Endocrine Metab. 2018; 315:E229-E239.
Figures
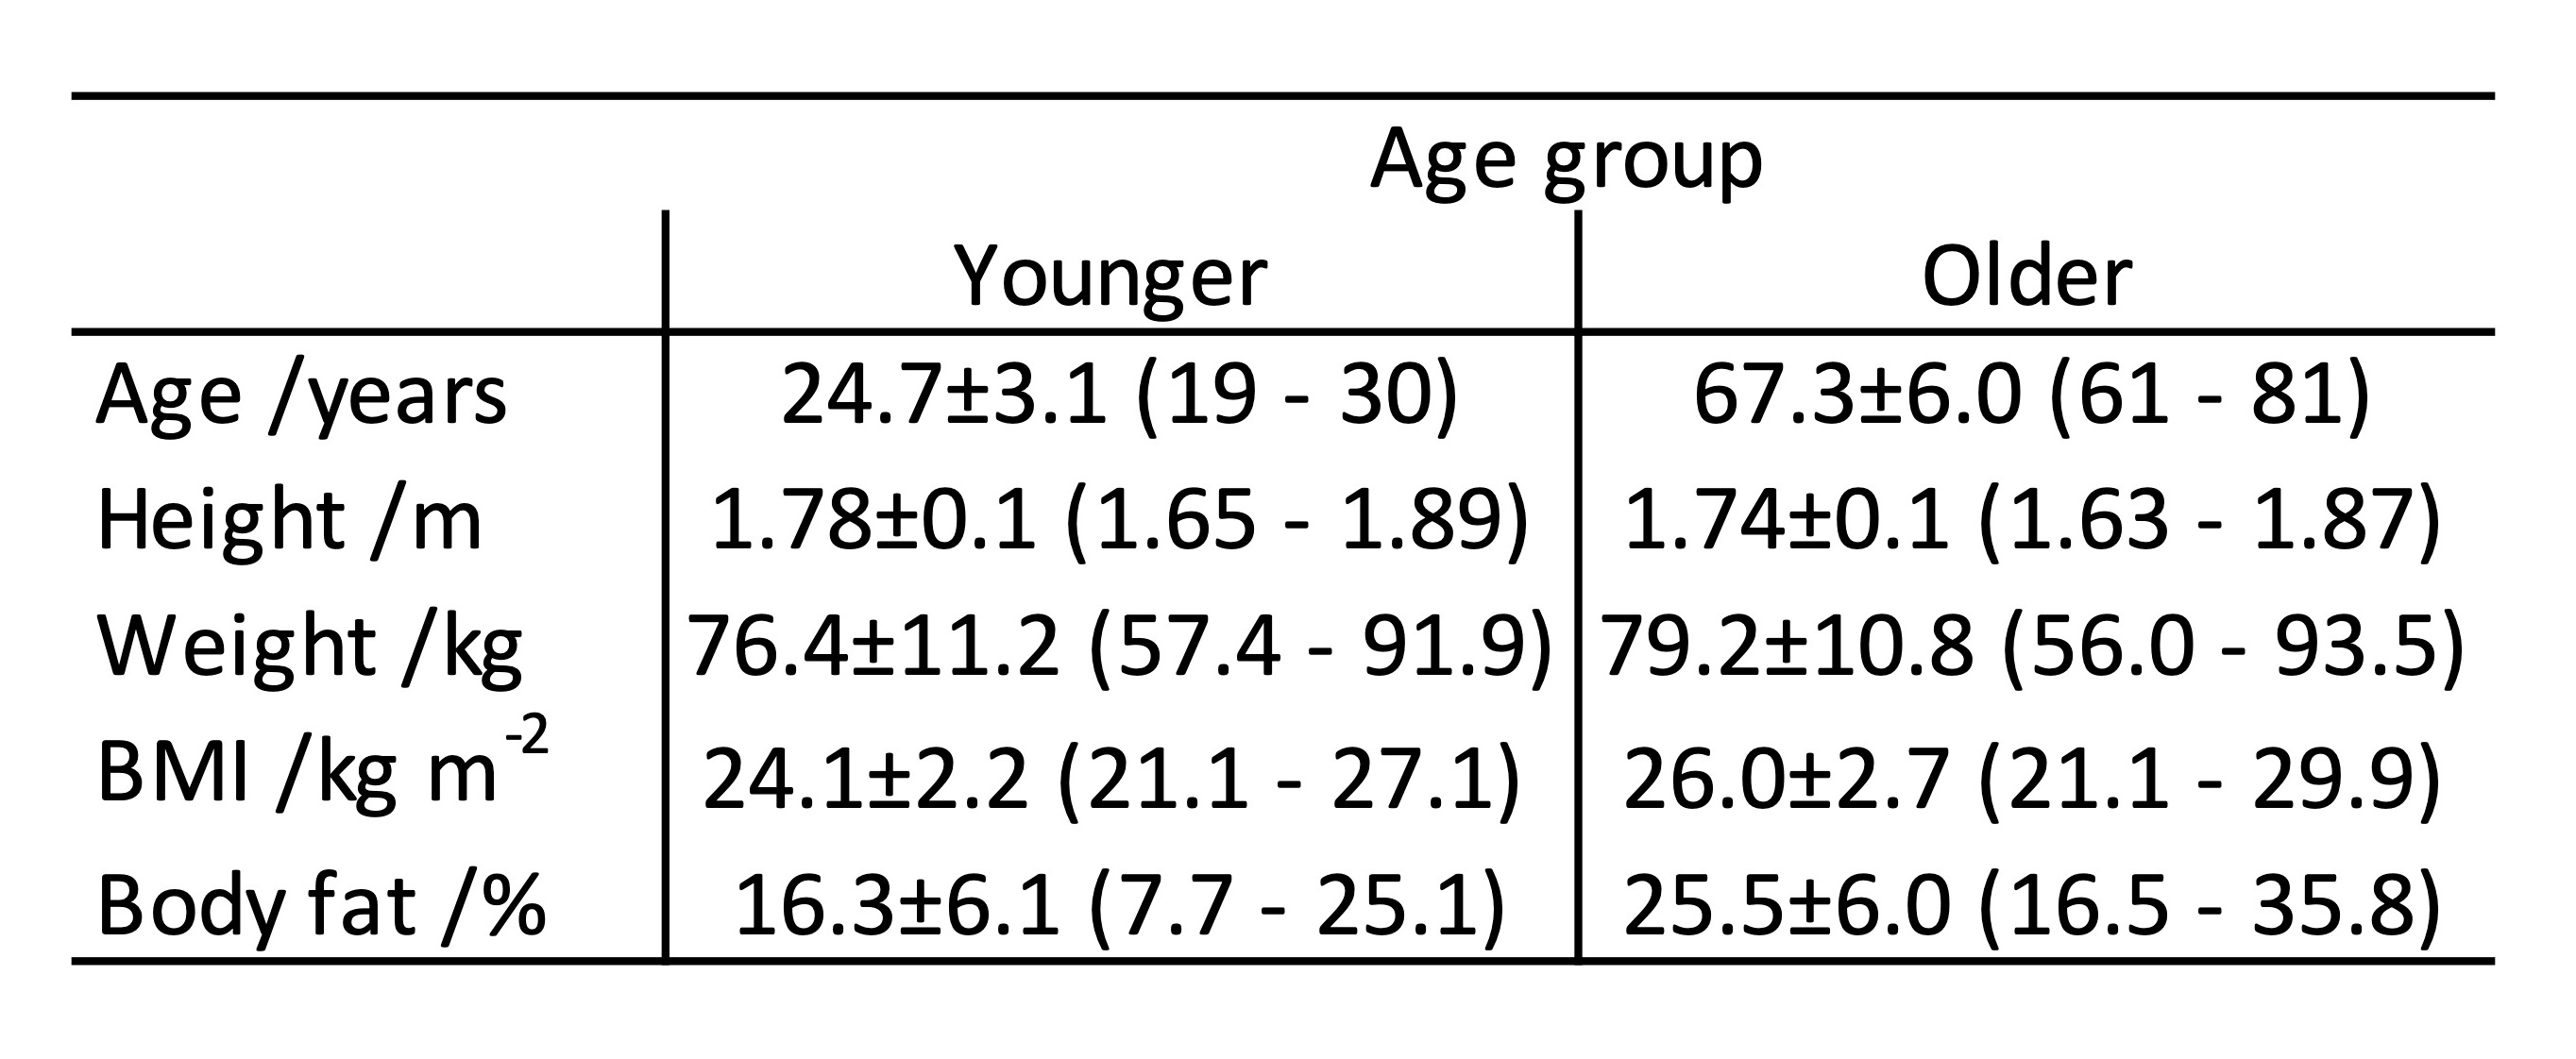
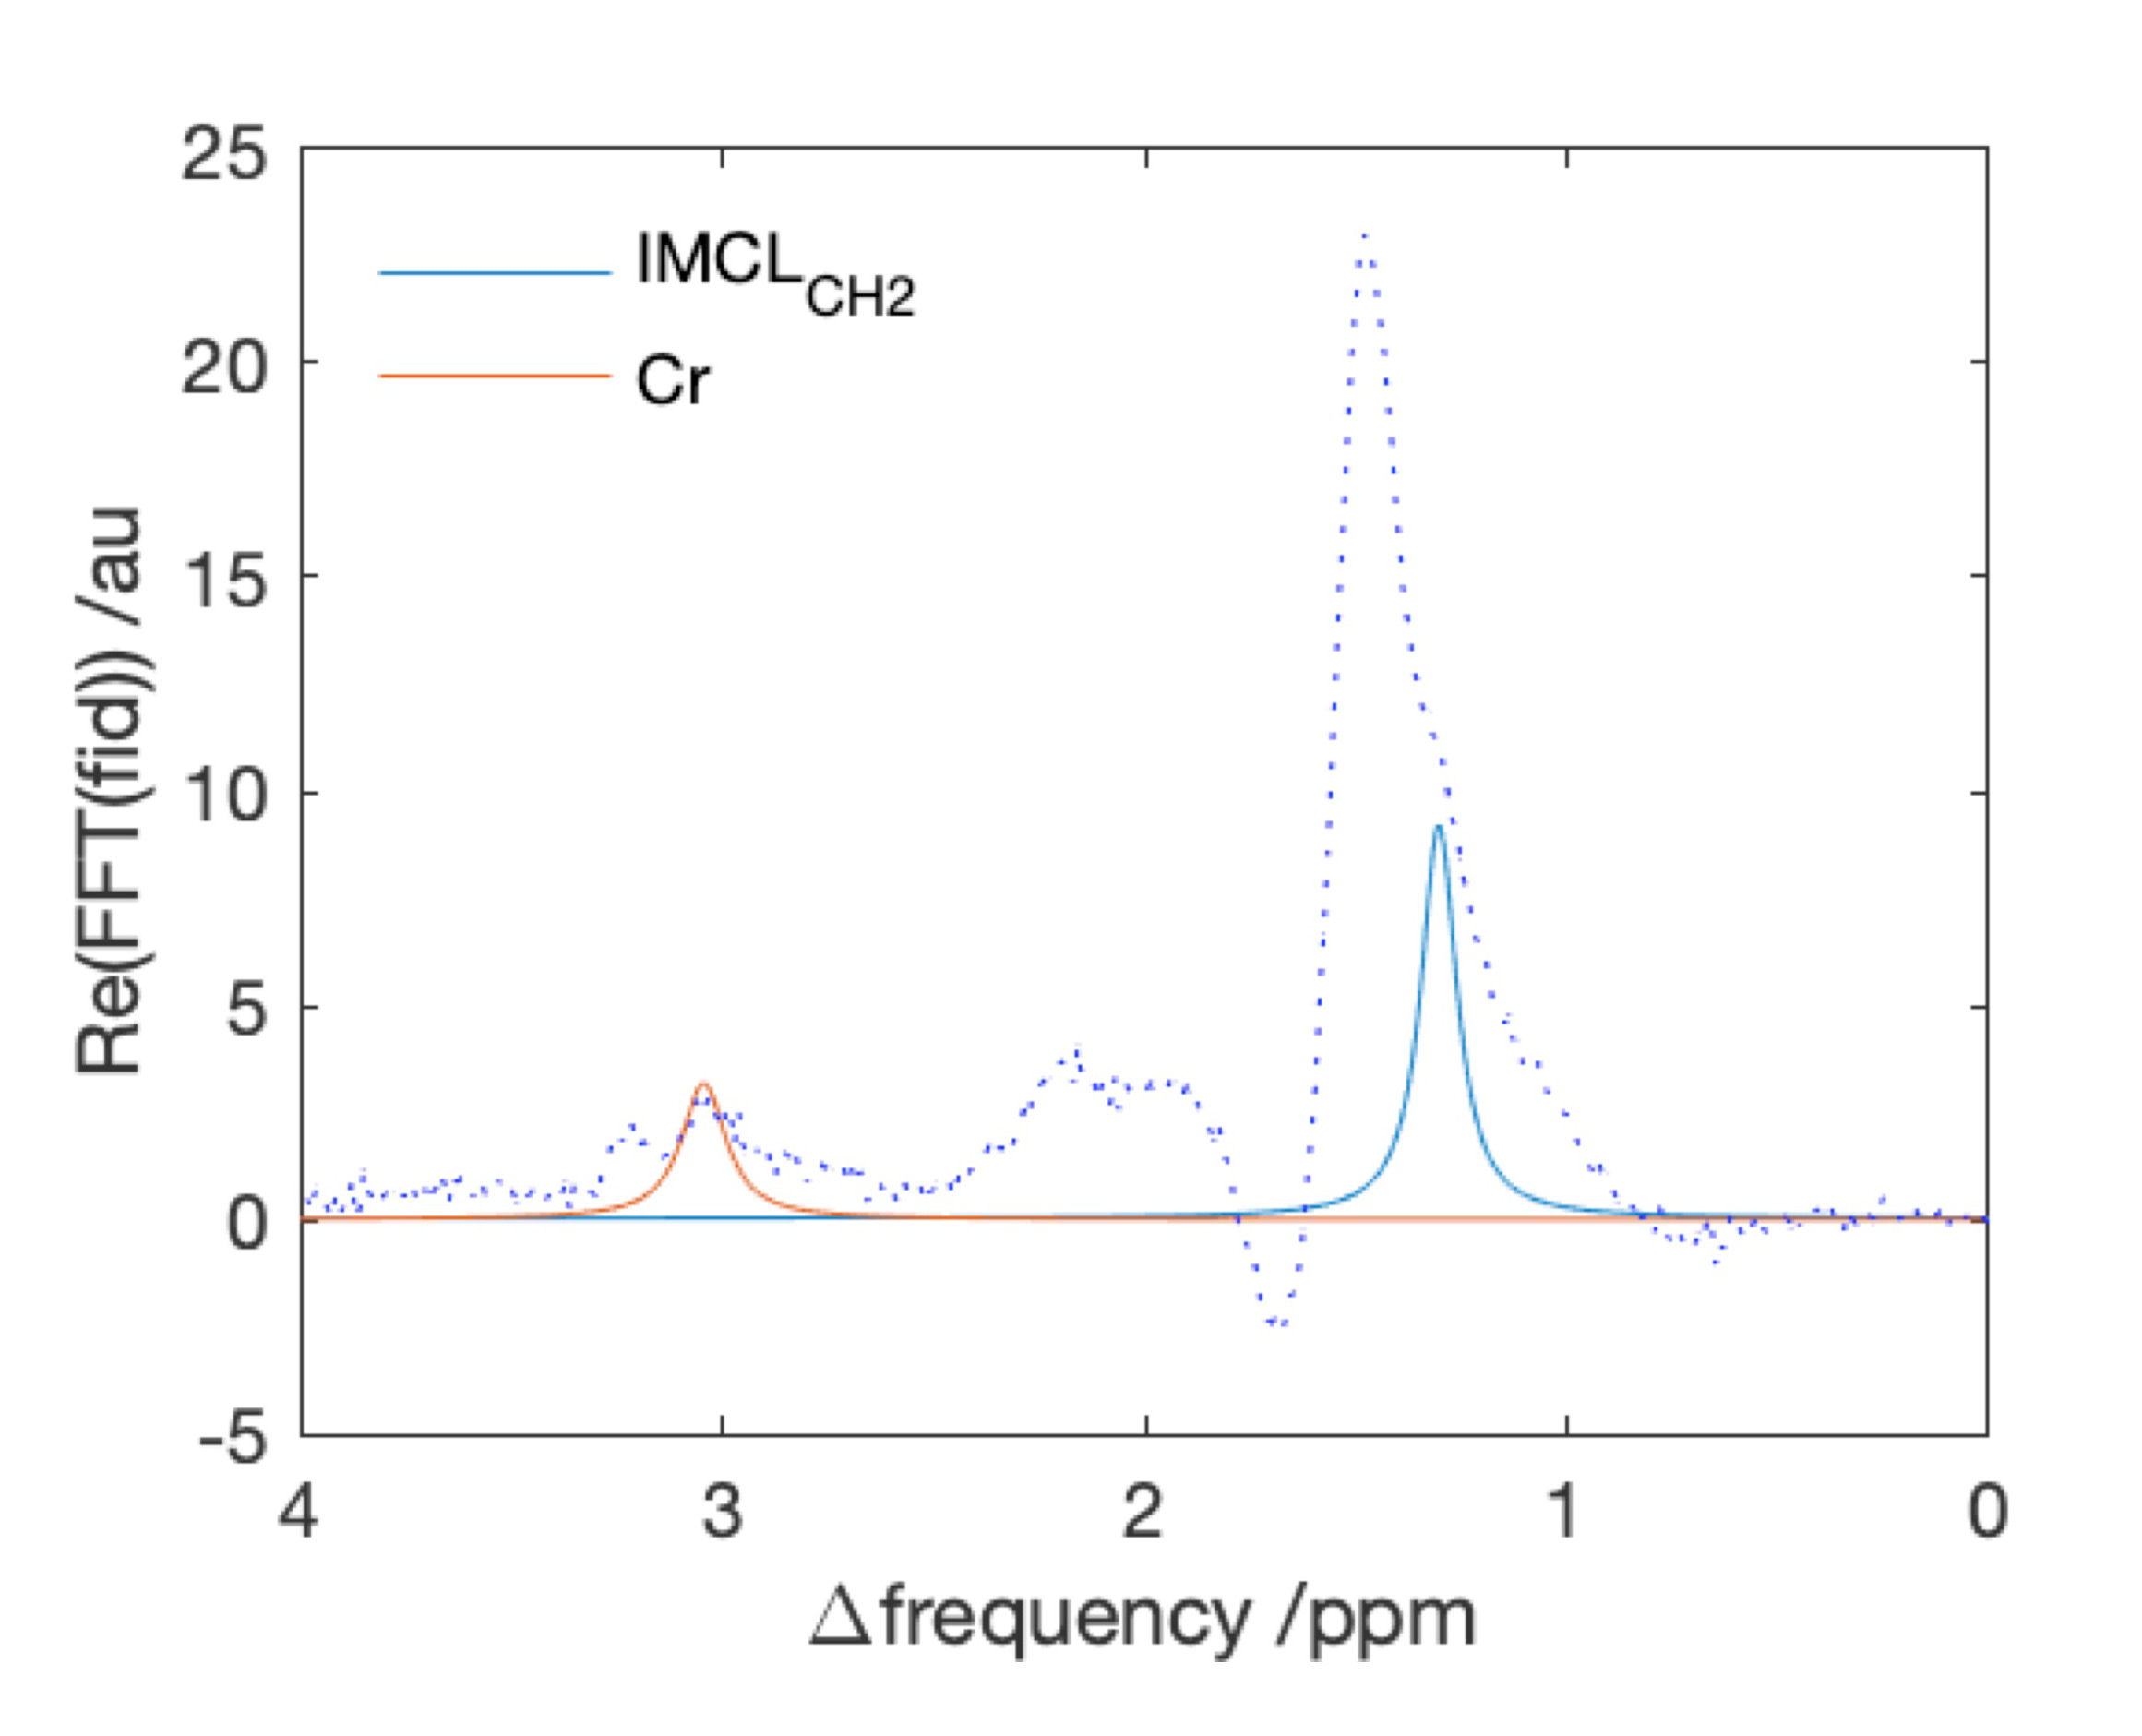
Figure 1. An example of the raw spectrum together with the fitted IMCLCH2 and Cr components. The large peak at 1.5ppm is the methylene extracellular lipid (EMCLCH2)