3181
MR analysis of thigh muscle myopathy using texture features and supervised machine learning
Hon J Yu1, Saya Horiuchi1,2, Toshimi Tando1, Vincent J Caiozzo3, Virginia E Kimonis4, and Hiroshi Yoshioka1
1Radiological Sciences, University of California, Irvine, Orange, CA, United States, 2Radiology, St. Luke's International Hospital, Tokyo, Japan, 3Department of Orthopaedics, Physiology & Biophysics, University of California, Irvine, Irvine, CA, United States, 4Division of Genetic and Genomic Medicine, Department of Pediatrics, University of California, Irvine, Irvine, CA, United States
1Radiological Sciences, University of California, Irvine, Orange, CA, United States, 2Radiology, St. Luke's International Hospital, Tokyo, Japan, 3Department of Orthopaedics, Physiology & Biophysics, University of California, Irvine, Irvine, CA, United States, 4Division of Genetic and Genomic Medicine, Department of Pediatrics, University of California, Irvine, Irvine, CA, United States
Synopsis
This study evaluates texture features to demonstrate their relationship with muscle classification based on a 5-grade scale and their value as classifier when trained in supervised machine-learning framework. The results suggest the texture features capture various image characteristics that are likely utilized during manual muscle classification by human being and can correctly predict with up to 81% accuracy when properly trained in supervised machine-learning setting. A further study with bigger data size would be necessary to fully examine such classification model and also to look into the possibility of selecting subset of features to make such an approach more practical.
Introduction
MRI is a pivotal imaging tool for diagnosis and monitoring progression of several inherited and acquired neuromuscular disorders, such as inclusion body myopathy associated with Paget and dementia and mutations in the VCP gene1, in both clinical and research setting. The use of MRI in such application, however, has been relatively qualitative in nature limited to visual assessment of chronic alterations such as fatty infiltration and muscle volume decrease. We recently evaluated fatty infiltration using semi-quantitative muscle classification and fat-fraction quantification based on MRI2. In this work, the value of texture features was investigated in relation to muscle classification and also in a supervised machine learning framework as predictive variables.Methods
The study protocol was approved by the institutional review board and all subjects gave written informed consent. Twelve subjects with varying degrees of myopathy (F/M:7/5; mean-age:50.3 yrs.; range:28-64 yrs.) and 8 healthy volunteers (F/M:5/8; mean-age:43.1 yrs.; range:27-65 yrs.) were included in the study. MRI studies were performed on a 3T scanner (Achieva, Philips Healthcare, Netherlands) using body-coil. T1w images of the thigh were acquired bilaterally in axial-orientation using 2D-TSE sequence with TR/TE=886/15 [ms], FOV/slice-thickness/gap=380/5/5 [mm], image-matrix=512x512, and number of slices=20-25. Nine muscle groups in each side of the thighs for a total of 18 muscle group from each subject were segmented manually and classified based on a 5-grade scale (Table 1) by an MSK radiologist, and also calculated for fat-fraction based on a 3-class fuzzy c-means (FCM) algorithm2 (Figure 1). Ten texture features were investigated: 2 first-order histogram based (Skewness and Kurtosis)3, and 8 gray-level co-occurrence matrix (GLCM) based (Angular-Second-Moment (ASM), Contrast, Correlation, Inverse-Different-Moment (IDM), Sum-Average, Sum-Variance, Entropy, and Difference-Variance)4. GLCM based texture parameters were first calculated based on the nearest-neighbors and each of the four available pixel-offset definition at 0°, 45°, 90°, and 135° and then averaged over the pixel-offset definitions for each texture parameter. One-way ANOVA with Tukey’s HSD post hoc test was used to determine the statistical differences of all quantitative parameters between different muscle grades. Linear discriminant analysis-based algorithm5 was utilized for supervised machine learning with 5-fold stratified cross validation to compute misclassification rate for performance evaluation. All analysis was done using custom scripts prepared in Matlab (MathWorks, Natick, USA).Results
Average values (±STD) of each of the texture parameters, including that of fat-fraction, were summarized for each of the muscle grades in Table 2. The averaged parameter values with similar scales were also plotted together to better visualize their trends as a function of muscle grades (Figure 2). Pairwise comparisons in each of the parameters yielded statistically significant differences between muscle groups (P < 0.01), except for the following parameters and grades: fat-fraction (grade-0 vs. 1), Skewness (grade-0 vs. 1 & grade-0 vs. 2), Kurtosis (grade-1 vs. 4 & grade-2 vs. 3), ASM (grade-2 vs. 3, grade-2 vs. 4, & grade-3 vs. 4), Correlation (grade-2 vs. 3), IDM (grade-2 vs. 3), Entropy (grade-2 vs. 3), and Difference-Variance (grade-2 vs. 3 & grade-2 vs. 4). Error rate of approximately 0.27 was the best that any single parameter could perform by itself in predicting muscle grades, which was achieved by both fat-fraction and Sum-Average. Interestingly, the error rate did not improve (at around 0.29) when those 2 parameters were trained together as classifiers. The least error rate was achieved at approximately 0.19 when all texture parameters were trained together as classifiers. When either fat-fraction or Sum-Average was left out as classifier, the error rate remained the same or increased slightly to 0.20, respectively; when both were left out, it increased to approximately 0.24.Discussion
Contrast, Sum-Average, and Sum-Variance demonstrated statistically significant group-average differences across all muscle grade pairs. However, only the group-average values of a single texture parameter, Sum-Average, showed a monotonic relation to muscle grades, similar to that of fat-fraction. This is not surprising for 2 factors. First, Sum-Average represents GLCM summation with progressively more bias toward those elements in the lower right-hand-side corner of GLCM, which represent occurrences of two nearest-neighboring pixels in the original image with increased signal intensity. Second, the 5-grade muscle classification is also primarily based on assessment of increased signal intensity in the original image, which is understood in the context of fatty infiltration into muscle. These factors also support the observation of similar performance between fat-fraction and Sum-Average when trained as a single classifier model for muscle grades, and why the classification error rate was not impacted as much when only one of them was left out as when both were left out as classifier. In fact, individual muscle groups’ Sum-Average values were found to be highly correlated to that of fat-fraction (r = 0.971; P < 0.00001) and appear to provide redundant information with respect to each other as classifier. Some of the image characteristics that were part of muscle classification criteria implicitly used by the radiologist but not directly related to increased signal intensity appear to be accounted by other texture features included in this study, as judged by the improved error rate when they are trained together as classifiers.Conclusion
Use of texture features combined with supervised machine learning is feasible and could provide an insight into and predict muscle classification by radiologist.Acknowledgements
No acknowledgement found.References
1. Watts GD, Wymer J, Kovach MJ, et al. Inclusion body myopathy associated with Paget disease of bone and frontotemporal dementia is caused by mutant valosin-containing protein. Nat Genet. 2004;36:377-381; 2. Horiuchi S, Yu HJ, Tando T, et al. Semi-qunatitative MR muscle analysis of VCP inclusion body myopathy. 27th Annual Meeting & Exhibition (ISMRM), Montreal, Canada; 3. Materka A, Strzelecki M. Texture Analysis Methods – A Review. Technical University of Lodz, Institute of Electronics, COST B11 report, Brussels 1998; 4. Haralick RM, Shanmugam K, Dinstein I. Texture Features for Image Classification. IEEE Trans Syst, Man, Cybernet 1973;3:610-621; 5. Fisher RA. The Use of Multiple Measurements in Taxonomic Problems. Annals of Eugenics. 1936;7:179-188.Figures
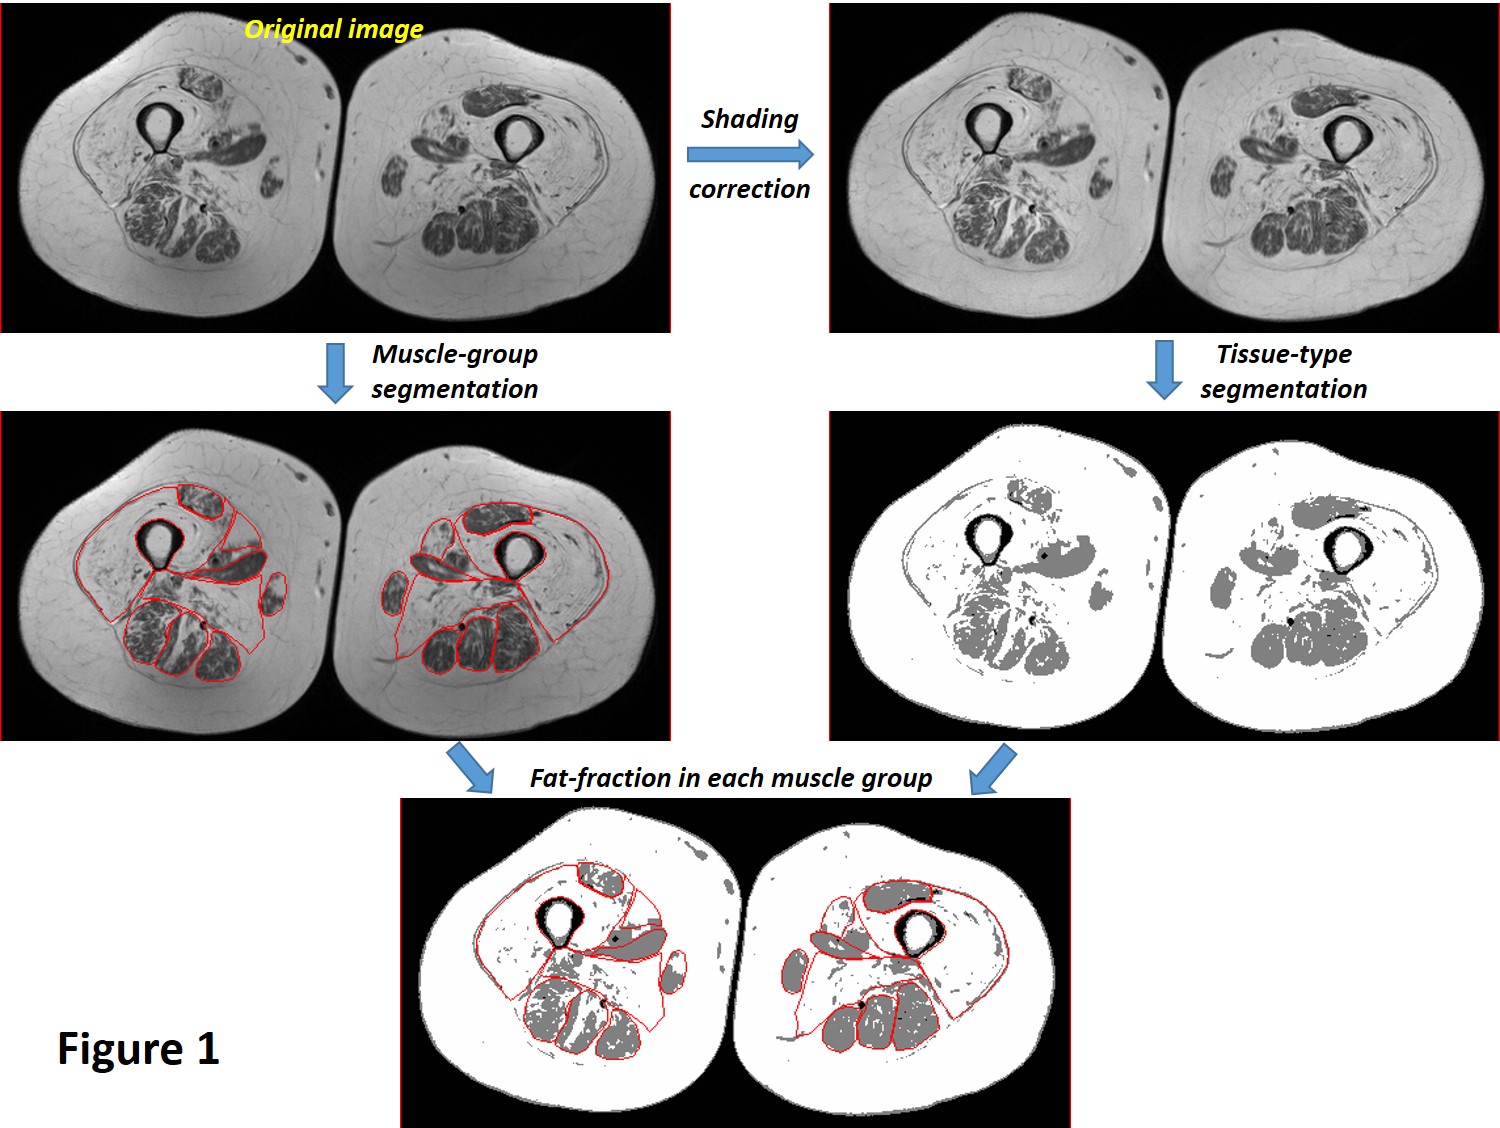
The
overall workflow of fat-fraction calculation that utilizes manual muscle
segmentation, shading/intensity-correction across FOV, and classification of
different tissue types based on a 3-class fuzzy c-means (FCM) algorithm.
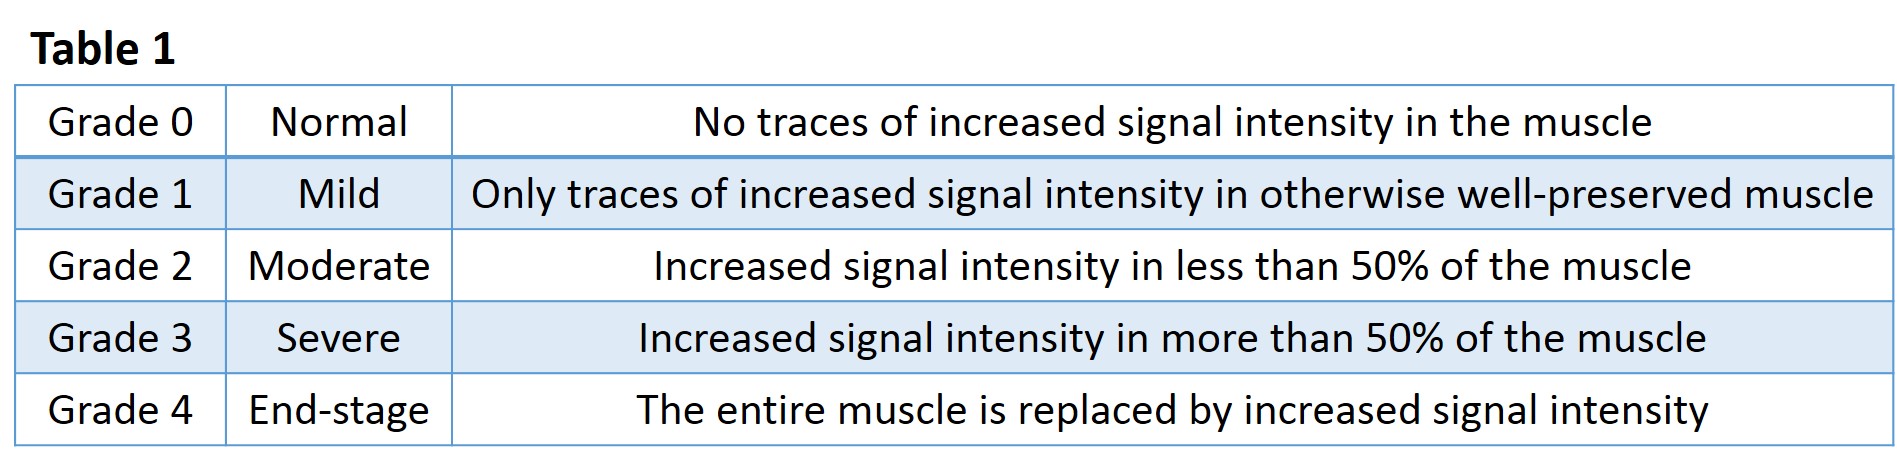
Semi-quantitative muscle classification based on a 5-grade
scale
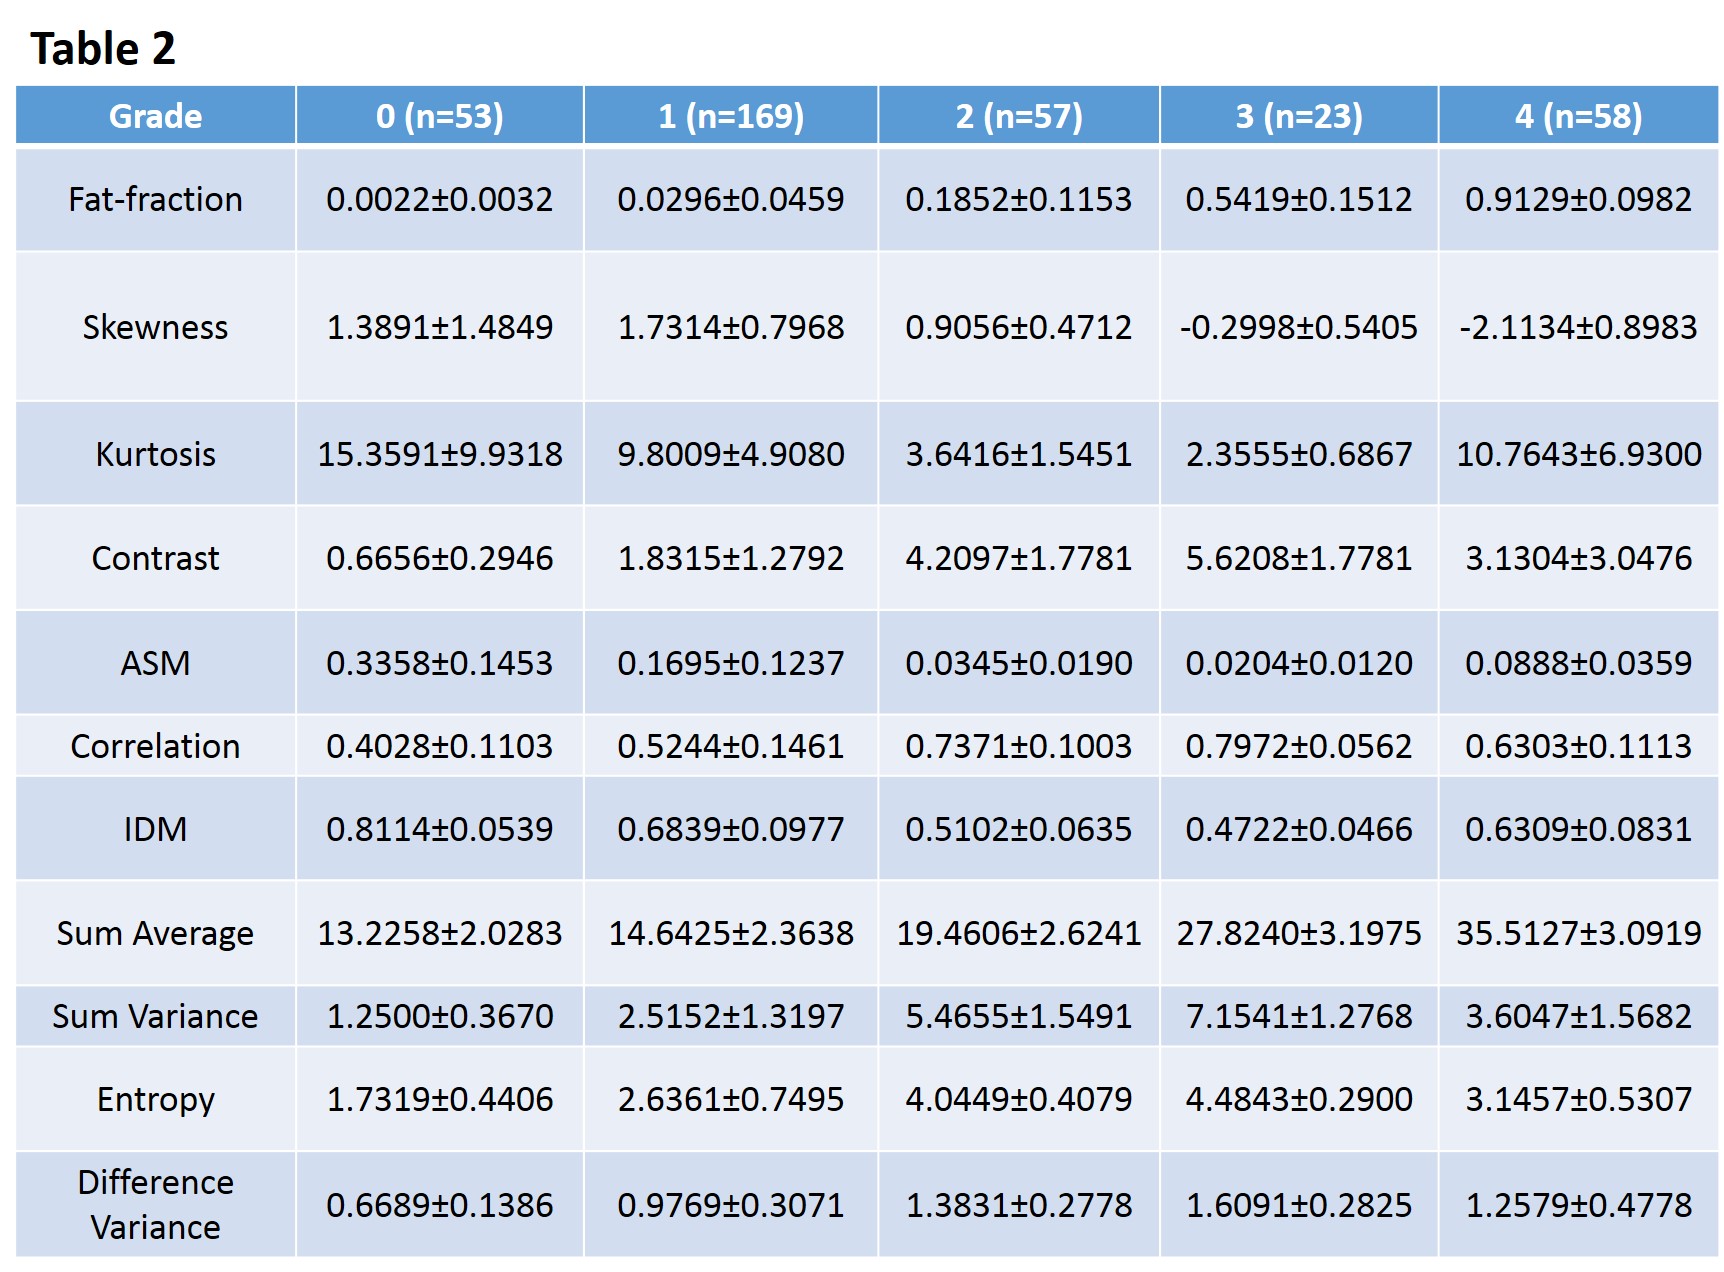
Group-mean (± STD) values of fat-fraction and texture
parameters of different muscle grades
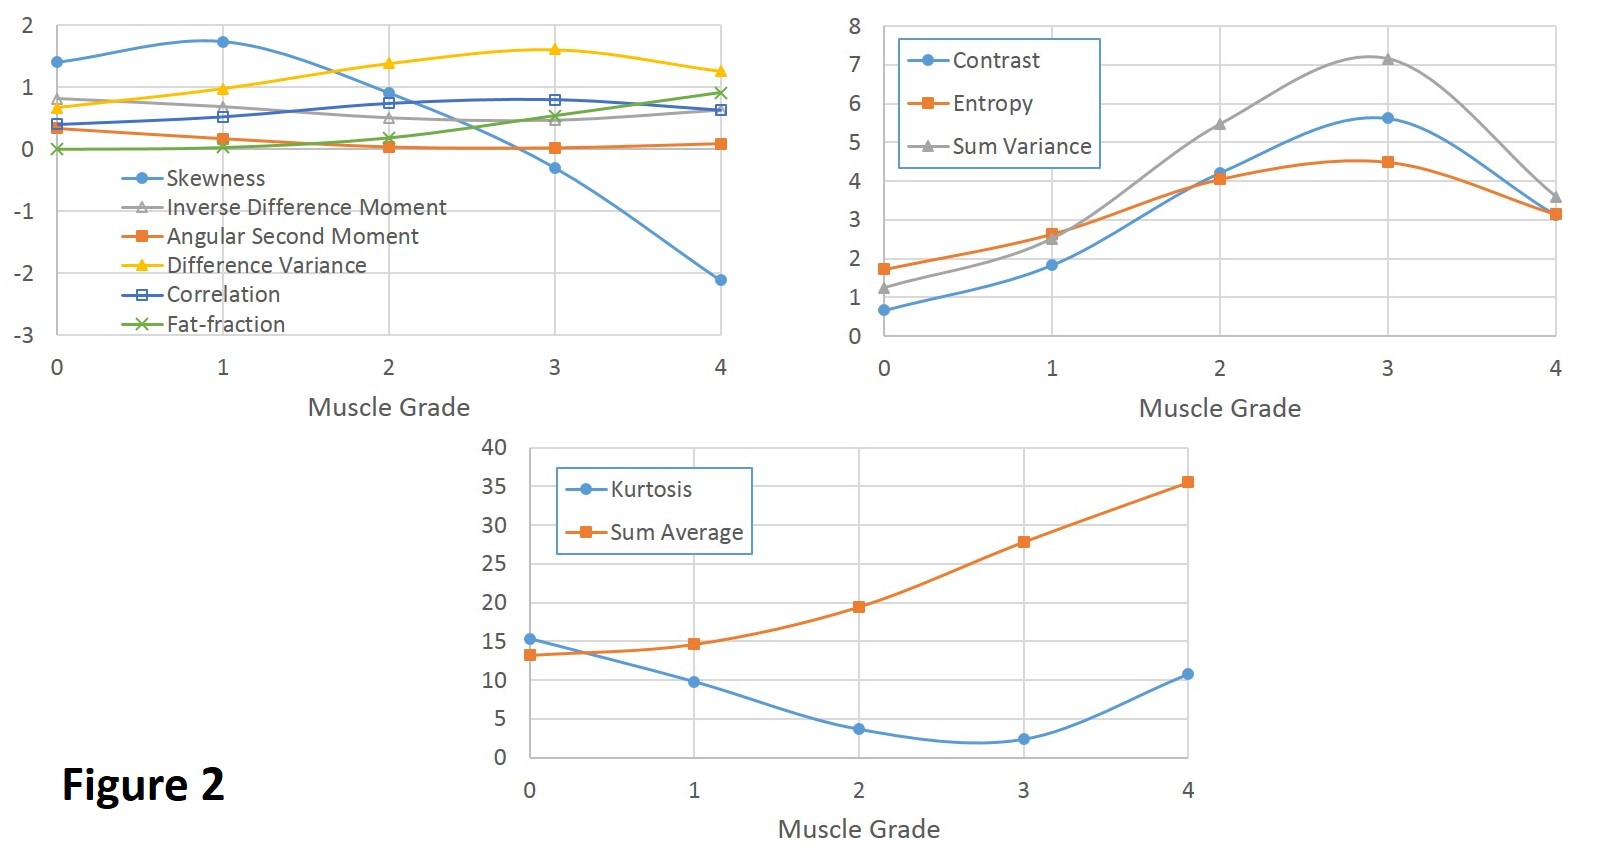
Plots
of group-averaged fat-fraction and texture parameter values with similar
vertical scales in order to better visualize their trends as a function of
muscle grades.