3177
IDEAL-CPMG muscle T2-water and Dixon Fat-Fraction Maps in People with Inclusion Body Myositis and Charcot-Marie-Tooth disease Type 1A1MRC Centre for Neuromuscular Diseases, UCL Queen Square Institute of Neurology, London, United Kingdom, 2Lysholm Department of Neuroradiology, National Hospital for Neurology and Neurosurgery, London, United Kingdom, 3Department of Pediatric Neurology and Radiology, Fondazione Policlinico Universitario, Rome, Italy, 4St Thomas Hospital, London, United Kingdom
Synopsis
Muscle T2 and fat-fraction are two promising metrics for sensitive measures of early disease-related changes in muscle for use in clinical trials. However, fat has a longer T2 than water in muscle and masks underlying increases in water T2 due to muscle oedema. The IDEAL-CPMG sequence with appropriate image-data processing produces a T2-water map uncontaminated by the fat signal. This sequence was acquired in healthy volunteers and two different muscular dystrophy disease types. It was found that elevated T2-water may be a predictor of later progression to fatty-atrophy in muscle, supporting the value of future longitudinal studies to test this.
Introduction
Muscle oedema and fat infiltration are characteristics of a range of neuromuscular diseases. Novel therapies for these conditions could be expedited if more sensitive measures of early disease-related changes in muscle could be found for use in clinical trials. The disease processes involve changes in intramuscular water and fat distributions; muscle T2 and fat-fraction are two promising metrics. Conventional multi-echo T2 mapping of the gluteus maximus muscle has been shown to be a quantitative and objective measure of disease severity in boys with Duchenne’s Muscular Dystrophy (DMD)1.The IDEAL‐CPMG pulse sequence2 combines IDEAL fat–water chemical shift separation with CPMG multi‐echo spin‐echo measurement of T2, and hence yields separate measurements of the T2 of water and fat in a single acquisition. Fat has a longer T2 than water in muscle and conventional MRI relaxometry masks any underlying increases in water T2 due to muscle oedema. The IDEAL-CPMG sequence with appropriate image-data processing produces a T2-water map uncontaminated by the fat signal.
The IDEAL-CPMG sequence has been previously validated in phantoms, and used in healthy volunteers, boys with DMD3, hypokalemic periodic paralysis4 and showed muscle-specific patterns of fat infiltration and oedema in a single participant with Inclusion Body Myositis (IBM)2. We extend this work with data from two participant groups, one with IBM and a second with the inherited neuropathy Charcot-Marie-Tooth disease Type 1A (CMT1A), to examine the potential of IDEAL-CPMG in monitoring large patient cohorts in longitudinal clinical trials. IBM is a primary muscle disease causing inflammation and damage in active areas, resulting in final fat replacement and atrophy of the muscle; whereas in CMT1A disease, atrophy and fat infiltration are sequelae of muscle denervation. The differing causes and disease progression present two different pathological patterns on MRI. We present here IDEAL-CPMG T2-water maps with comparison to standard Dixon Fat Fraction (Dixon-FF%) maps in these two diseases.
Methods
These data were acquired in the context of a five-year longitudinal observational study, where the participant assessment, recruitment and inclusion criteria has been previously described in Morrow et al5. Eight participants with IBM (8 male, 68.0±5.7 years, range 61.8-80.3 years), nine participants with CMT1A (4 male, 47.2±15.2 years, range 24.2-71.5 years) and nine healthy volunteers (HV) with no known muscle pathology (6 male, 57.8±14.3 years, range 25.4-73.9 years) were scanned with the IDEAL-CPMG sequence at a single timepoint within the larger study.Image acquisition included IDEAL-CMPG2 (16 echoes, first echo 12ms, 12ms increments, TR 3000ms, 2.1x2.1mm pixel size, 5mm slice thickness) and 3-point Dixon6 (TE 3.45, 4.6, 5.75ms, TR 100ms, 4 averages, 0.8x0.8mm pixel size, 10mm slice thickness). The IDEAL-CMPG data were processed using an in-house MATLAB (https://uk.mathworks.com/products/matlab.html) script as detailed in Janiczek et al.2. 3-point Dixon data were processed using an in-house Python (http://www.python.org) script based on Glover et al.7. A trained observer manually segmented the calf muscles on the shortest echo time (TE = 3.45ms) high-resolution gradient-echo image using the ITK‐SNAP (http://www.itksnap.org) software. These regions-of-interest (ROIs) were transformed into the space of the IDEAL-CPMG images using FSL (https://fsl.fmrib.ox.ac.uk/fsl/fslwiki/) and overlaid on T2-water and Dixon-FF% maps for data extraction.
Results and Discussion
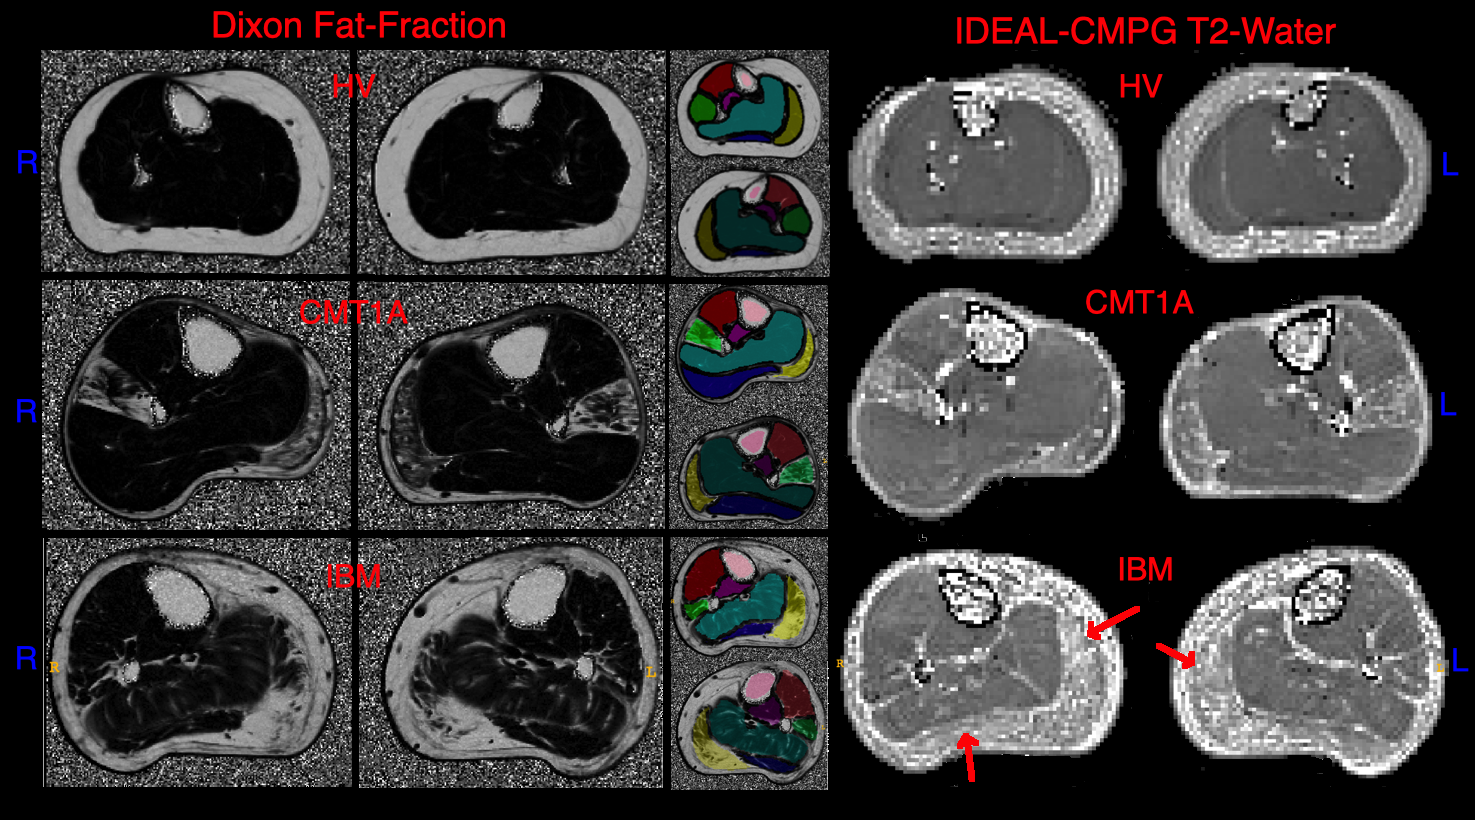
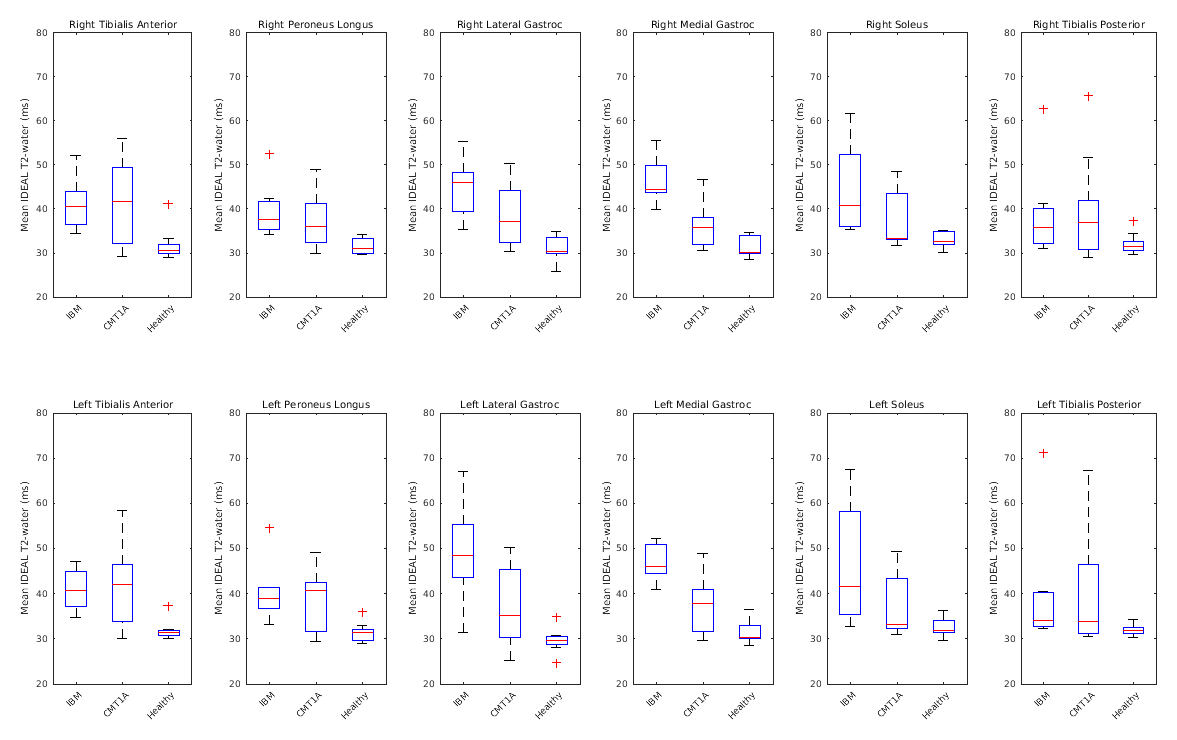
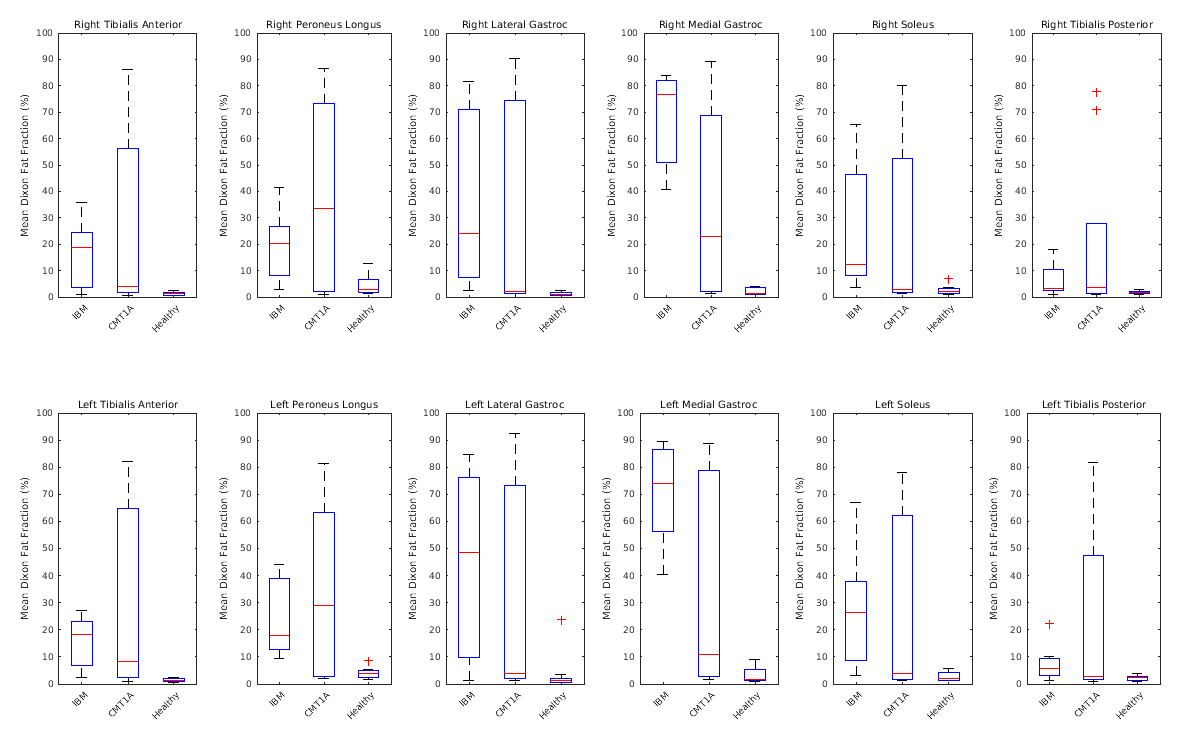
Figure 1 shows example T2-water and Dixon-FF% images in a HV, a person with CMT1A and a person with IBM. The ROIs are shown in colour in the centre. The HV shows maps uniform in the muscle as expected. The person with CMT1A has corresponding pathological changes in the Dixon-FF% and T2-water maps, but the person with IBM shows increased T2-water in areas (red arrows) that do not have corresponding increases in the Dixon-FF%, due to inflammation and active disease in these areas.Figure 2 shows the T2-water results for each muscle group in the calf separated for IBM, CMT1A and HV. There was a narrow normal T2-water range for all HV across all muscle groups centred on 31.7ms (SD±2.4). At the group level, elevated T2-water was seen with anatomical distributions differing between the two patient groups but consistently higher in the IBM patients. Four of the nine CMT1A subjects had no discernible fat infiltration on the Dixon images and no corresponding increase in T2-water, contributing to the larger spread of values in the CMT1A group. Figure 3 shows the corresponding Dixon-FF% results for comparison.
Conclusion
Quantitative IDEAL-CPMG T2-water maps were successfully obtained in all participants. T2-water maps showed raised signal in areas of oedema, and in 2 participants with IBM there was evidence of increased T2-water with no marked fat-fraction increase. This suggests that elevated T2-water may be a predictor of later progression to fatty-atrophy in IBM, supporting the value of future longitudinal studies to test this hypothesis. As IBM has a greater inflammatory component to the disease than CMT1A, this predictor may not be seen in CMT1A, but this would require investigation in a larger cohort. Alternative sequences such as fat suppressed T2w-STIR may not be as sensitive to changes in muscle water load, as the contrast involves both muscle hypointensity due to fat infiltration and hyperintensity due to elevated T2 value, which may tend to cancel. Quantitative T2 mapping with water-fat separated methods such as IDEAL-CPMG provides objective measures for comparison with normative data and longitudinally over several time points.Acknowledgements
This work was supported by the MRC (grant numbers G0601943 2008–2013 and MR/K000608/1 2013–2018). We gratefully acknowledge the capital and research support of the NIHR University College London Hospitals Biomedical Research Centre (2008–2013 and 2013–2018). We thank patient organisations including CMT UK and the Myositis Support Group who made patients aware of this study. We thank all patients who took part in this study.References
1. Kim HK, Laor T, Horn PS, Racadio JM, Wong B, Dardzinski BJ. T2 mapping in Duchenne muscular dystrophy: distribution of disease activity and correlation with clinical assessments. Radiology. 2010;255(3):899-908.
2. Janiczek RL, Gambarota G, Sinclair CD, et al. Simultaneous T(2) and lipid quantitation using IDEAL-CPMG. Magnetic resonance in medicine. 2011;66(5):1293-1302.
3. Mankodi A, Azzabou N, Bulea T, et al. Skeletal muscle water T2 as a biomarker of disease status and exercise effects in patients with Duchenne muscular dystrophy. Neuromuscul Disord. 2017;27(8):705-714.
4. Sinclair CD, Morrow JM, Janiczek RL, et al. Stability and sensitivity of water T2 obtained with IDEAL-CPMG in healthy and fat-infiltrated skeletal muscle. NMR in biomedicine. 2016;29(12):1800-1812.
5. Morrow JM, Sinclair CD, Fischmann A, et al. MRI biomarker assessment of neuromuscular disease progression: a prospective observational cohort study. Lancet neurology. 2016;15(1):65-77.
6. Burakiewicz J, Sinclair CDJ, Fischer D, Walter GA, Kan HE, Hollingsworth KG. Quantifying fat replacement of muscle by quantitative MRI in muscular dystrophy. Journal of neurology. 2017;264(10):2053-2067.
7. Glover GH, Schneider E. Three-point Dixon technique for true water/fat decomposition with B0 inhomogeneity correction. Magnetic resonance in medicine. 1991;18(2):371-383.
Figures