3175
Elliptical filter optimization for HARP based strain quantification in skeletal muscle1Department of Radiology & Nuclear Medicine, Amsterdam Movement Sciences, Amsterdam UMC, Location AMC, Amsterdam, Netherlands, 2Vanderbilt University Institute of Imaging Science, Nashville, TN, United States, 3Vanderbilt University Institute of Imaging Sciences, Nashville, TN, United States, 4Department of Biomedical Engineering, Vanderbilt University Medical Center, Nashville, TN, United States, 5Department of Radiology & Radiological Sciences, Vanderbilt University Medical Center, Nashville, TN, United States, 6Department of Molecular Physiology & Biophysics, Vanderbilt University Medical Center, Nashville, TN, United States
Synopsis
SPAMM, combined with HARP, is primarily used for strain quantification in the myocardium; but applications in other soft tissues, including skeletal muscle, are increasing. HARP suffers from artifacts due to usage of inappropriate filters and should therefore be optimized especially for skeletal muscle. We simulated strains ranging from -0.156 to +0.156 (decimal strain) in dynamically acquired line- and grid-tagged SPAMM images, and optimized elliptical filter parameters were determined for skeletal muscle. With this filter, differences between the measured strain and absolute strain were small for the low strain values and increased with the actual strain values and number of dynamics.
Introduction
Spatial Modulation of Magnetization (SPAMM) is used to measure strain in soft tissues including the myocardium and skeletal muscle1-3. In skeletal muscle, SPAMM has been used to gain understanding in muscle mechanics by measuring strain in relation to architectural features4,5. Various analysis approaches exist for SPAMM MRI, including template matching, active geometry and Harmonic Phase (HARP)6-8. In HARP, magnitude images are Fourier-transformed and the first harmonic peak is isolated using a filter. Strain maps obtained using HARP can suffer from artifacts due to phase unwrapping, image noise, low tag contrast and interference from neighboring spectral peaks9-10. Consequently, an essential aspect for accurate strain quantification using HARP is the selection of an appropriate filter to isolate the first harmonic peak from the central peak in k-space, as unsuitable filters will influence the deformation information. A variety of filters exits for this interference reduction, including Band-pass filters, Gabor filter banks and elliptical filters11-13. In this study, we determined optimal elliptical filter parameters to minimize strain errors in skeletal muscle by simulating strain in SPAMM images.Methods
MR data were acquired in the right lower leg of 5 healthy participants (age: 24.2 ± 1.1years) on a 3T MRI system (Philips, Best, the Netherlands) using a 16-channel receive coil and 10-channel table top coil. Resting SPAMM images (2D; FE-EPI; TR/TE 250/27ms; FA 20°; tag spacing 7mm; FOV 192x192x7mm, 20 dynamics) were acquired in both the axial (grid profile) and sagittal planes (line profile).Data-analysis
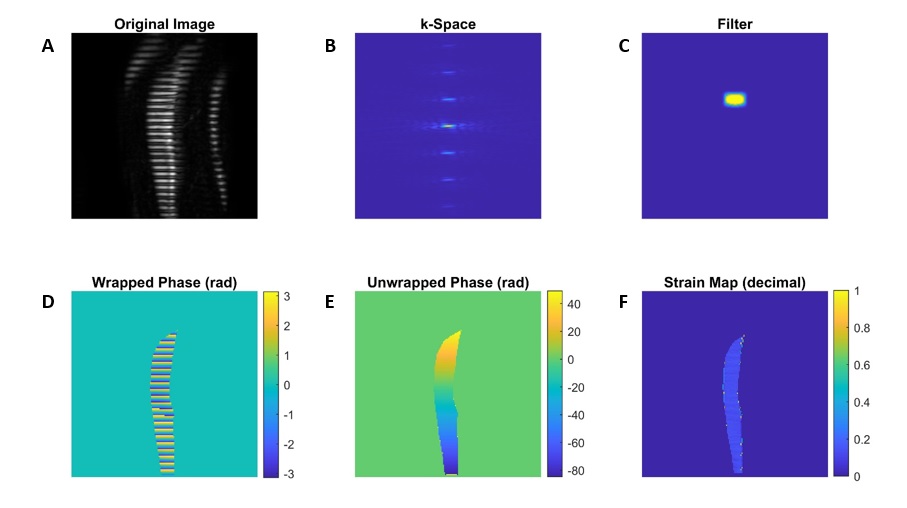
Post-processing was performed using MATLAB (The Mathworks, Inc., Natick, MA) in two steps: 1) Strain simulation and 2) Strain quantification using HARP. Strain was simulated by resizing the SPAMM images in the direction of the tags. Four different resize levels were used, including both positive and negative decimal strain values ranging from -0.156 to +0.156. Strain quantification is illustrated in Figure 1. The magnitude image (A) was Fourier Transformed (FT; B); an elliptical filter (C) was created and multiplied by k-space. An inverse FT was taken of the modified k-space to generate magnitude and phase images (D). The phase data were unwrapped (E) and the gradient, dφ/dx is measured. Strain was measured using HARP as 1 – dφRS/dx/dφ/dx, where the subscript RS indicates the resized image. For each strain level the analysis was repeated for varying elliptical filter sizes (4 filter widths, heights and Gaussian Variances; all had units of pixels); all combinations were tested. The error between observed strain and actual strain was used to assess the performance of each of the filter parameters. A factorial analysis was performed to determine the optimal filter settings for strain quantification in skeletal muscle for all directions and all strain values (positive and negative together). Lastly the filter’s performance was assessed by comparing the measured strain with the actual strain values for all dynamics.Results
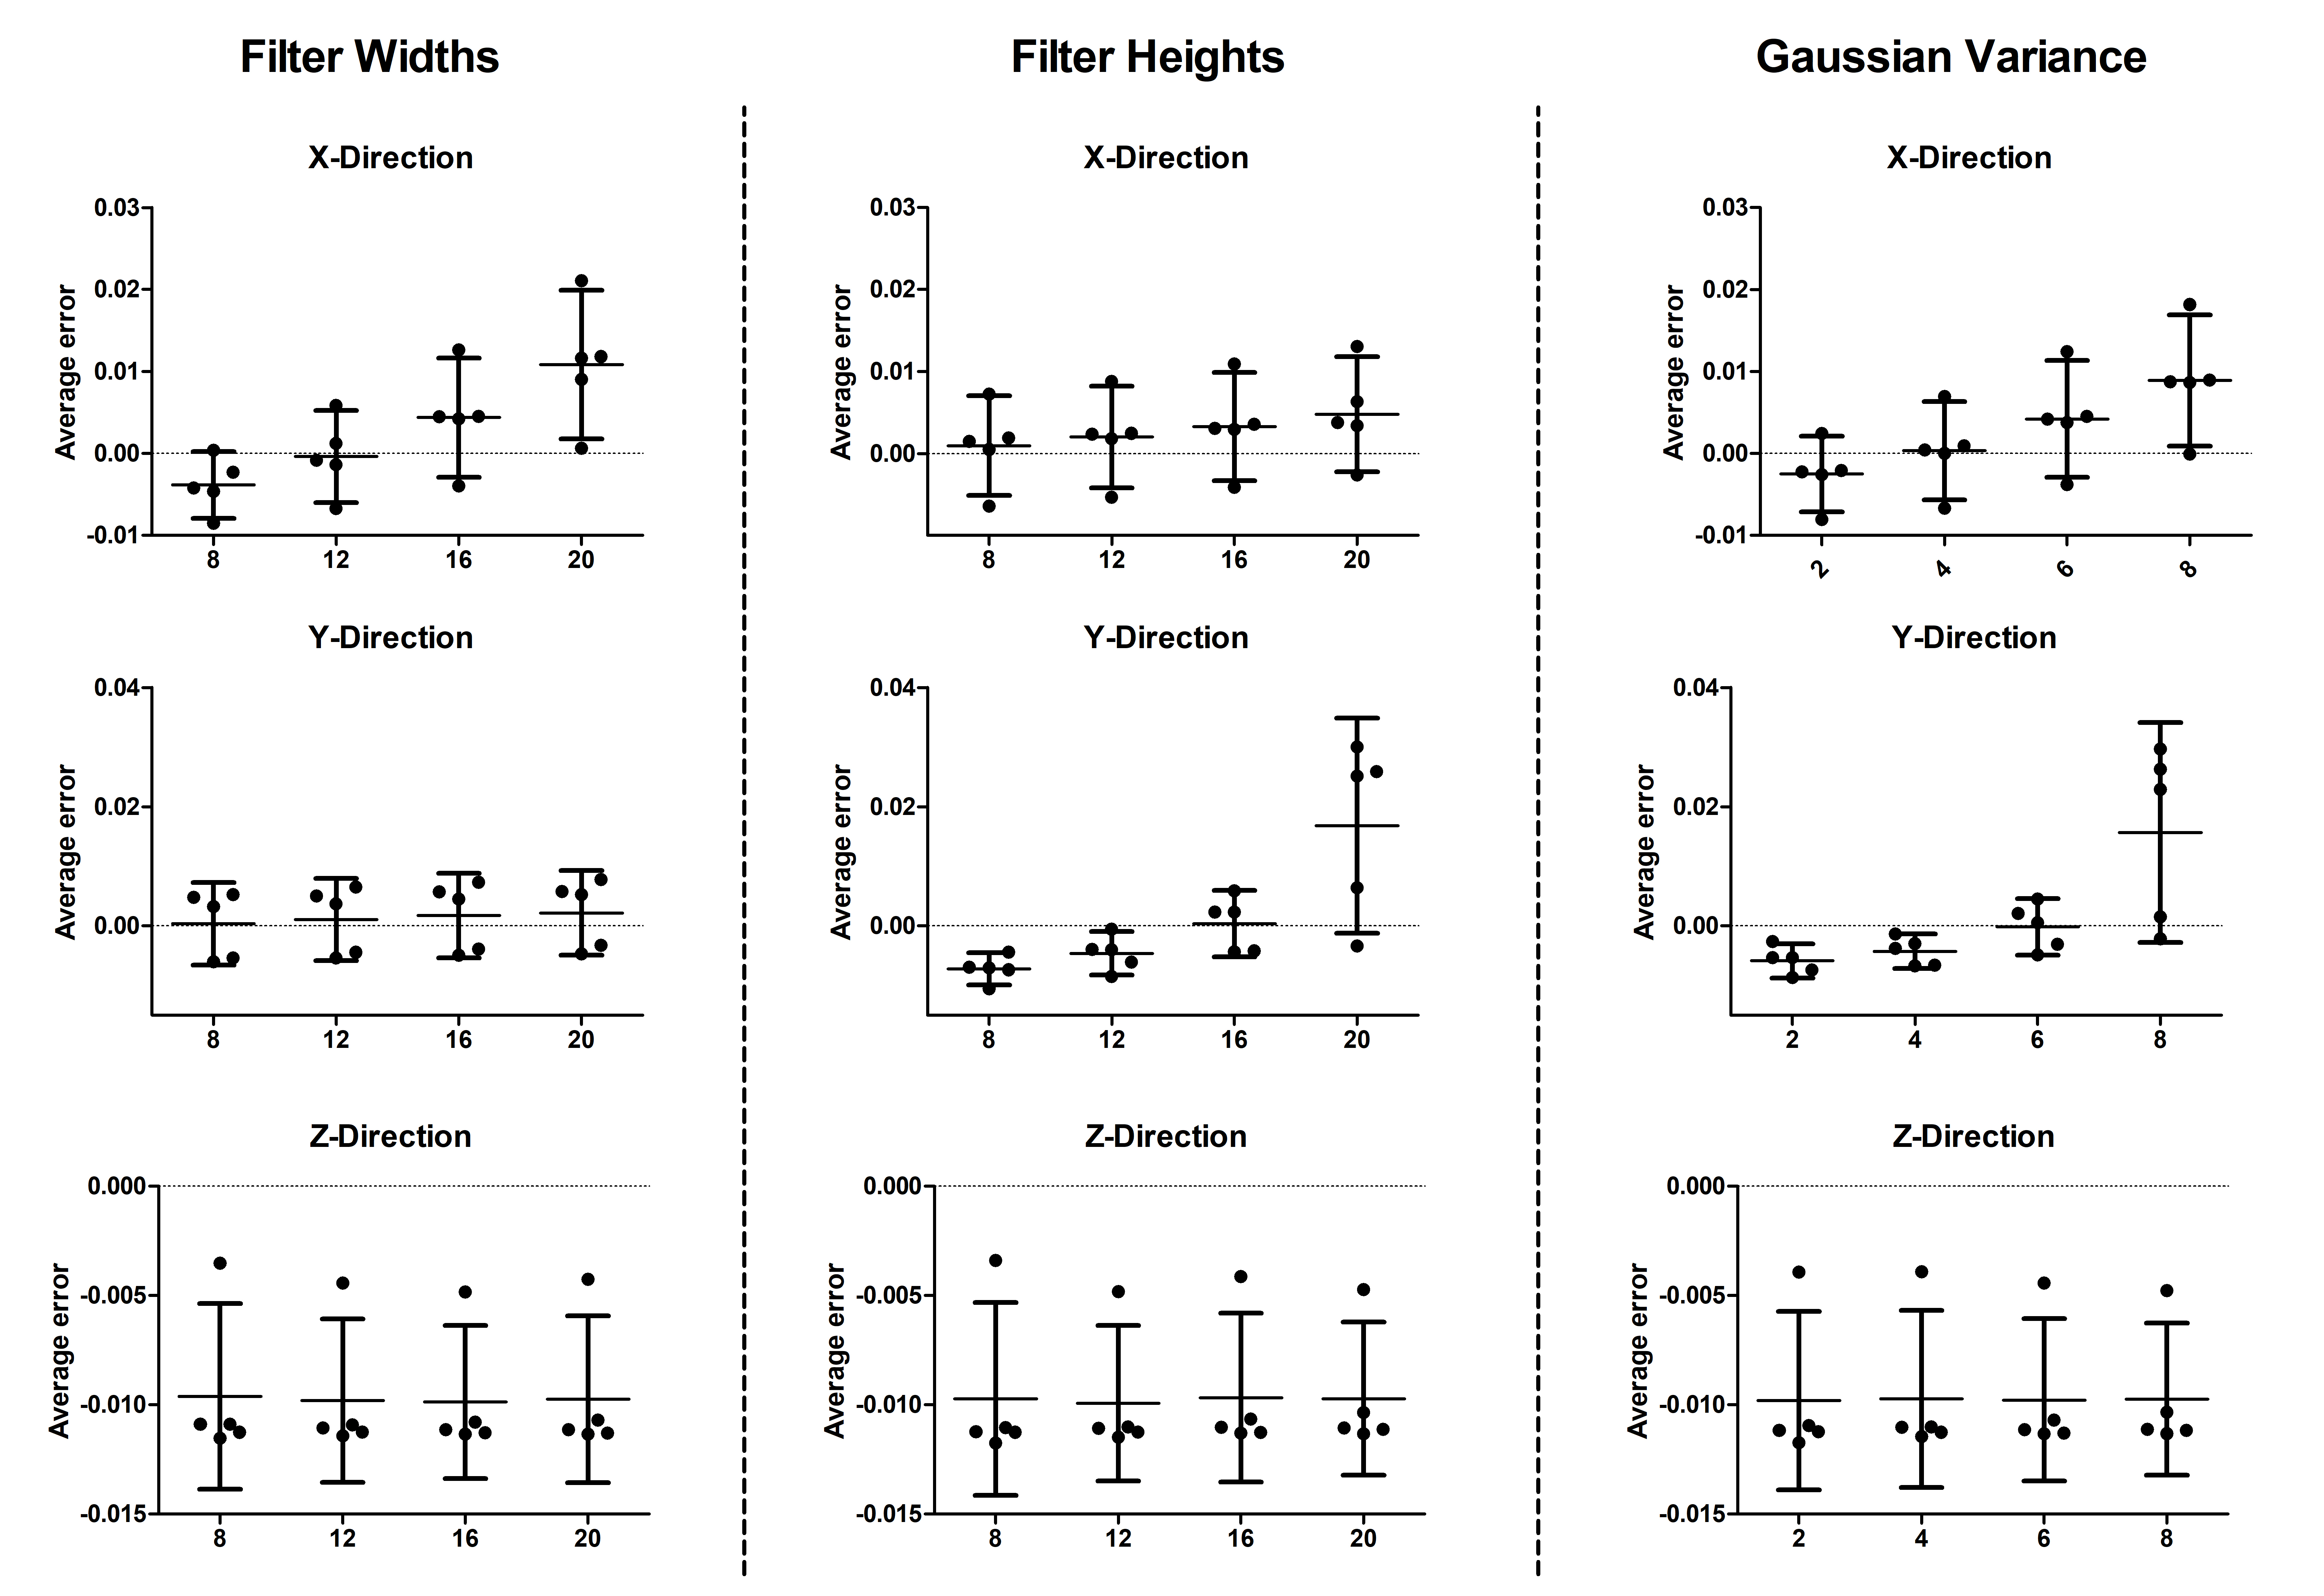
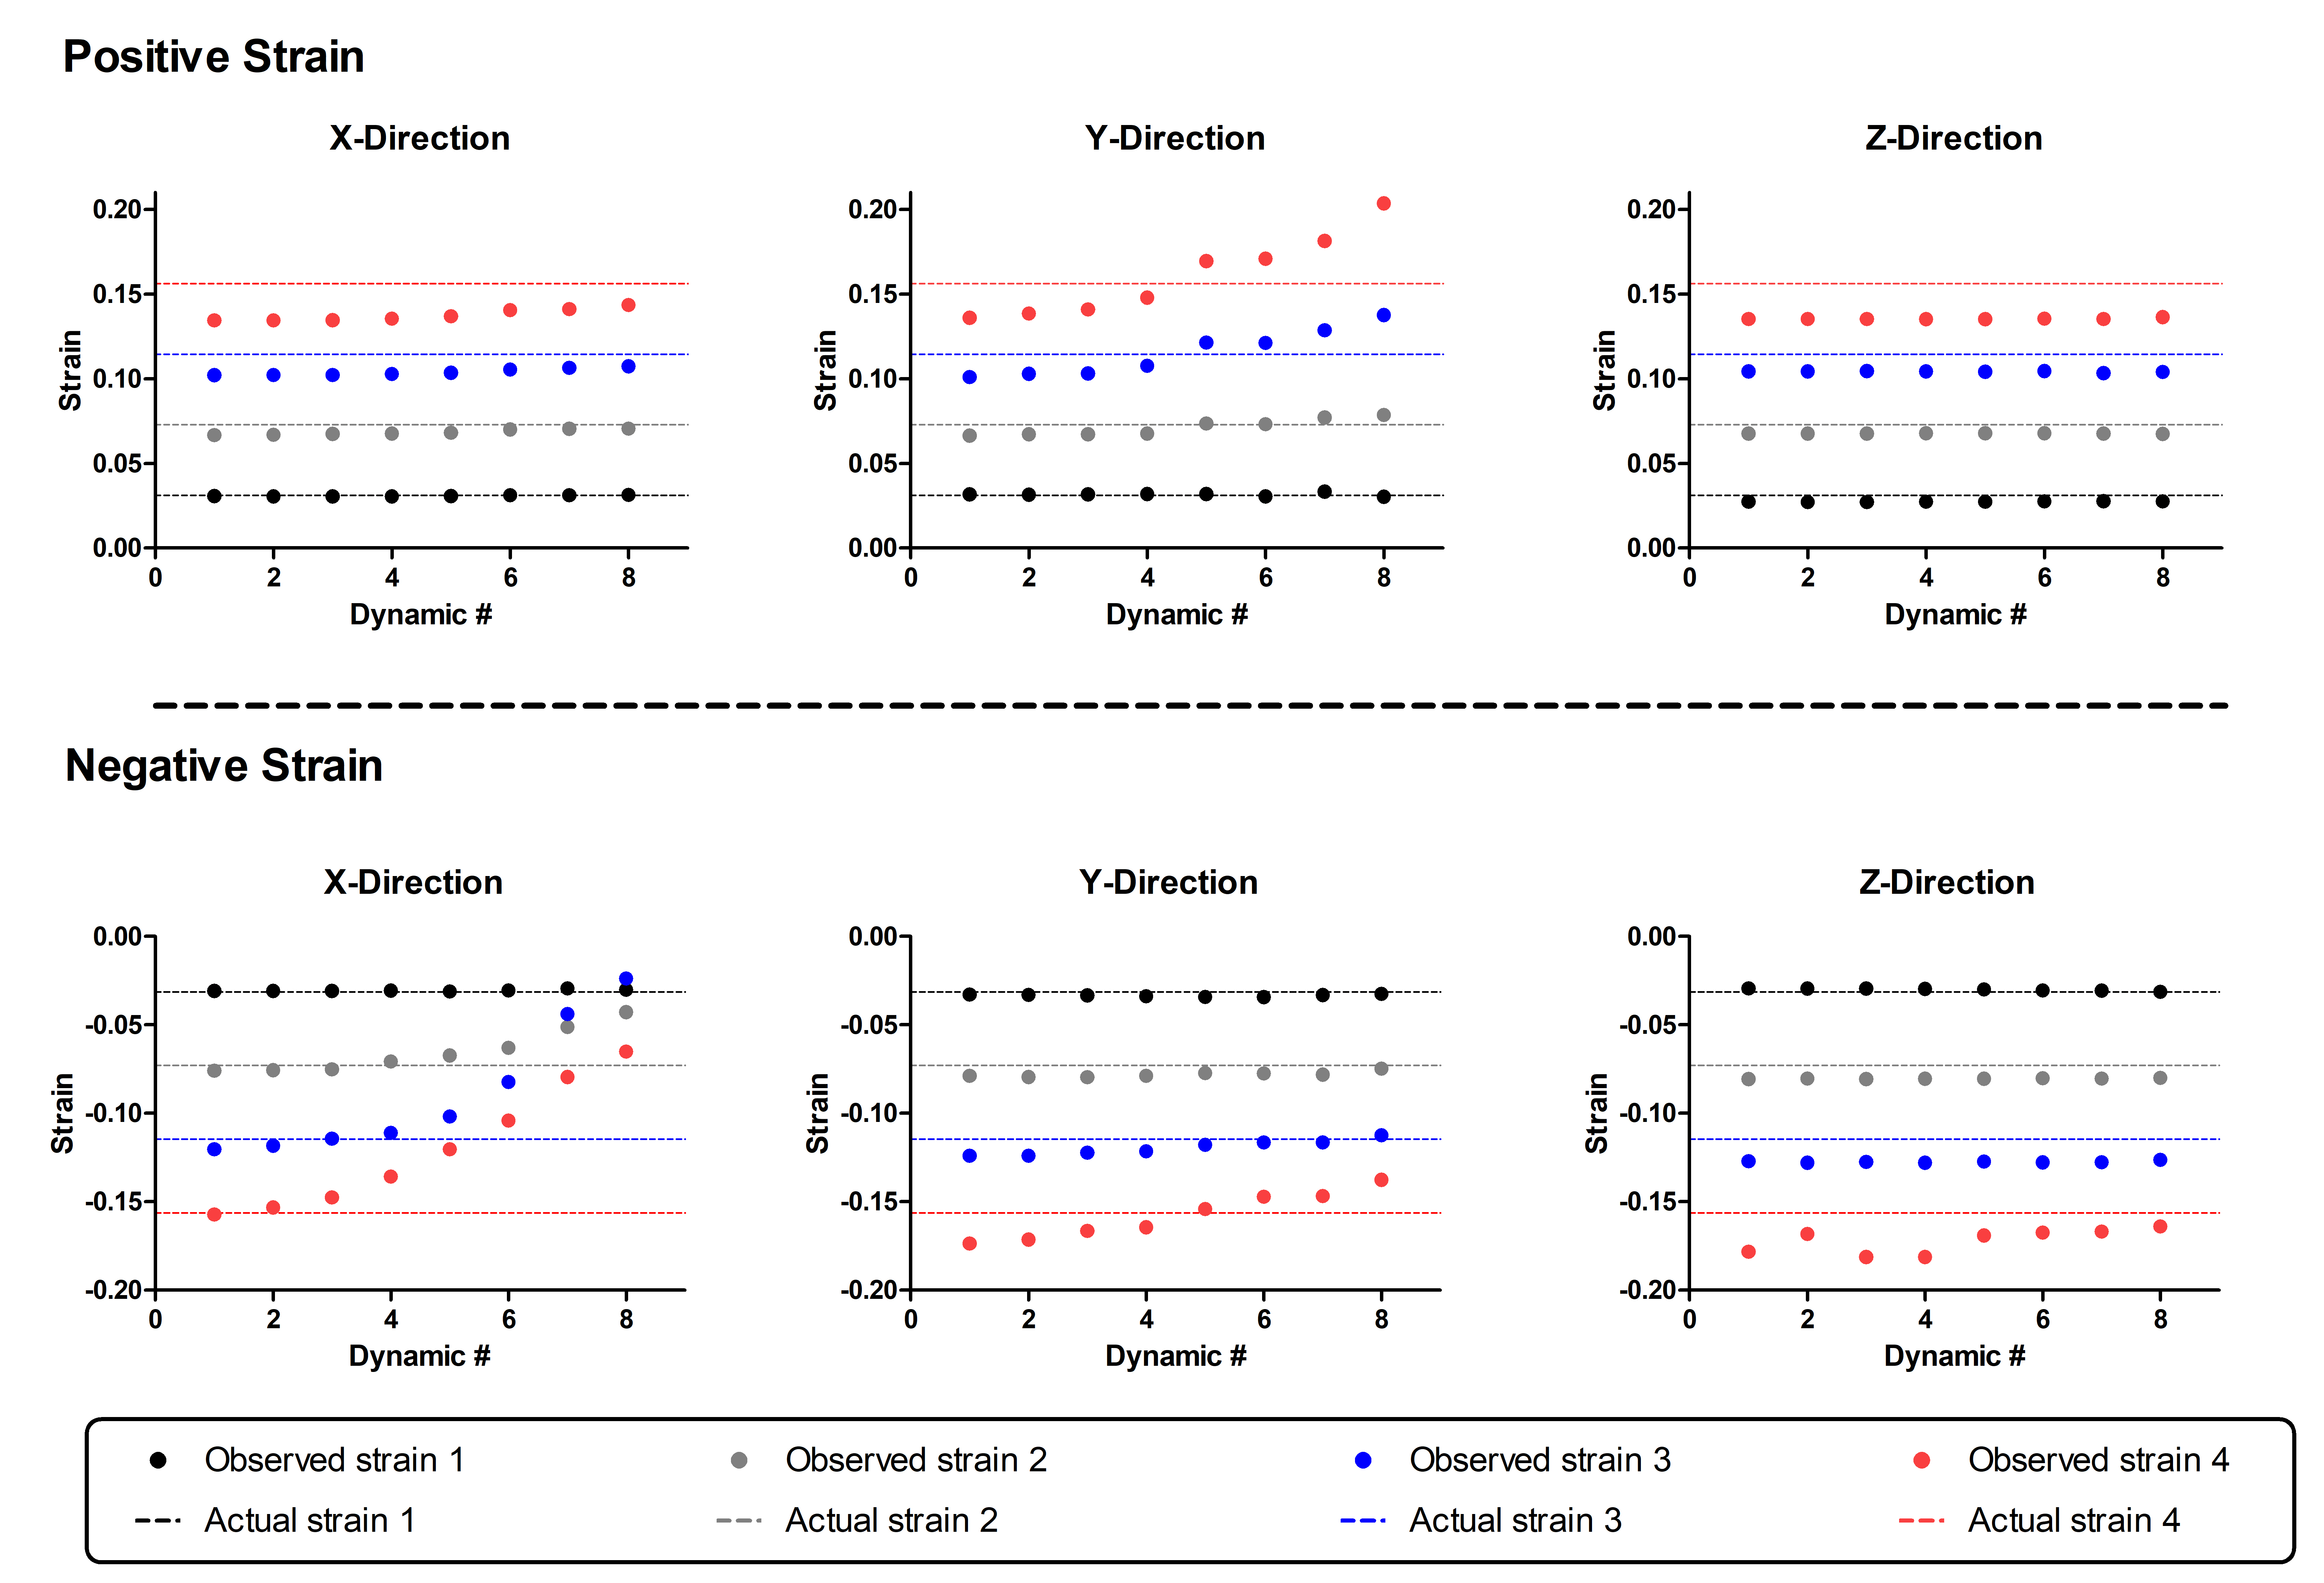
The optimal filter parameters varied for the directions (Figure 2). For the X-direction, the smallest average error was seen using radii of 12 pixels wide and eight pixels high, with a Gaussian Variance of four. In the Y-direction, radii of four pixels wide and 16 pixels high with a Gaussian Variance of six generated the smallest average error. For the Z-Direction the average error was essentially insensitive to the filter parameters. Over the first five dynamics and for all strain values, the optimal filter had radii of 12 pixels and a Gaussian variance of four. Using these filter parameters, differences between the measured strain and absolute strain were small for the low strain values and increased with actual strain values (Figure 3). The difference between measured and actual strain increased with the number of dynamics. The largest difference between actual and measured strain occurred for negative strain in the X-direction and positive strain in the Y-Direction.Discussion
We simulated strain in resting SPAMM images to determine optimal elliptical filter settings for HARP based strain measurements in skeletal muscle. The optimal filter settings consisted of intermediate radii in the width and height directions (each 12 pixels) and a Gaussian Variance of four pixels. This filter performed well in the lower strain ranges, for both positive and negative values but less well for higher strain values, reflected by the larger difference between measured and actual strain. This could be due to the larger spread of the deformed tag in the frequency domain for larger strain values10. Furthermore, larger differences between measured strain and actual strain were observed in the later dynamics, likely due to the lower contrast in these images. Both these phenomena were clearly visible for the large negative and positive strains in the X-direction and Y-direction, respectively. Another possible factor influencing strain quantification in these directions is some deformation in the tagging grid due to artifacts such as eddy currents. In the future, registration approaches can be explored to reduce the grid deformation prior to filtering13-14.Conclusion
Our simulation approach found optimized elliptical filter parameters for accurate strain quantification in skeletal muscle in a range of strain levels. This approach is easily translatable to other filter types or areas-of-interest.Acknowledgements
Development and Application of Muscle Diffusion Tensor MRI (Grant number: 1 R01 AR073831); National Institutes of Health/National Institute of Arthritis and Musculoskeletal and Skin Diseases.References
1] Axel L., Dougherty L. MR Imaging of motion with Spatial Modulation of Magnetization. Radiology 1989, Jun 171(3); 841-845
2] Zerhouni E.A., Pardish D.M., Rogers W.J. et al. Human heart: tagging with MR imaging – a method for noninvasive assessment of myocardial motion. Radiology 1988, Oct;169(1):59-63.
3] Parthasarathy J.L., Prince J.L., Stone M., Murano E.Z., NessAiver M., Measuring tongue motion from tagged cine-MRI using harmonic phase (HARP) processing. J. Acoust Soc. Am. 2007; 121; 491-504
4] Englund E.K., Elder C.P., Xu Q. et al. Combined diffusion and strain tensor MRI reveals a heterogeneous, planar pattern of strain development during isometric muscle contractions. Am J Physiol Regul Integr Comp Physiol 2011, Jan;26:1079-1090.
5] Sinha S., Hodgson J.A., Finni T., Lai A.M., Grinstead J.G., Edgerton V.R. Muscle Kinematics During Isometric Contraction: Development of Phase Contrast And Spin Tag Techniques to Study Healthy and Atrophied Muscles. 2004 J. Magn Reson Imaging. Dec;20(6):1008-1019
6] Atalar E., McVeigh E., Optimization of tag thickness for measuring position with magnetic resonance imaging. Trans. Med. Img. 1994;13(1):152-160.
7] Kumar S., Goldgof D., Automatic tracking of SPAMM grid and the estimation of deformation parameters from cardiac MR images . IEEE Trans. Med. Imag. 1993, 13, 122-132.
8] Osman N.F., Kerwin W.S., McVeigh E.R., Prince J.L., Cardiac motion tracking using cine harmonic phase (harp) magnetic resonance imaging. Magn. Reson. Med.; 1999, 42, 1048-1060.
9] Moerman K.M., Sprengers A.M.J., Simms C.K¸ Lamerichs R.M., Stoker J., Nederveen A.J., Validation of SPAMM tagged MRI based measurement of 3D soft tissue deformation. Med Phys. 2012 Mar; 38(3):1248-60.
10] Wang D., Fu, Y., Ashraf M.A., Aritfacts reduction in strain maps of tagged magnetic resonance imaging using harmonic phase. Open Med. 2015 Oct; 10:425-433
11] Osman N.F., Prince J.L., On the design of the bandpass filters in harmonic phase MRI. Image processing, International conference 2000,1,625-628.
12] Marinelli M., Positano V., Osman N.F., Recchia F.A., Lombardi M., Landini L., Automatic filter design in HARP analysis of tagged Magnetic Resonance Images. Biomedical imaging: From Nano to Macro, ISBI 5th IEEE International Symposium, 2008, 1429-1432.
13] Qian Z., Huang X., Metaxas D., Axel L., Robust segmentation of 4D cardiac MRI-tagged images via spatio-temporal propagation, In. Proc. SPIE Med Imag., 2005 580-591.
14] Chandrashekara R., Mohiaddin R.H., Rueckert D., Analysis of 3D Myocardial motion in tagged MR images using nonrigid image registration. IEEE Transactions on Medical Imaging. 2004; Oct; 23(10) 1245-1250
15] Ledesma-Carbayo M.J., Derbyshire J.A., Sampath S., Santos A., Desco M., Mcveigh E.R., Unsupervised estimation of myocardial displacement from tagged MR sequences using nonrigid registration. Magn. Reson. Med. 2008; Dec:59;181-189
Figures