3173
DT-MRI with the random permeable barrier model shows larger, more heterogeneous muscle fibre diameters in Becker muscular dystrophy patients1C.J. Gorter Centre for High Field MRI, Department of Radiology, Leiden University Medical Centre, Leiden, Netherlands, 2Norwich Medical School, University of East Anglia, Norwich, United Kingdom, 3Department of Neurology, Leiden University Medical Centre, Leiden, Netherlands, 4Biomedical Engineering and Physics, Amsterdam University Medical Centre, Amsterdam, Netherlands
Synopsis
Becker muscular dystrophy (BMD) is characterised by progressive muscle damage and weakness. Diffusion tensor imaging (DTI) represents a promising candidate for studying BMD; the random permeable barrier model (RPBM), in particular, gives estimates of muscle fibre diameters and membrane permeabilities. Here we study DTI and RPBM metrics in BMD patients and controls. Spin-echo and stimulated-echo DTI data were acquired in the lower leg and RPBM metrics calculated. DTI metrics showed time-dependence and intramuscular differences, but no inter-group differences. RPBM analysis, however, successfully showed differences between BMD patients and controls, with fibre diameters being larger and more variable in patients.
INTRODUCTION
Becker muscular dystrophy (BMD) is an X-linked disorder caused by mutations in the dystrophin gene and characterised by progressive muscle damage and concomitant muscle weakness. Hallmarks of the disease include muscle membrane instability and size variability, and replacement of skeletal muscle tissue with fat following a specific pattern of muscle involvement.1 Several pharmaceuticals are currently in development for treating BMD and sensitive outcome measures are required to test these. Diffusion tensor imaging (DTI) offers a wealth of information about skeletal muscle microstructure and architecture, thus showing promise for studying BMD. The random permeable barrier model (RPBM)—an extension of DTI utilising multiple diffusion times—is of particular interest, as it offers non-invasive estimates of muscle fibre diameters and membrane permeabilities.2,3In this study, we collect time-dependent diffusion data in BMD patients and healthy controls: first, to compare conventional DTI parameters between these groups; and, second, to explore differences in time-dependent-diffusion parameters derived from the RPBM.
METHODS
We scanned 13 BMD patients—age 20-59yrs—and 9 healthy, male controls—age 23-65yrs—using a 3 tesla Ingenia MR system (Philips, Best, NL). Images of the left lower-leg were acquired using the body coil for transmission with a 16-element anterior array and 12-element posterior array for reception. We applied short-diffusion-time spin-echo-(SE)-DTI and long-diffusion-time stimulated-echo-(STE)-DTI with: TR/TE=5,000/58ms; field-of-view=384×384mm; matrix size=96×96; 9 slices, 6mm thickness, 3mm gap; b-values=0 and 400s/mm2; 12 directions; SENSE factor=1.7 in the phase-encoding (anterior–posterior) direction; diffusion times, Δ, of 27ms for SE-DTI and 130 and 330ms for the two STE-DTI acquisitions; and spectral adiabatic inversion recovery and Dixon fat suppression.4Dixon imaging was applied over a larger volume with: TR=210ms; TE=4.4/5.2/6.0ms; flip angle=8°; field-of-view=180×180mm; matrix size=180×180; 23 slices, 10mm thickness, 5mm gap; and 2 averages.
Data processing was performed using a MATLAB pipeline (2019a, The MathWorks, Natick, CA) similar to that of Burakiewicz et al.4 DTI data were denoised via an overcomplete local principal component analysis filter;5 registered to non-weighted data in elastix;6 distortion-corrected; and parameters were calculated using weighted linear-least-squares regression in Camino (Microstructure Imaging Group, UCL, UK). Voxel-wise SNR maps were determined for DTI data using concurrently-obtained noise images.
Median DTI metrics—fractional anisotropy (FA) and mean diffusivity (MD)—were determined from ROIs manually-drawn in the lower-leg muscles on Dixon images. For each ROI, median radial diffusivities across all three diffusion times were fitted with the RPBM using code hosted on GitHub (github.com/NYU-DiffusionMRI/RPBM). This produced the characteristic fibre diameter, a, and myofibre membrane permeability, κ, plus the root-mean-square error and adjusted R2 for quality control.
RESULTS
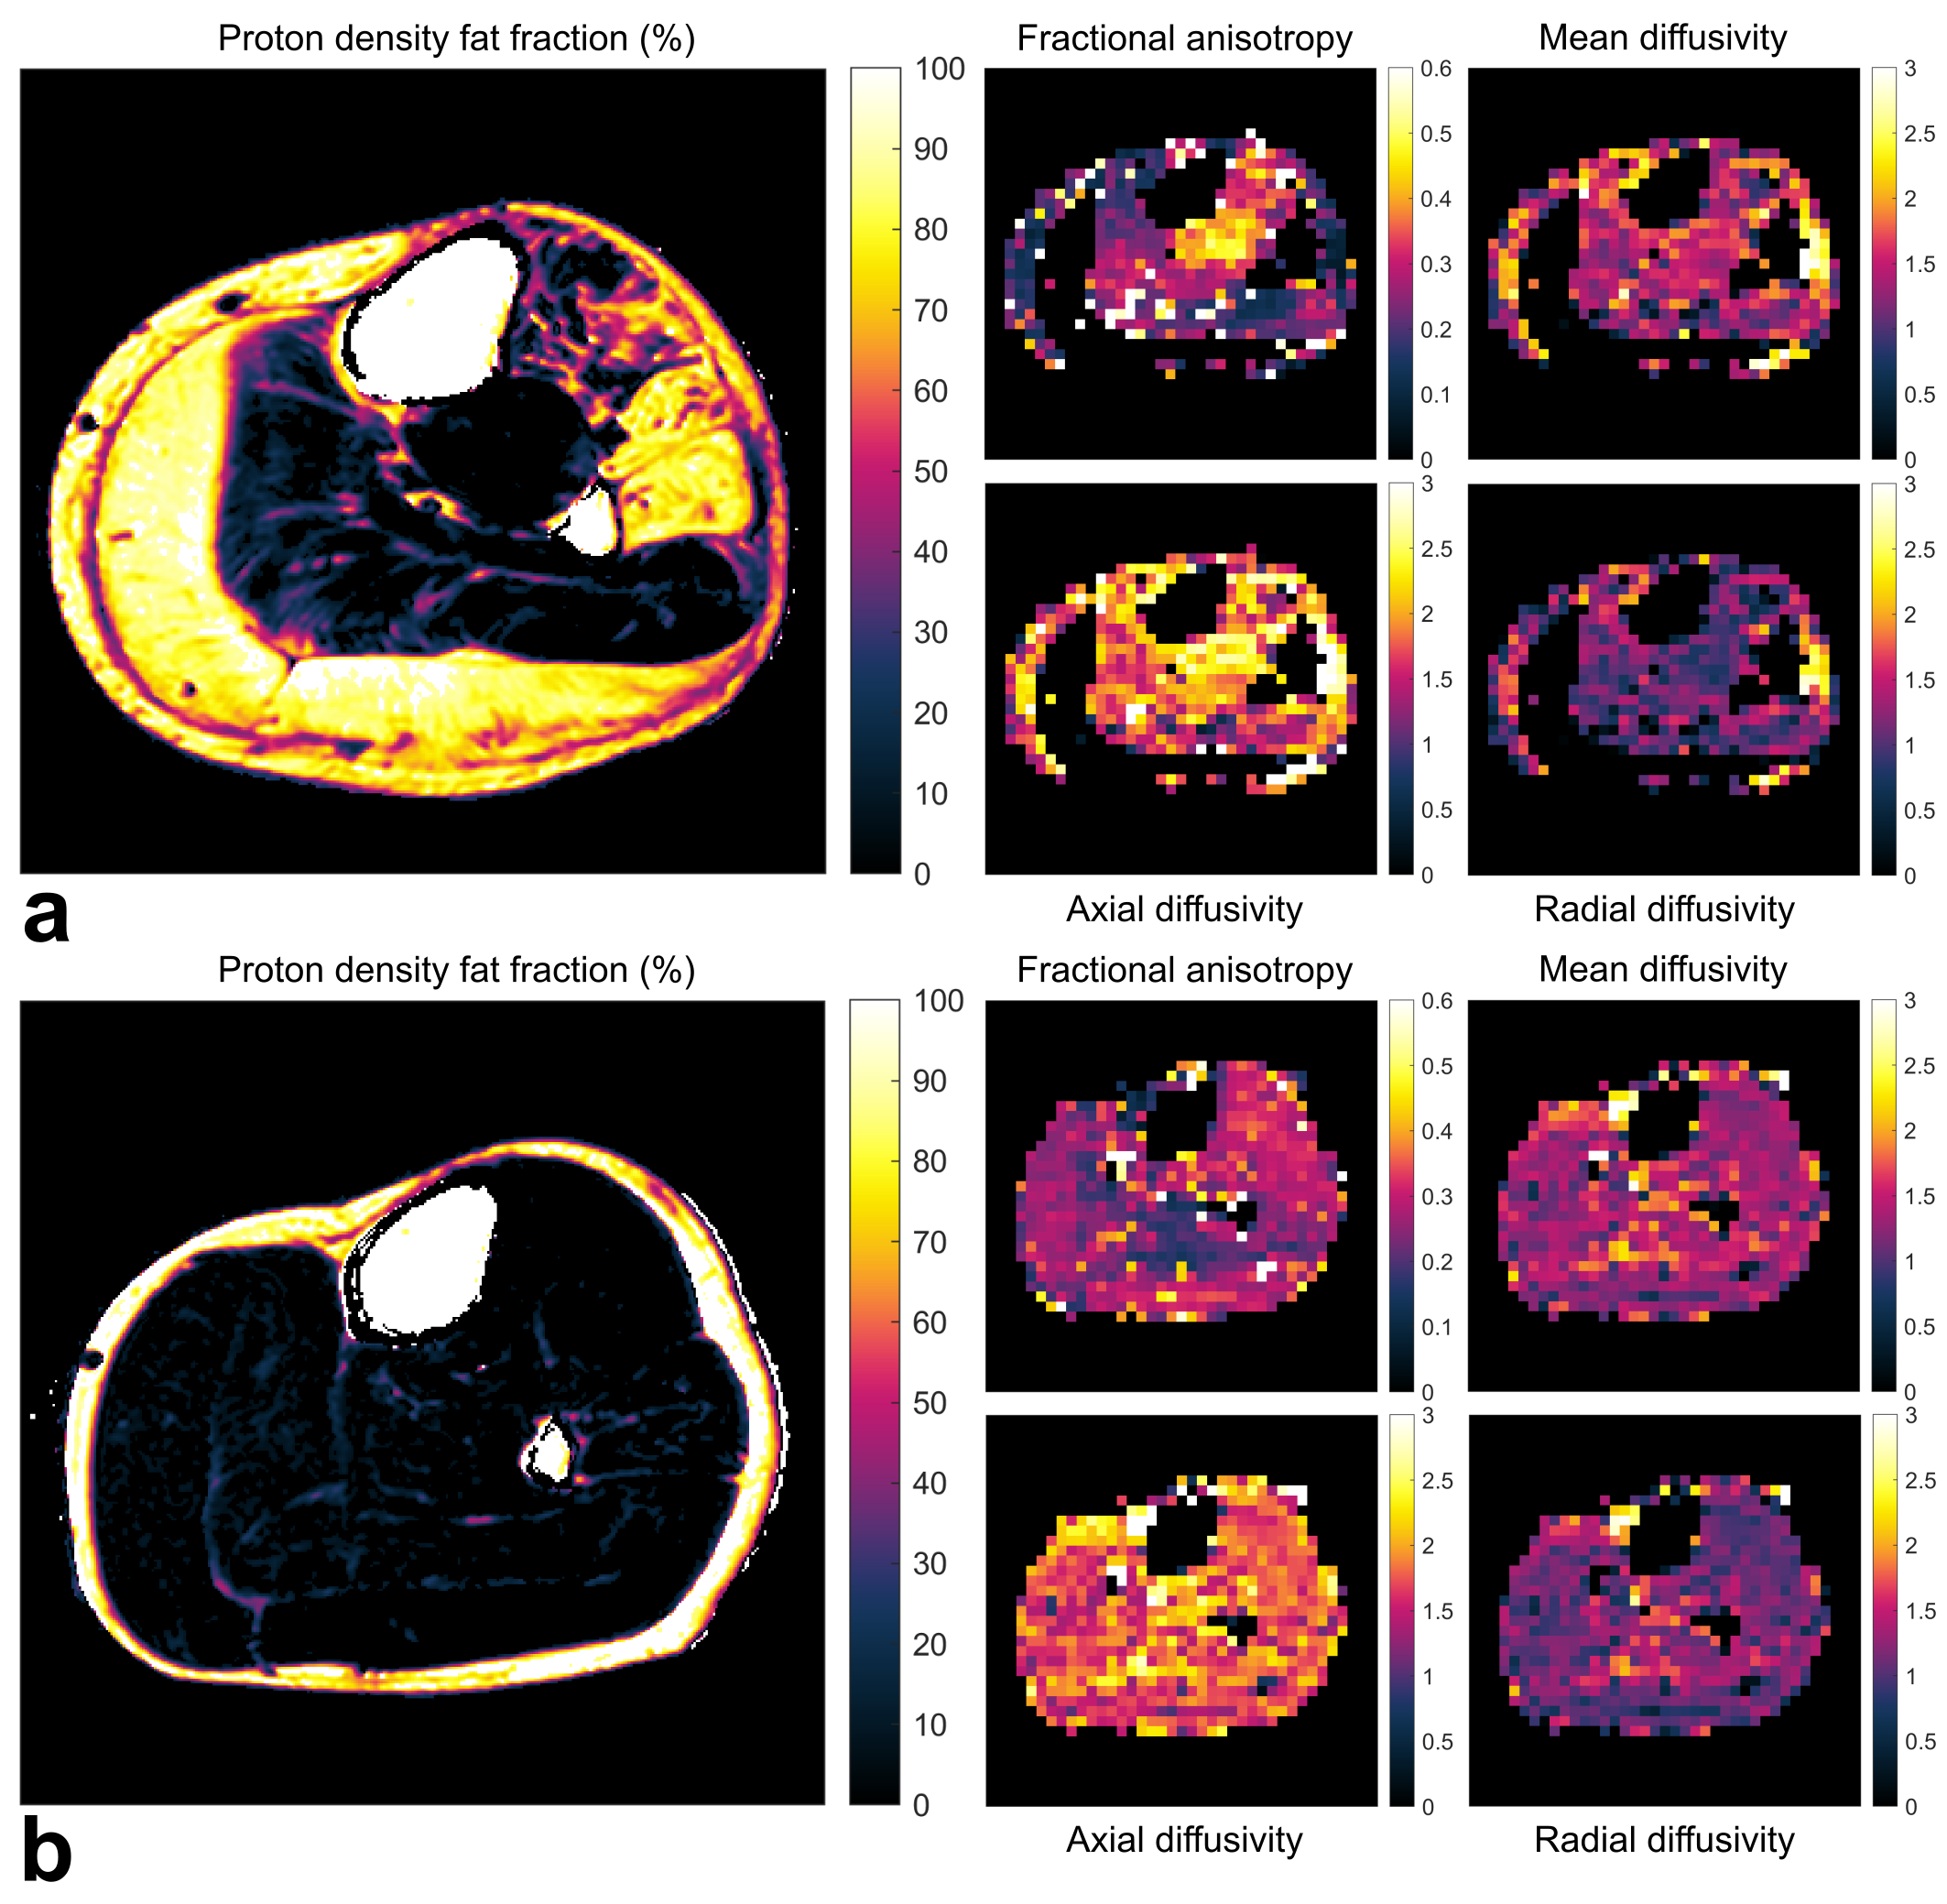
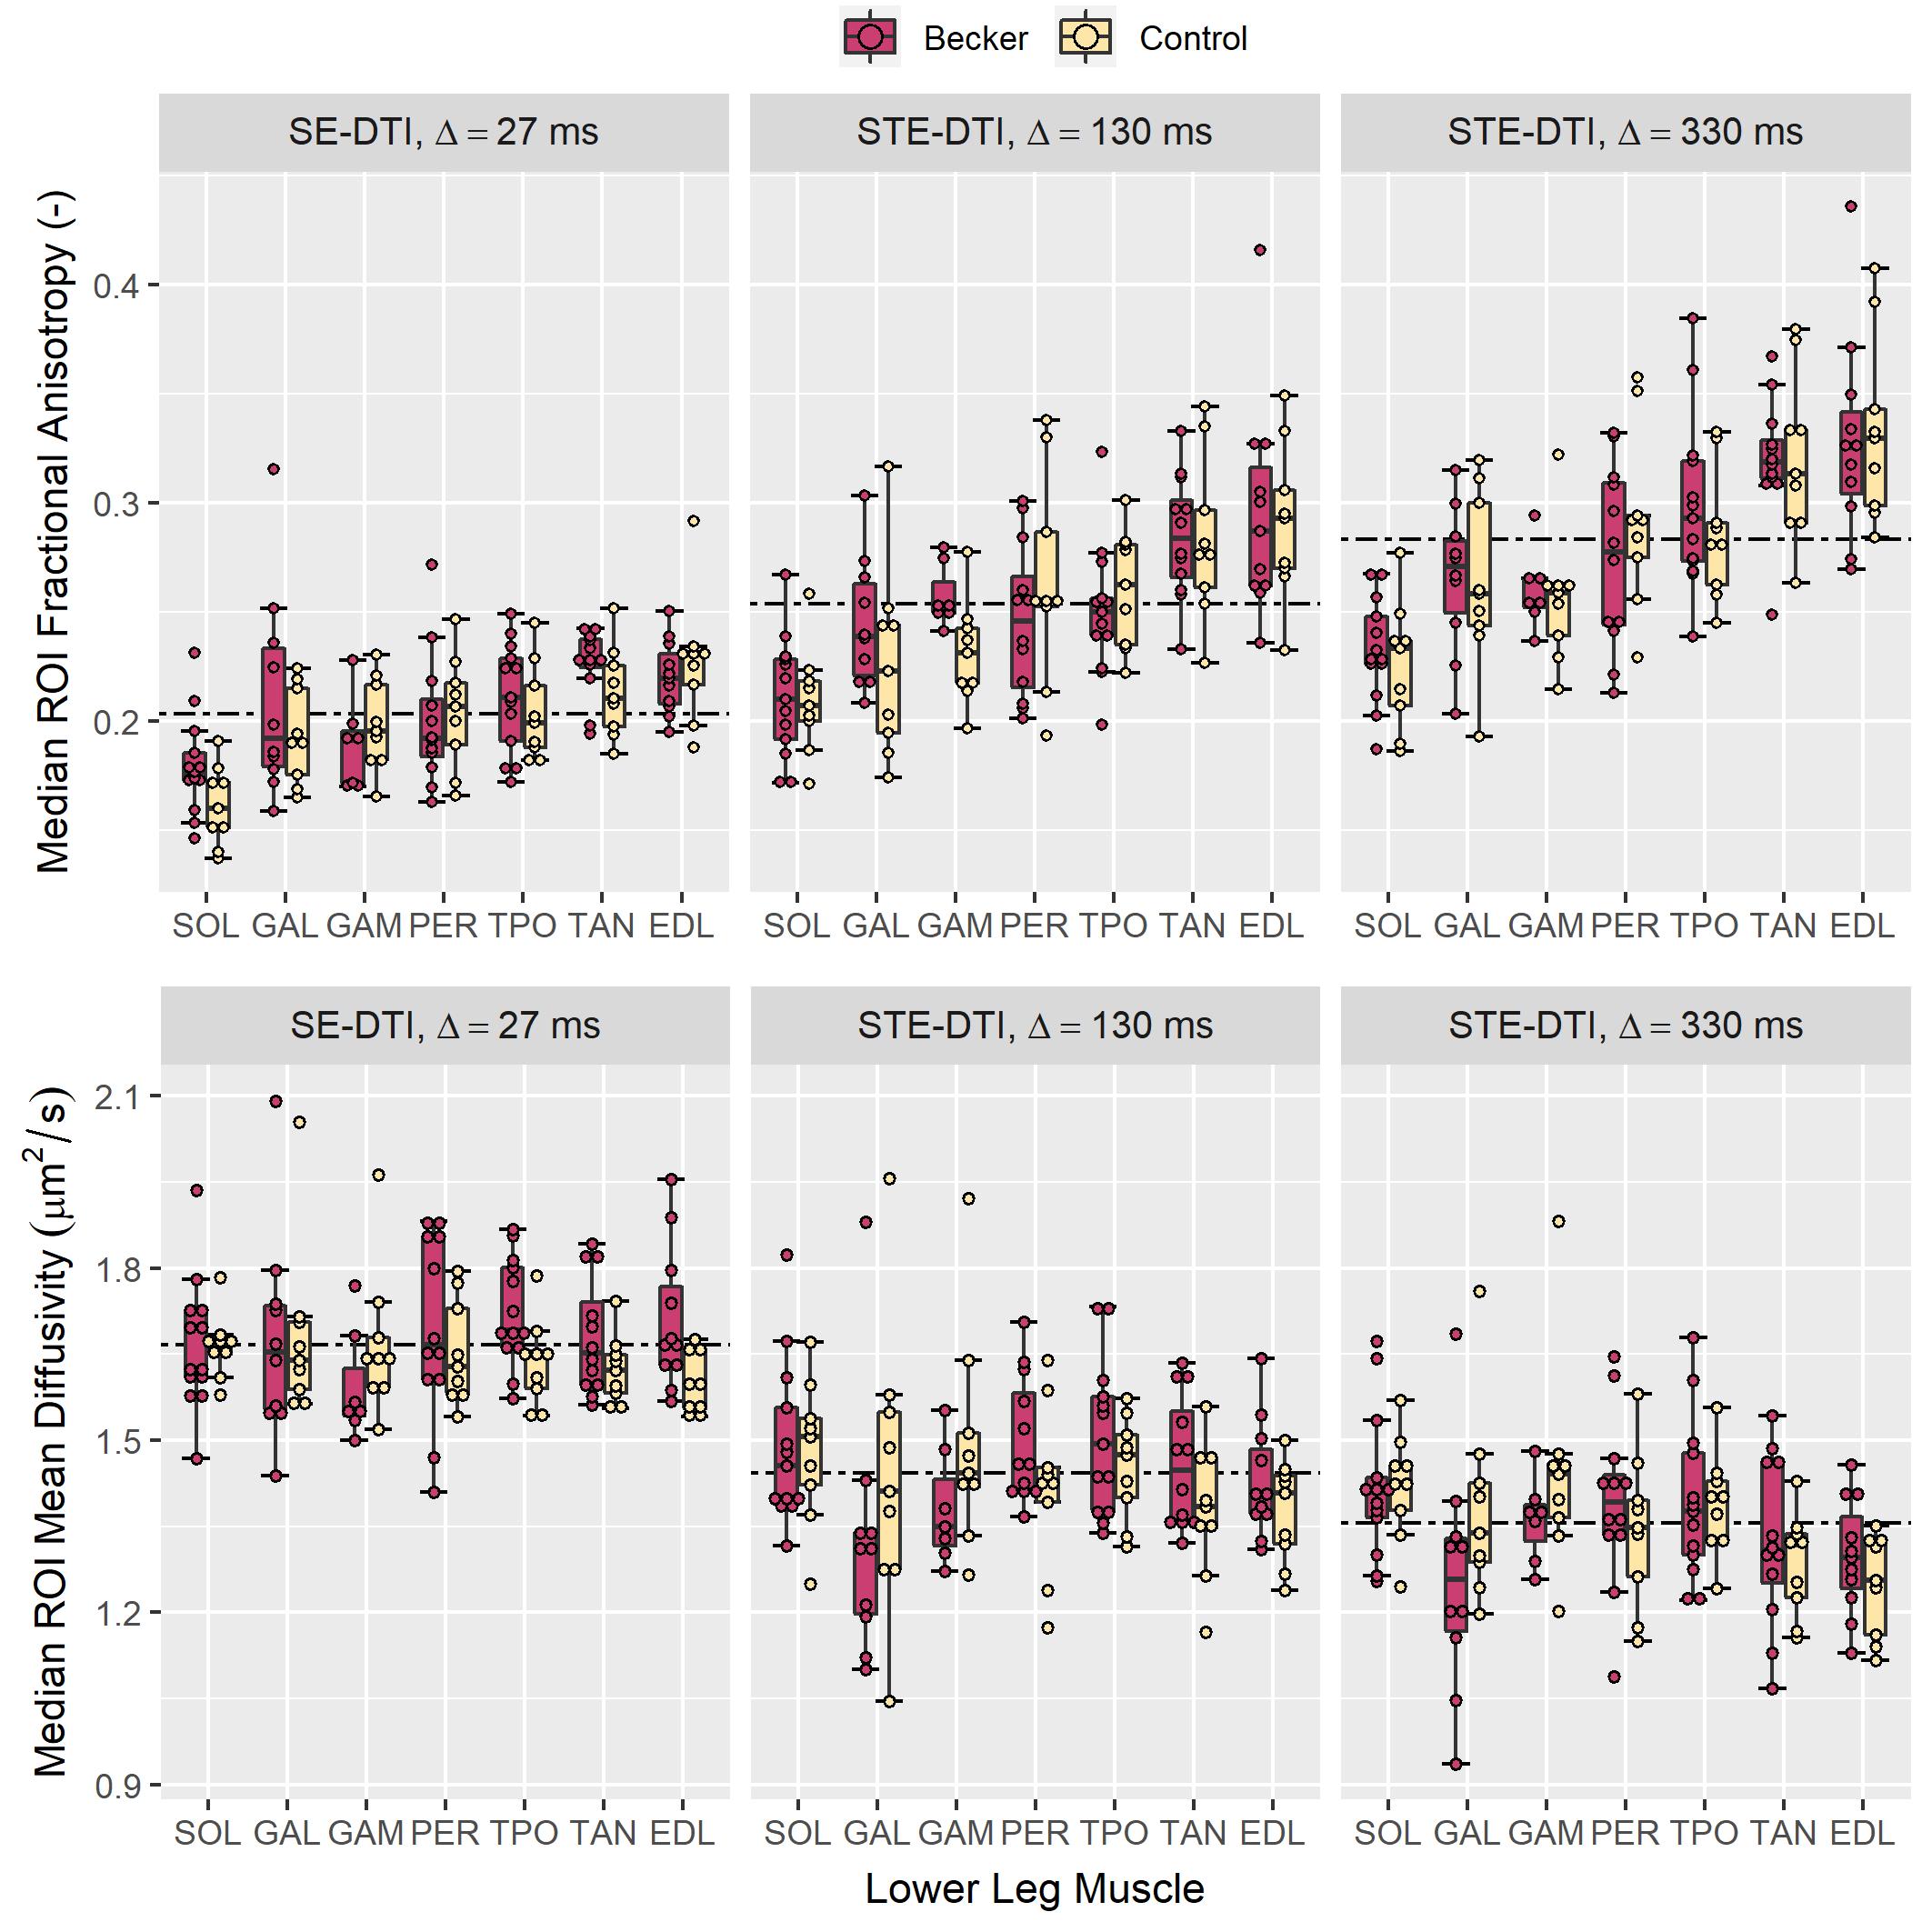
Representative DTI and Dixon data are shown in Fig. 1. DTI SNR differed significantly between BMD patients and controls at Δ=27ms: mean (SD) SNR = 83.5 (9.5) and 78.3 (11.3), respectively (p=0.02). However, SNRs were similar at Δ=130ms (~27, p=0.78) and Δ=330ms (~22, p=0.55).The mean FA over all muscles and participants tended to increase with increasing diffusion time, while MD decreased, showing clear time-dependence (Fig. 2). Inter-group FA and MD did not differ significantly; however, intra-group, in patients and controls, the posterior calf muscles tended to have lower FAs than anterior muscles, as confirmed by 1-way ANOVA and post-hoc tests.
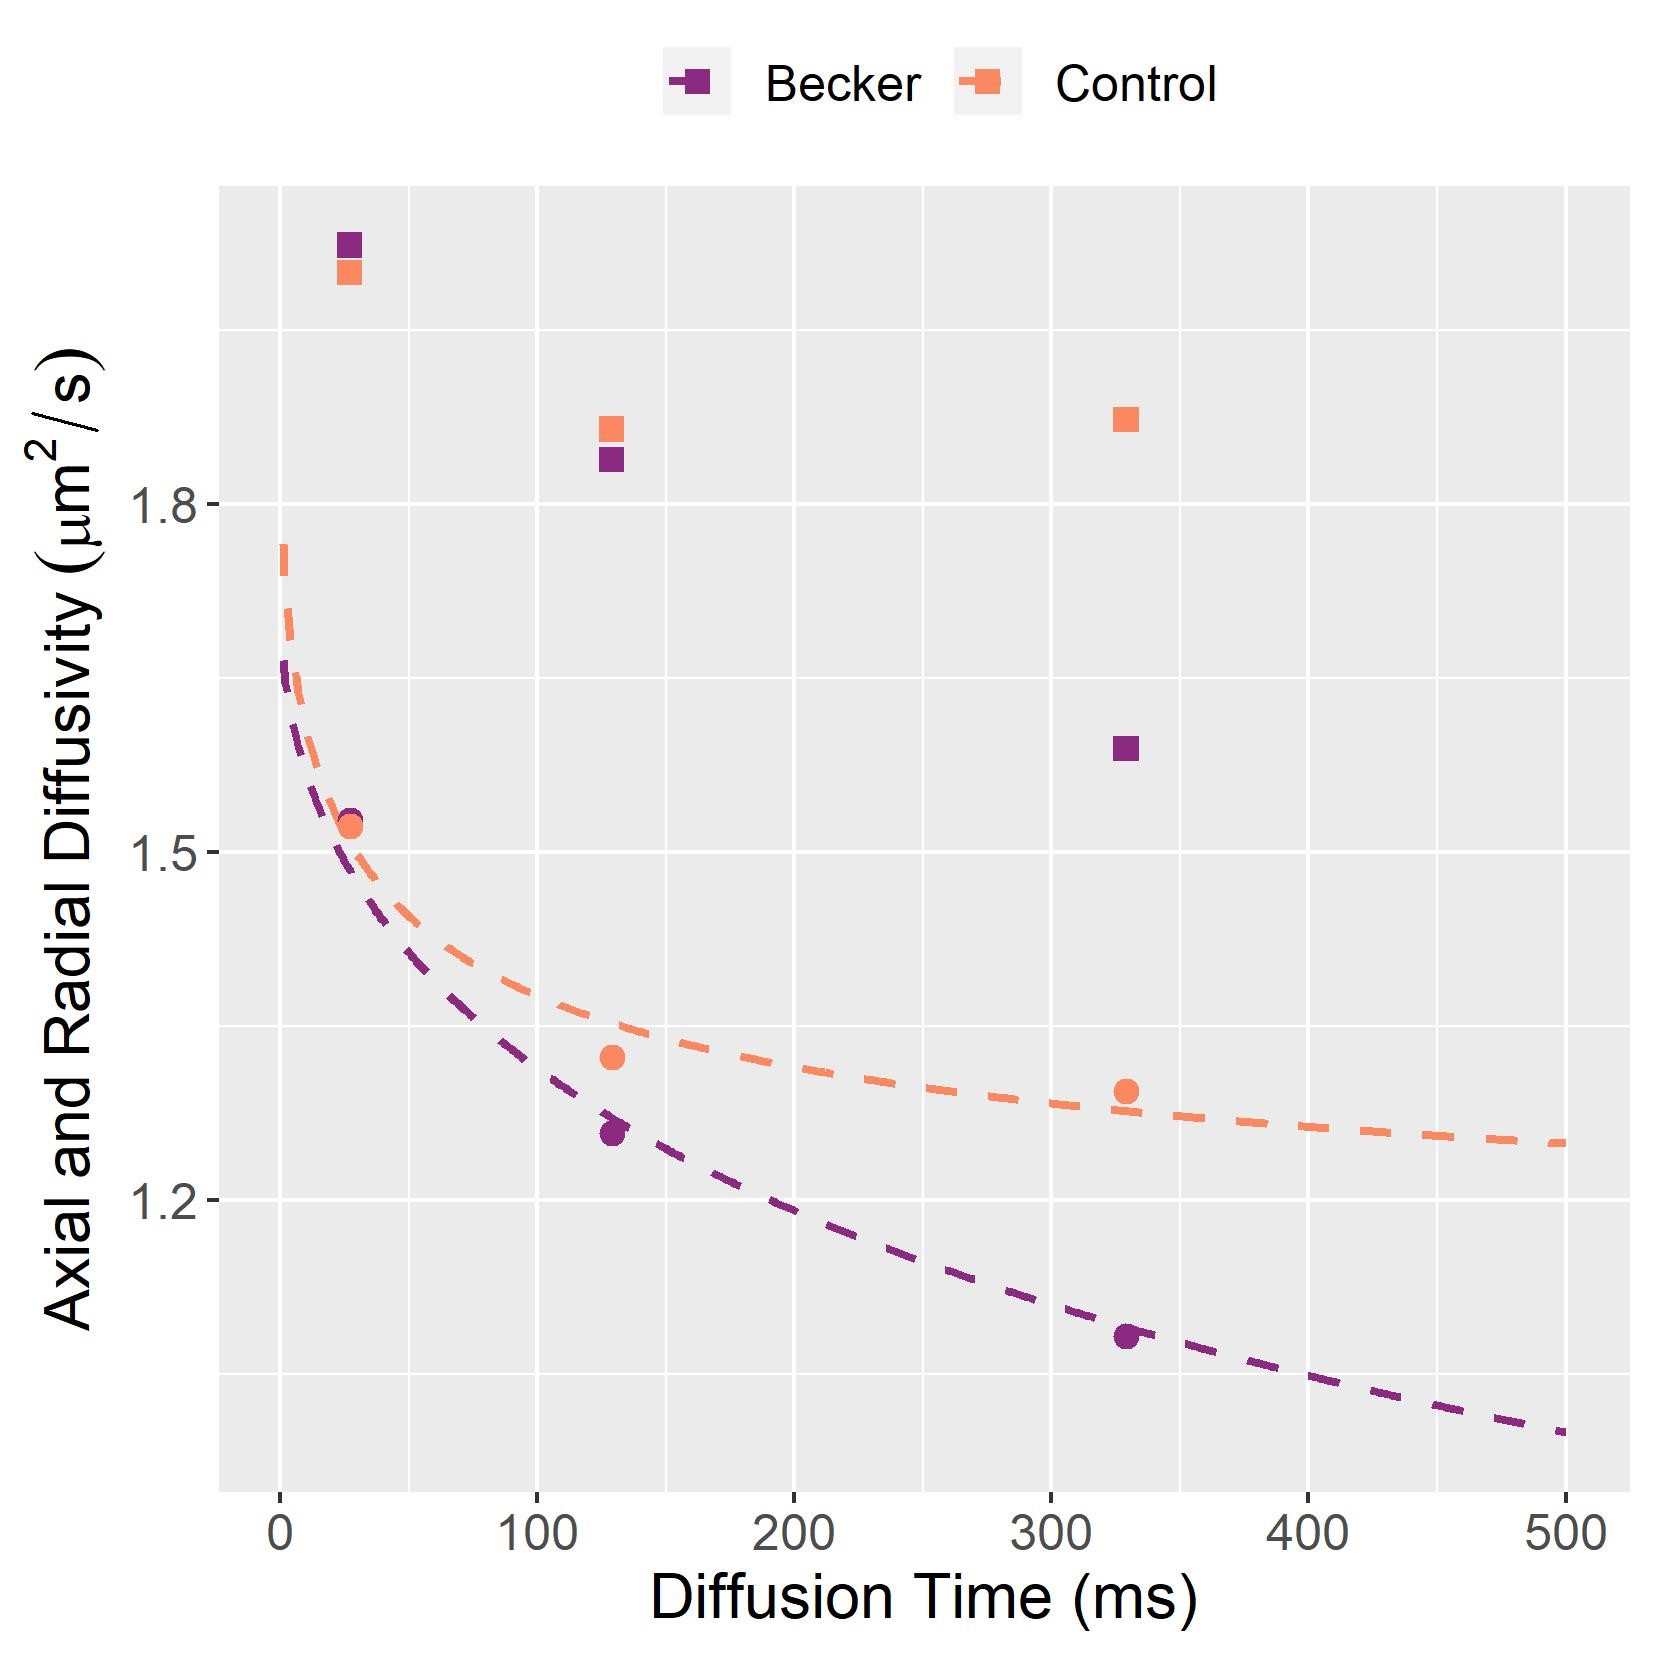
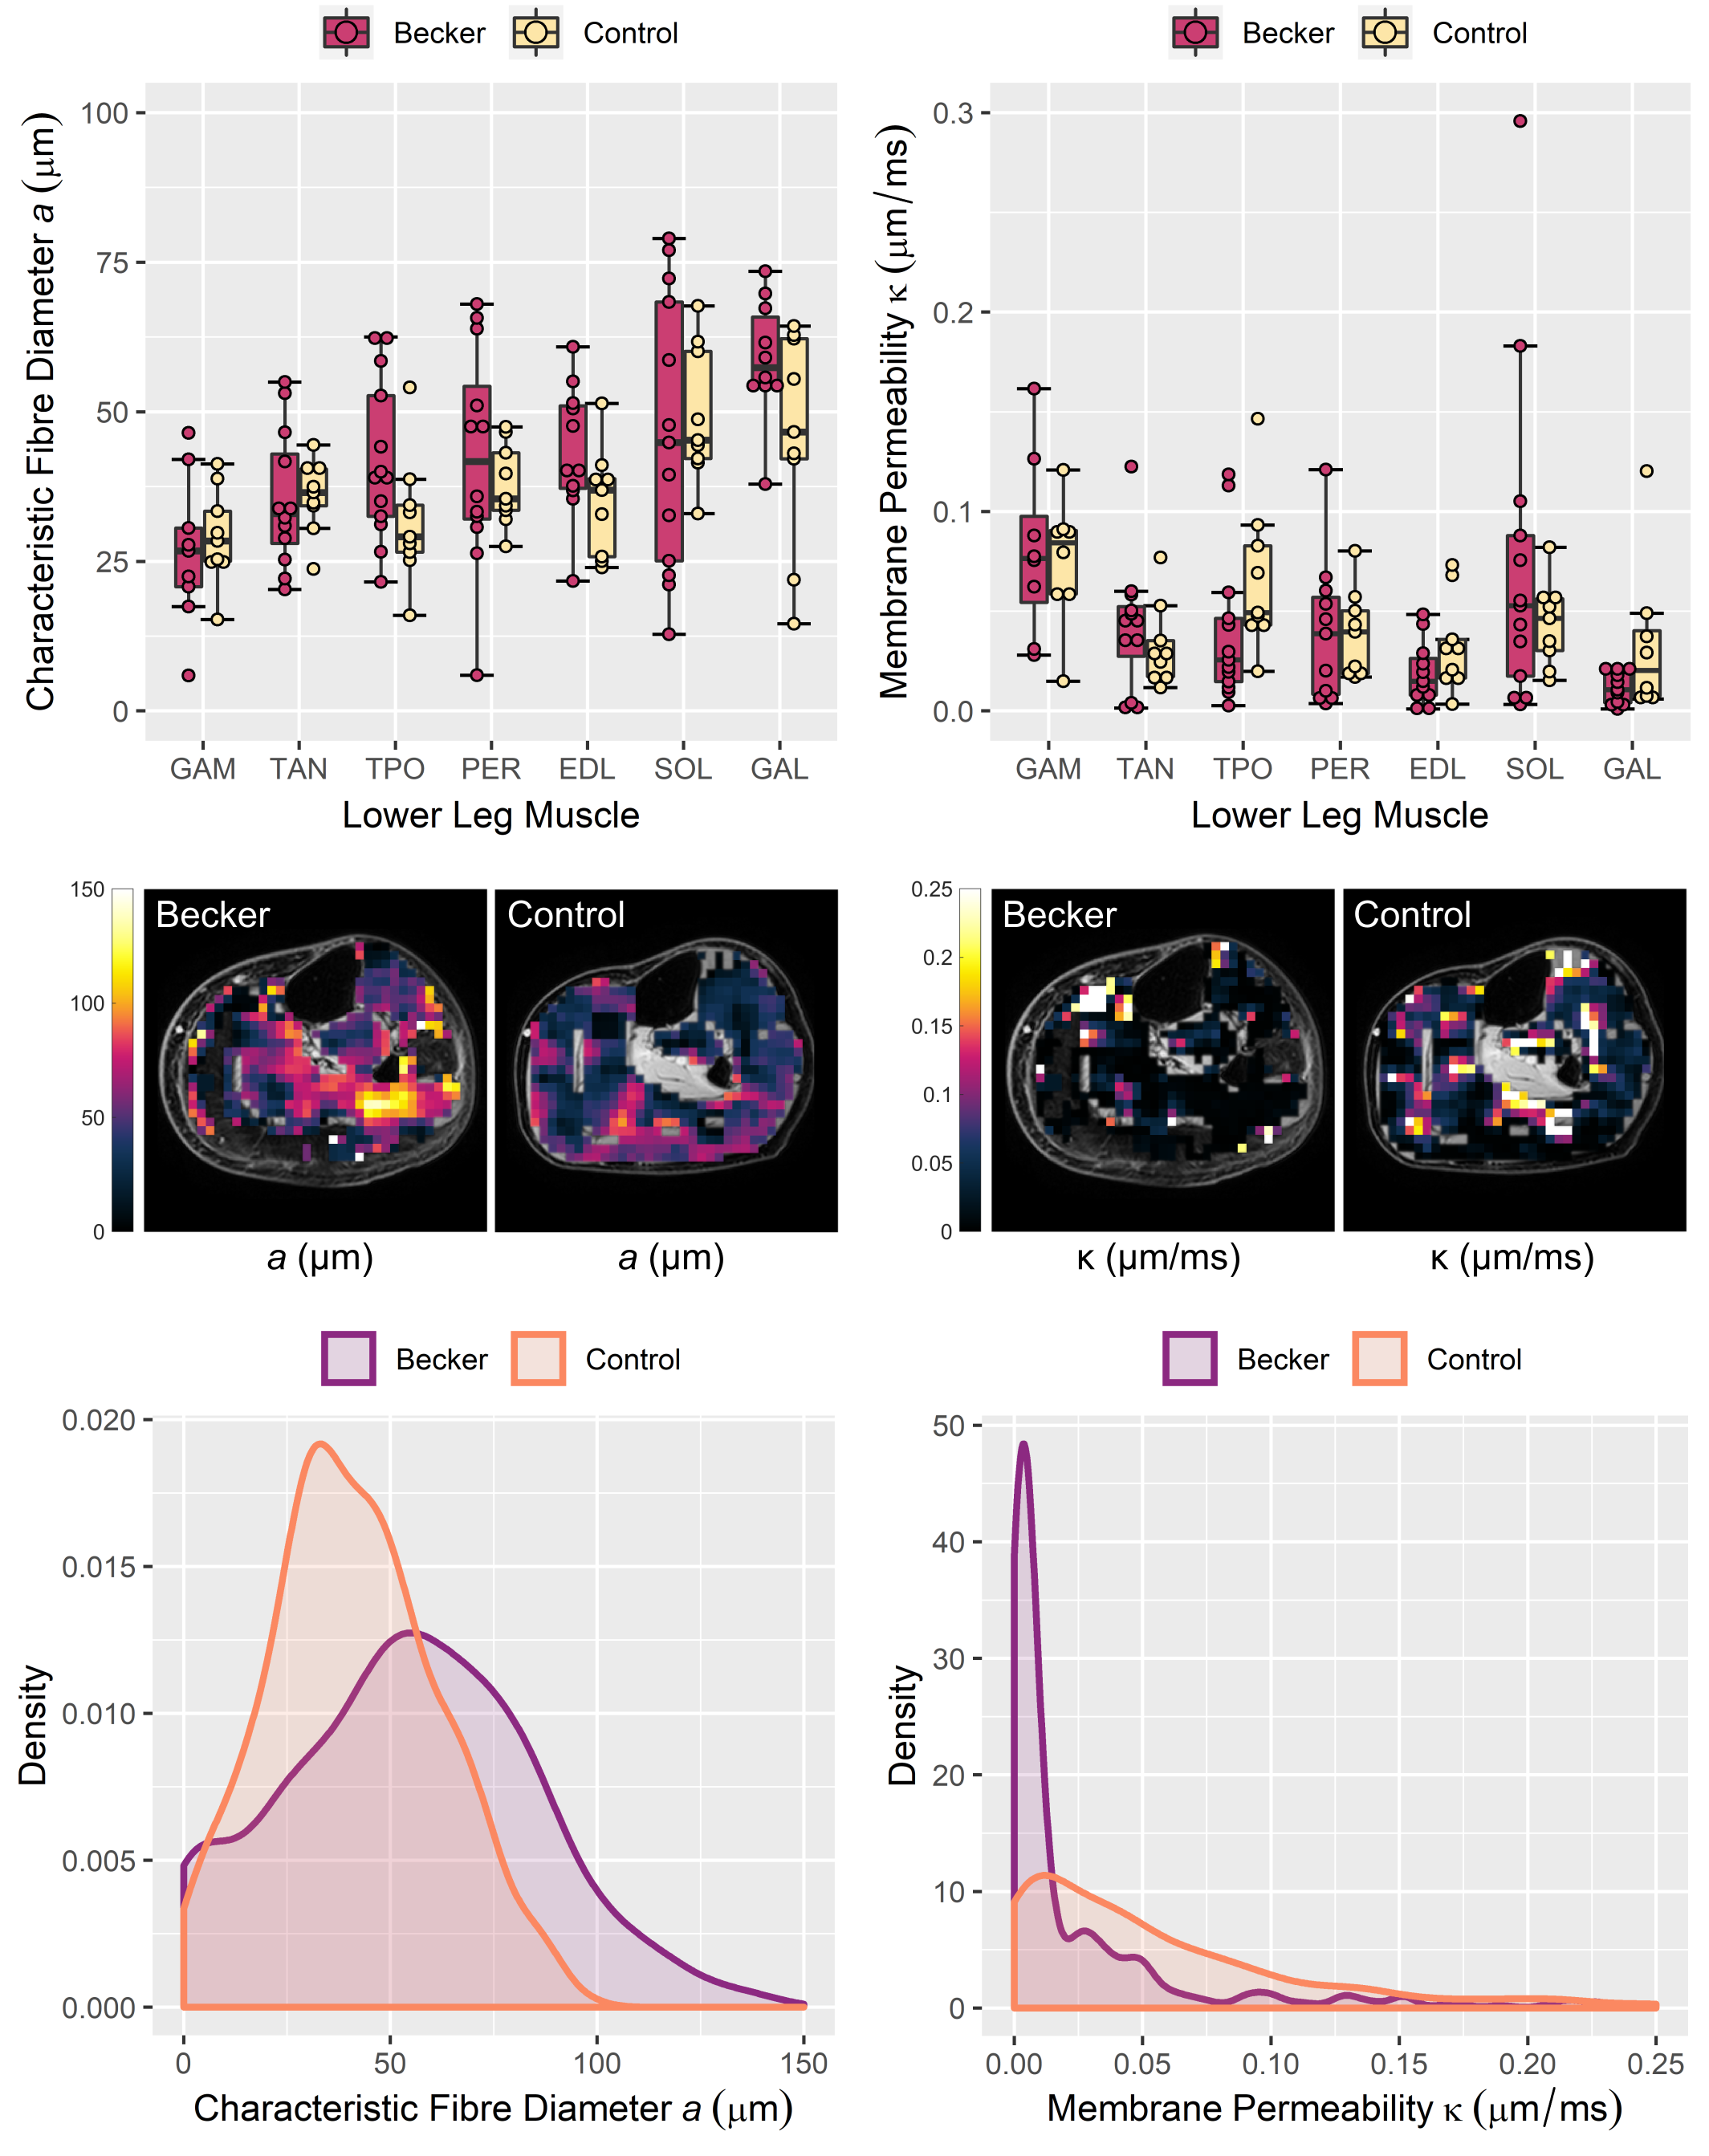
RPBM fits are shown in Fig. 3, with group data in Fig. 4. Regarding fibre diameter, 2-way ANOVA indicated a significant difference in the mean—F(1,133)=6.1, p=0.015—and variance in patients versus controls (p=0.003) with mean (SD) values of 43 (16)μm in BMD patients and 37 (12)μm in controls. DTI-estimated membrane permeability did not differ significantly between groups.
DISCUSSION
In this DTI study in BMD we show larger and more variable muscle fibre diameters in BMD versus controls, in agreement with literature histology data where BMD fibre sizes range from 10 to 150μm.7 By contrast, we found no differences in membrane permeability, which may relate to the fact that endomysial fibrosis is not considered in the RPBM and may lead to artificially-elevated permeability estimates. We will verify these findings using histological measures of fibre area, fibre type, and fibrosis content obtained in the same cohort.The intermuscular differences in FA in both groups tended to align with imaging studies of muscle involvement in BMD, as posterior calf muscles—with low FA—are typically affected first.8 Further, it has been theorised that between-muscle FA differences in controls relate to different fibre-type proportions between muscles—FA being positively associated with Type-I-fibre proportion in skeletal muscle.9 Regarding DTI time-dependence, we have replicated trends from previous studies whereby FA increases with longer diffusion times, while MD decreases.10 Further, in patients and controls the aforementioned intermuscular differences in FA become more distinct at longer diffusion times. However, we observed no differences in DTI metrics between patients and controls at any diffusion time, unlike RPBM metrics. This may be a consequence of the disease’s heterogeneity.
CONCLUSION
We show inter-muscle differences in DTI metrics that increase at longer diffusion times, and diffusion parameters in general show a clear time-dependent effect; however, DTI metrics failed to show differences between BMD patients and controls. Further RPBM analysis, on the other hand, showed larger and more variable muscle fibre diameters in BMD patients versus controls—findings that will later be compared with histology data.Acknowledgements
No acknowledgement found.References
1. N. Faridian-Aragh, K. R. Wagner, D. G. Leung, and J. A. Carrino. Magnetic resonance imaging phenotyping of Becker muscular dystrophy. Muscle & Nerve 2014, vol. 50, no. 6, pp. 962–967.
2. D. S. Novikov, E. Fieremans, J. H. Jensen, and J. A. Helpern. .Random walks with barriers. Nature Physics 2011, vol. 7, no. 6, pp. 508–514.
3. E. E. Sigmund, D. S. Novikov, D. Sui, O. Ukpebor, S. Baete, J. S. Babb, K. Liu, T. Feiweier, J. Kwon, and K. McGorty. Time-dependent diffusion in skeletal muscle with the random permeable barrier model (RPBM): Application to normal controls and chronic exertional compartment syndrome patients. NMR in Biomedicine 2014, vol. 27, no. 5, pp. 519–528.
4. J. Burakiewicz, M. T. Hooijmans, A. G. Webb, J. J. G. M. Verschuuren, E. H. Niks, and H. E. Kan. Improved olefinic fat suppression in skeletal muscle DTI using a magnitude-based Dixon method. Magnetic Resonance in Medicine 2018, vol. 79, no. 1, pp. 152–159.
5. J. V. Manjón, P. Coupé, L. Concha, A. Buades, D. L. Collins, and M. Robles. Diffusion weighted image denoising using overcomplete local PCA. PLOS ONE 2013, vol. 8, pp. 1–12.
6. S. Klein, M. Staring, K. Murphy, M. A. Viergever, and J. P. W. Pluim. elastix: A toolbox for intensity-based medical image registration. IEEE Transactions on Medical Imaging 2010, vol. 29, no. 1, pp. 196–205.
7. M. A. Johnson, G. Sideri, D. Weightman, and D. Appleton. A comparison of fibre size, fibre type constitution and spatial fibre type distribution in normal human muscle and in muscle from cases of spinal muscular atrophy and from other neuromuscular disorders. Journal of the Neurological Sciences 1973, vol. 20, pp. 345–361.
8. G. Tasca, E. Iannaccone, M. Monforte, M. Masciullo, F. Bianco, F. Laschena, P. Ottaviani, M. Pelliccioni, M. Pane, and E. Mercuri. Muscle MRI in Becker muscular dystrophy. Neuromuscular Disorders 2012, vol. 22, pp. S100–S106.
9. M. Scheel, P. von Roth, T. Winkler, A. Arampatzis, T. Prokscha, B. Hamm, and G. Diederichs. Fiber type characterization in skeletal muscle by diffusion tensor imaging. NMR in Biomedicine 2013, vol. 26, no. 10, pp. 1220–1224.
10. A. M. Marschar, T. A. Kuder, B. Stieltjes, A. M. Nagel, P. Bachert, and F. B. Laun. In vivo imaging of the time-dependent apparent diffusional kurtosis in the human calf muscle. Journal of Magnetic Resonance Imaging 2015, vol. 41, no. 6, pp. 1581–1590.
Figures