3170
Quantification of gluteal and multifidus muscle asymmetry and fat infiltration in patients with unilateral lumbosacral nerve root compression1The First Affiliated Hospital of Nanjing Medical University, Nanjing, China, 2GE Healthcare, MR Research China, Beijing, China
Synopsis
Muscle asymmetry and fatty infiltration resulting from lumbosarcal nerve root compression are associated with movement ability directly. However, the specific rule remains unclear. In this study, we used three dimensional fast imaging empolying steady-state acquisition with phase cycling(3D-FIESTA-C) and iterative decomposition of water and fat with echo asymmetry and least-squares estimation intelligent quantification (IDEAL-IQ) technique to evaluate the changes quantitatively. We found muscle changes were side- and level-specific, affected by several other factors. Muscle content is suggested as a good parameter for clinical evaluation.
Introduction
Lumbosacral nerve root compression affects more and more people. It’s reported that chronic nerve root compression can delay nerve conduction velocity1 and make muscle atrophy and fat infiltration gradually2.These changes affect hip joint mobility and pelvic stability3.Current studies mainly focus on the paravertebral muscles, and remain controversial in the changes of multifidus4. The changes of gluteal muscles with lumbosacral nerve root compression haven’t attracted enough attention.
The objectives of this study were to (1) investigate bilateral changes of gluteal and multifidus muscles in patients with unilateral lumbosacral nerve root compression; (2)investigate the muscle changes at different compression levels and its relationship with JOA score.
Materials and Methods
SubjectsOur prospective study was approved by the clinical research ethics board.
The case group comprised 48 men and 40 women. 27 cases with unilateral compression associated with disc herniation were confirmed at L5 nerve root, 35 at S1 nerve root and 26 at both L5 and S1 nerve roots due to L4-5 disc herniation. The average JOA score was 14.27± 1.72 points. The average symptom duration was 3(2, 6) months.
The control group included 34 men and 36 women. Average JOA score of this group was 28.19±0.78 points.
MRI experiment
All experiments were performed at GE 3.0 T 750W with phase-array chest-body coils. 3D-FIESTA-C and IDEAL-IQ technique were applied.
Data analysis
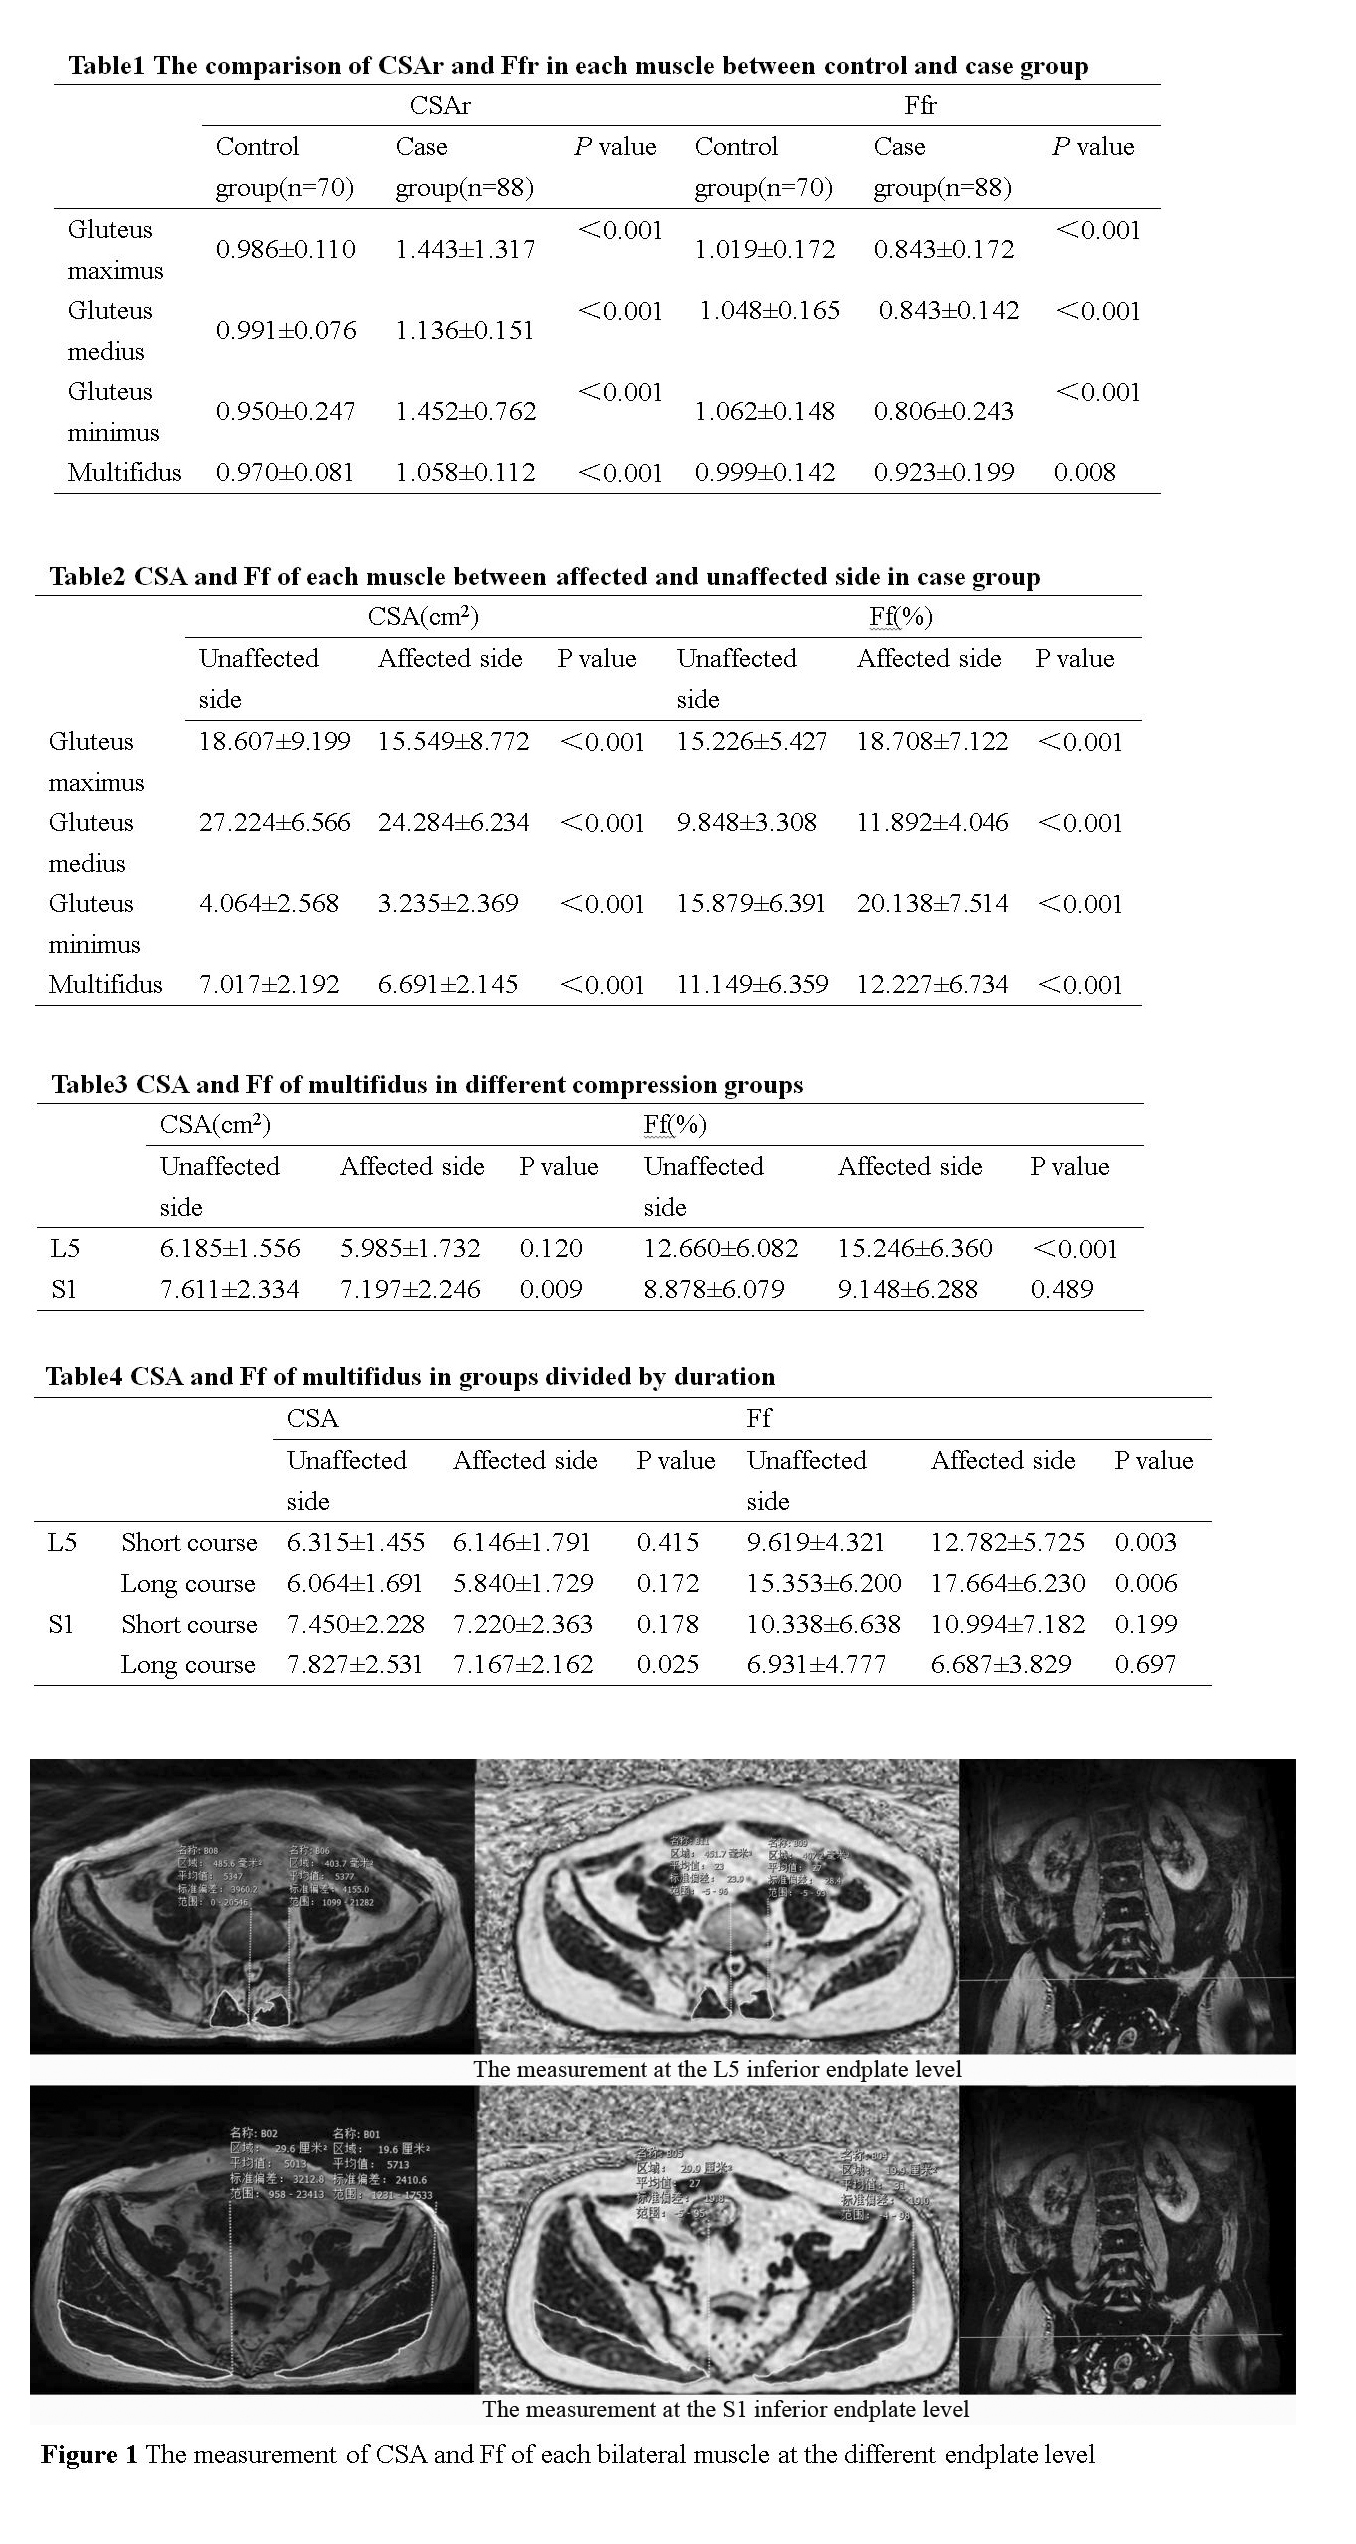
All data were analyzed at a GE MR workstation (Advantage workstation 4.6; GE Medical Systems). On axial 3D-FIESTA-C images and the fat fraction images of IDEAL-IQ sequence, the cross sectional area (CSA) and fat fraction(Ff) of bilateral multifidus muscles at the L5 inferior endplate level, were measured respectively. The CSA and Ff of bilateral gluteal muscles were measured at the S1 inferior endplate level, as well as subcutaneous fat area(Sfs) and thickness(Sfd)(Figure 1).
All statistical analyses were performed in SPSS software. CSAr was defined as a ratio of bilateral muscle CSA in healthy volunteers and CSA of unaffected side to affected side in patients. Ffr was defined the same way. The age, Sfs, CSAr and Ffr of the two groups were compared using independent samples t test and Mann-Whitney U test.
In case group, Pearson correlation analysis was used to evaluate the correlation of CSAr and Ffr to symptom duration. Paired t tests were used to compare the CSA and Ff between the affected and unaffected sides at the level above.
CSAm was used to represent the muscle content. It was calculated by the formula CSA*(1-Ff). CSAmr was defined as the ratio of bilateral muscle CSAm. The correlation between CSAmr and JOA scores was analyzed using Pearson correlation analysis.
Results
Age was significantly correlated with the Ff of gluteal muscles (P < 0.05), and with the CSA and Ff of the multifidus muscle (P < 0.005, P < 0.001). Sfs was correlated with the Ff of gluteal muscles (P < 0.001), but not with the Ff of multifidus. There was no correlation between Sfd and Ff of each muscle. The CSA of each muscle in males were larger than those in females (P < 0.001), while the Ff of multifidus muscle was smaller(P < 0.05). The side-to-side difference in CSA and Ff of healthy volunteers did not reach statistical significance.Two groups of CSAr and Ffr were compared. CSAr of gluteal muscles and multifidus in the case group was smaller than in the control group, and Ffr of gluteal muscles was larger (Table 1).
In case group, CSA of each muscle on the affected side was significantly smaller than that on the unaffected side, whereas Ff was greater (Table 2). In the L5 compression group, Ff of multifidus on the affected side was greater than on the unaffected side. In the S1 compression group, CSA on the affected side was smaller than the other side (Table 3).
The difference in Ff of multifidus muscle in short and long groups was statistically significant (Table 4).
The CSAmr of gluteus maximus, gluteus medius, gluteus minimus and multifidus were correlated with JOA scores to different degrees(r=0.274, P<0.001; r=0.516, P<0.001; r=0.473, P<0.001; r=0.790, P<0.001).
Discussion
The 3D-FIESTA-C and IDEAL-IQ imaging technique provides an accurate assessment of CSA and Ff.In our study, we found atrophy and fatty infiltration of gluteal muscles on the same side of lumbosacral nerve root compression. For multifidus, we speculate it changes mainly due to denervation when L5 nerve root compresses. In patients with S1 nerve root compression, multifidus undergoes more of disuse atrophy. Therefore, as to treatment, clinicians should pay more attention to strengthen the exercise of multifidus besides relieving the direct symptoms caused by nerve root compression5.
Muscle content is associated with JOA scores and suggested to be a useful indicator.
Conclusion
The atrophy and fatty infiltration of multifidus, gluteus muscles in patients with unilateral lumbosacral nerve root compression are side specific. The changes of multifidus are associated with the level nerve root compressed. As an indirect manifestation of nerve root compression, muscle changes can help diagnosis in the conventional lumbar MR images and serve as a potential quantitative indicator to complete the postoperative evaluation, especially muscle content.Acknowledgements
No acknowledgement found.References
1. Gwak GT, Hwang UJ, Jung SH, et al. Comparison of MRI cross-sectional area and functions of core muscles among asymptomatic individuals with and without lumbar intervertebral disc degeneration[J].BMC Musculoskelet Disord,2019;20(1):576.
2. Kim SJ, Hong SH, Jun WS, et al. MR imaging mapping of skeletal muscle denervation in entrapment and compressive neuropathies[J].Radiographics,2011;31(2):319–332.
3. Ozkara GO, Ozgen M, Ozkara E, et al. Effectiveness of physical therapy and rehabilitation programs starting immediately after lumbar disc surgery[J].Turk Neurosurg,2015;25(3):372–379.
4. STEVENS S, AGTEN A, TIMMERMANS A, et al. Unilateral changes of the multifidus in persons with lumbar disc herniation: a systematic review and meta-analysis [published online ahead of print, 2020 Apr 20][J]. Spine J. 2020;S1529-9430(20)30142-X.
5. Russo M, Deckers K, Eldabe S, Kiesel K, Gilligan C, Vieceli J, Crosby P. Muscle Control and Non-specific Chronic Low Back Pain. Neuromodulation. 2018 Jan;21(1):1-9.
Figures