3169
Effect of moderate exercise on diffusion indices in skeletal muscle1Centre for Neuromuscular Diseases, UCL Queen Square Institute of Neurology, London, United Kingdom, 2GOS UCL Institute of Child Health, London, United Kingdom
Synopsis
An examination of the effect of moderate exercise on diffusion indices in skeletal muscle in volunteers in order to quantify the effect of the exercise, and define when diffusion indices returned to baseline rest values. We found that there was no significant difference between pre- and post-exercise MD or FA. We believe that moderate exercise will have no evident effect on diffusion indices, and no period of rest pre-scan is required.
Introduction
There is a small body of work examining the effect of exercise on MR diffusion sequences in muscle1,2. These often examine the effects of very strenuous exercise such as marathon running3 or flexing the ankle while carrying a load equal to the subject’s body weight 75 times over4. These sorts of exercises significantly damage and inflame the muscle, leading to significant effects on diffusion indices such as Mean Diffusivity (MD) and Fractional Anisotropy (FA) as seen in Yanagisawa et al4.In this work, we examine the effect of a more realistic level of exercise that a patient might have undertaken in order to travel to a MR scan on standard diffusion indices. This would be used to evaluate if any period of rest/immobilisation should be scheduled before the scan. Scheduling such a period extends the appointment time, is not palatable to young participants and could increase non-participation of patient groups. We aimed to examine MD and FA before and immediately after light to moderate exercise of the calf muscle in order to quantify the effect of the exercise and define when diffusion indices returned to baseline rest values.
Methods
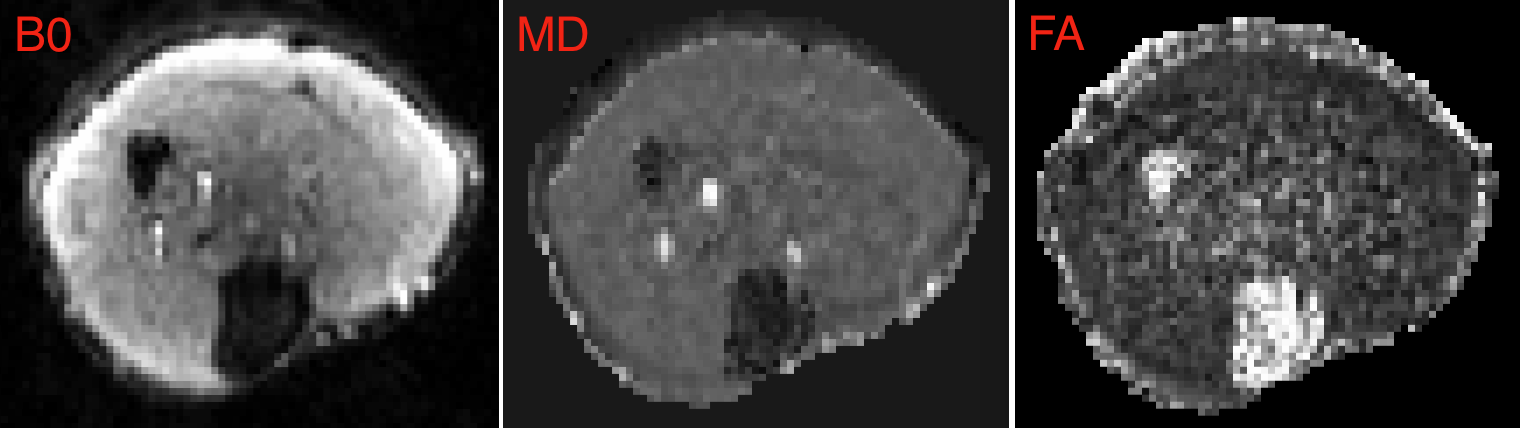
Six volunteers were imaged on a 3T MAGNETOM Prisma scanner (Siemens Healthcare, Erlangen, Germany) using a 15-channel knee coil. Volunteers were positioned with their right calf (left in one case due to injury obscuring the anatomy) in the centre of the coil. Participants were asked to sit down for 10 minutes before the start of scanning. Repeated rest diffusion scans (TE =60ms, TR = 3050ms, voxel size 2x2mm2 with a 3mm slice thickness, time of acquisition 1:47) using b-values of 0, 200, 400, 600 and 800ms in 6 directions (orthogonal x, y, and z and diagonal xy, xz, and yz) were acquired for 30 minutes to establish baseline MD and FA values. The volunteer was then asked to hop up and down on the imaged leg until they were too tired to continue; this was decided by the volunteer. As soon as the volunteer ceased, their calf was positioned again in the knee coil, and repeated diffusion scans (as above) were acquired for 45 minutes as soon as possible from the end of exercise. A marker attached to their leg aided comparable positioning to the rest scans. Data were pre-processed using Tractor [http://www tractor-mri.org.uk/] and tensor fitting was performed using FSL [https://fsl.fmrib.ox.ac.uk/fsl/fslwiki/] using a weighted least-squares fit. Regions of interest in the tibialis anterior were drawn on the B0 images. Statistical analysis was performed using a two-way repeated measures ANOVA using the first 16 scans results for both pre- and post-exercise MD and FA.Results
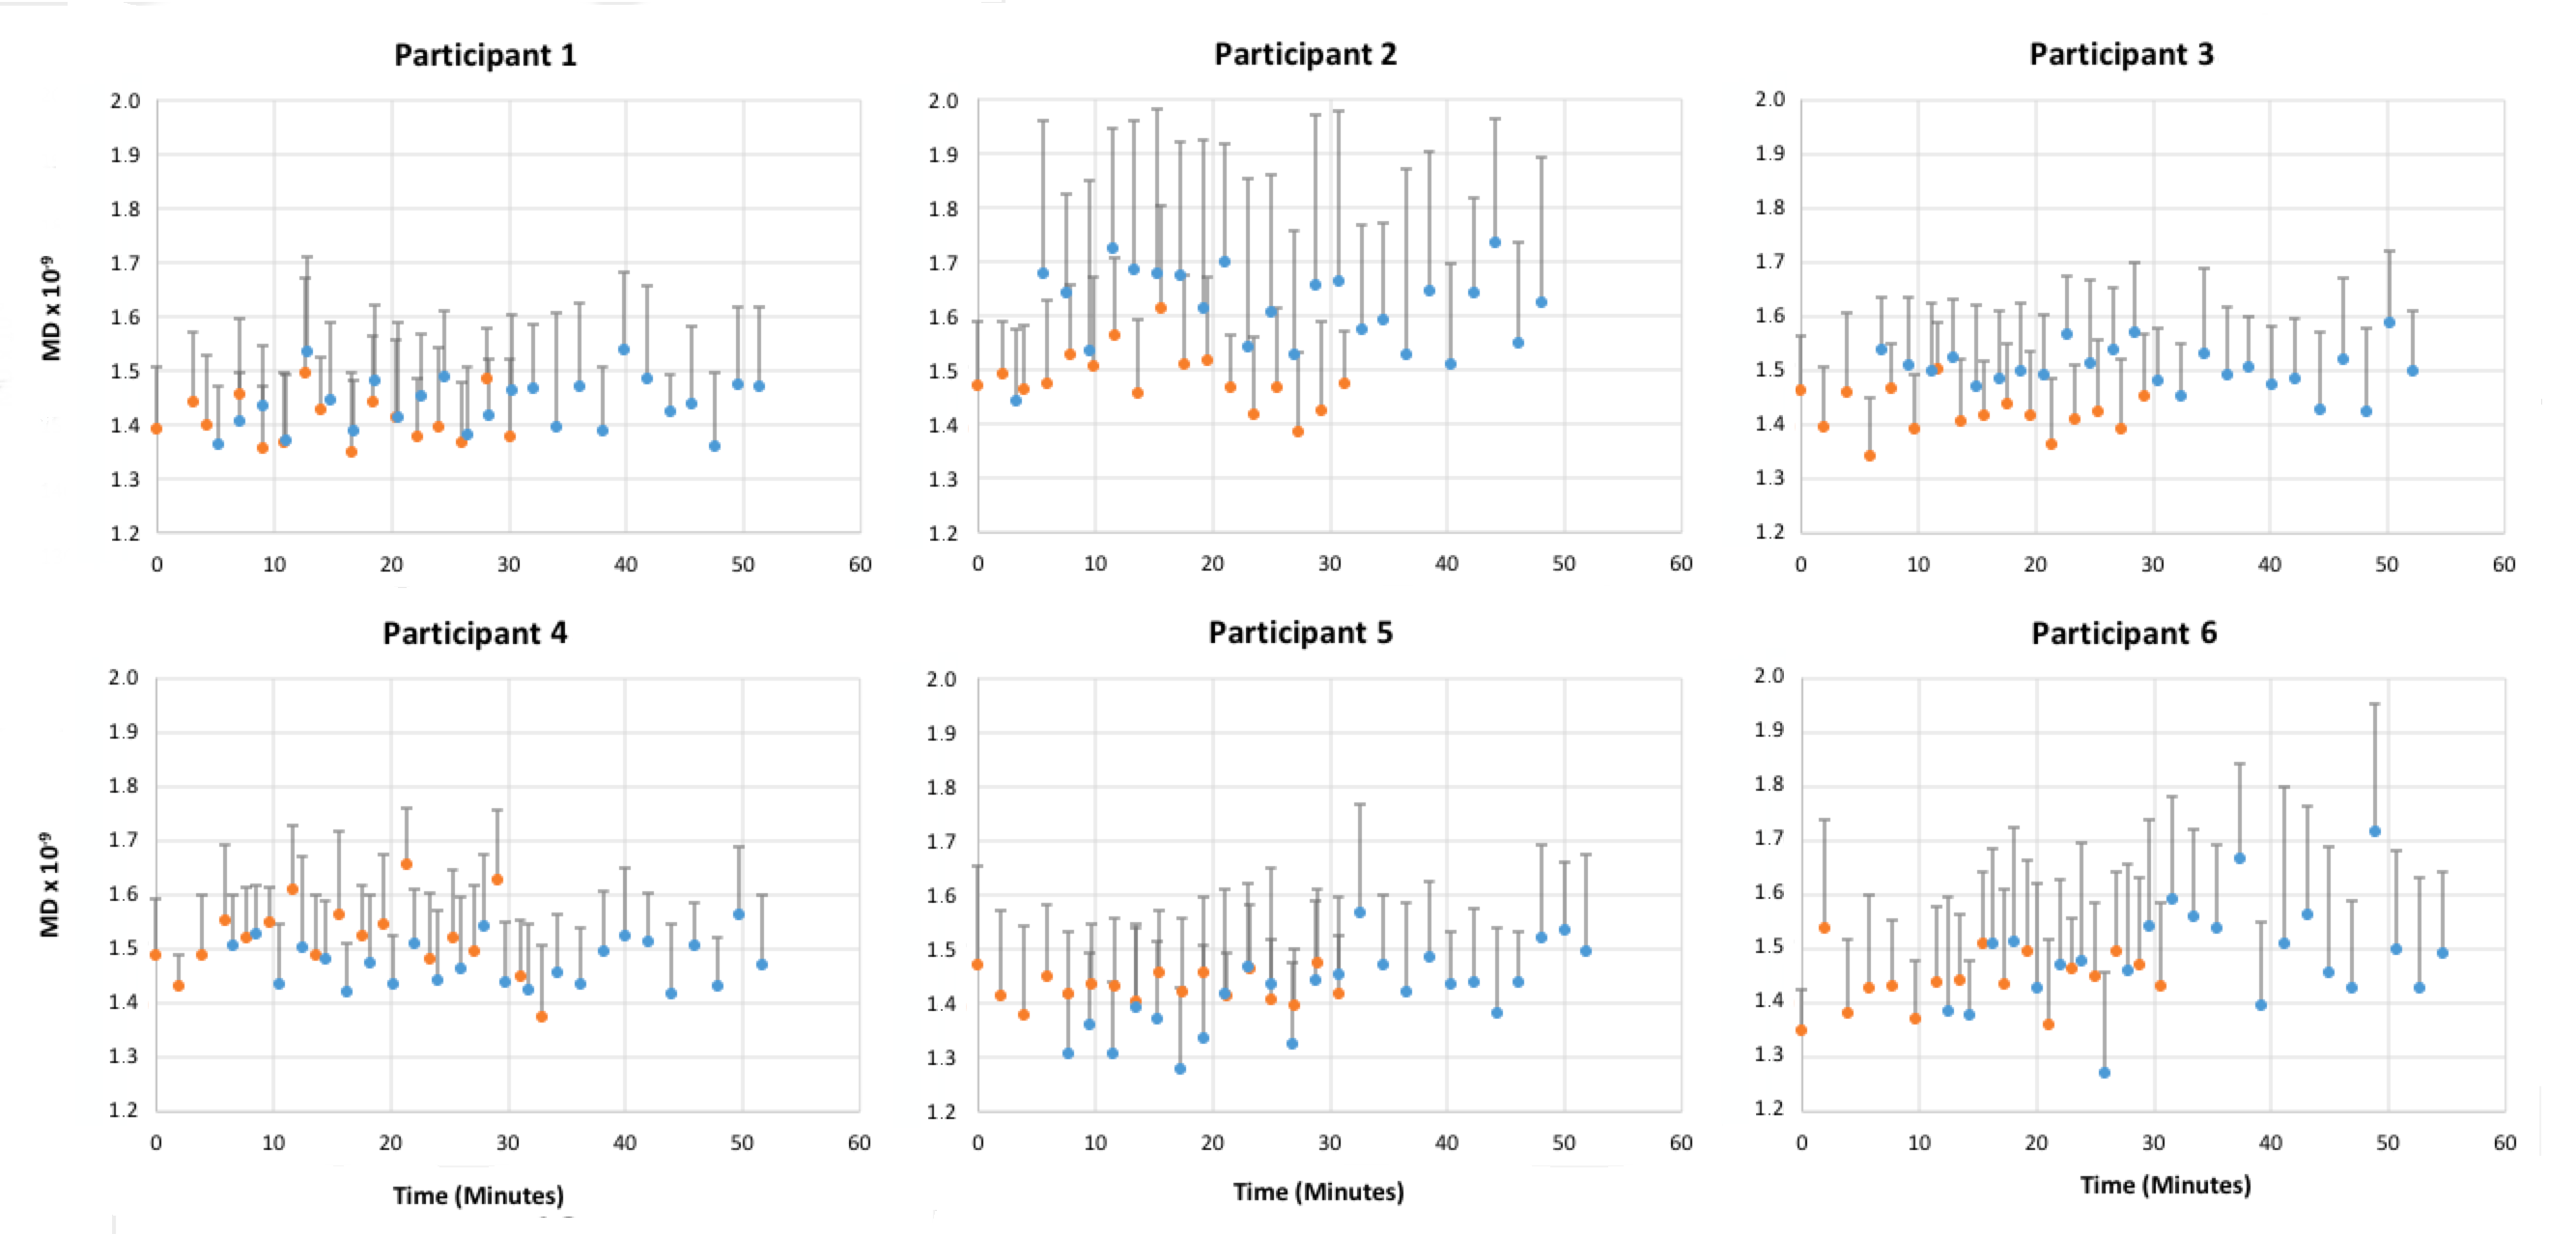
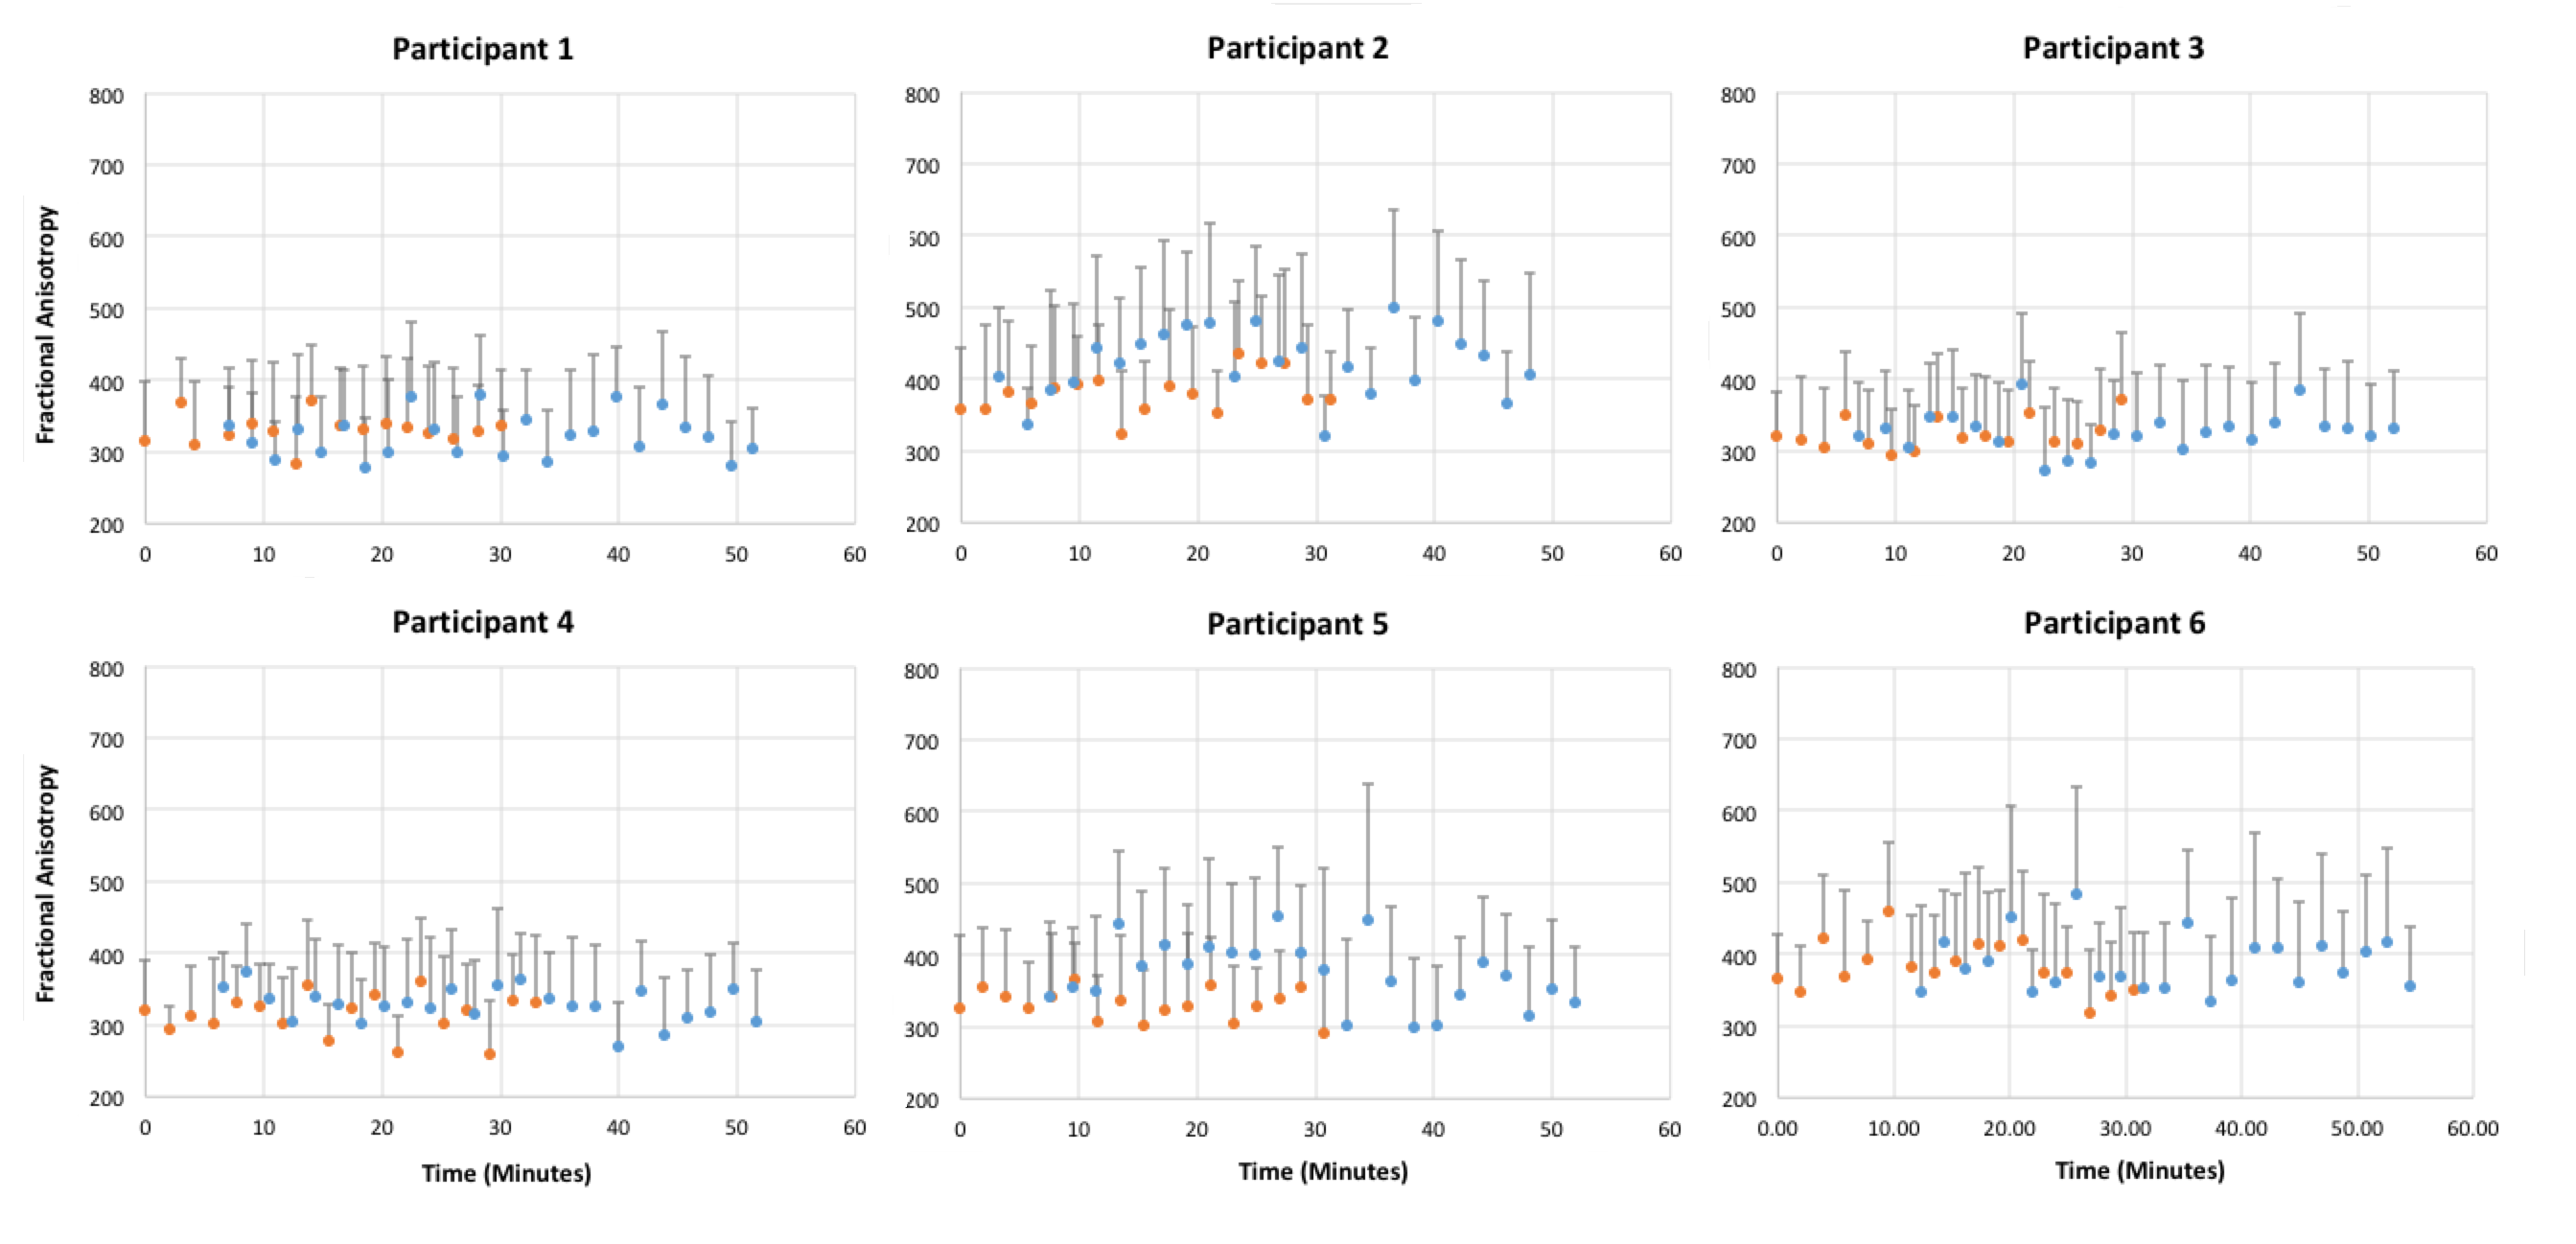
Participant demographics were as follows: age, 30.8 years ± 8.8 (SD); height, 1.71 m ± 0.12; and weight, 63.0 kg ± 11.1. Figure 1 shows example images (B0, MD and FA) from one volunteer. The first exercise scan was started at an average of 7.0 ± 3.1 (SD) minutes from the cessation of exercise.Figure 2 shows individual results of MD, and FA (Figure 3).
There was no statistically significant two-way interaction between exercise and time, for MD F(15, 75) = 0.941, p = 0.45; or FA F(15, 75) = 0.795, p = 0.53. There were no significant results for one-way repeated measures ANOVA tests for exercise or time.
Discussion/Conclusion
We have shown that if there is an effect of a moderate level of exercise, it is likely to be less than 2.1% (the mean difference of pre- and post-exercise MD values in relation to the mean MD of the rest group) for the MD calculations and 5.3% for FA calculations. Also, it should be noted that if there had been any significant difference in muscle after exercise, this would have been inflated by the study design (repeated sampling of the same effect by repeated diffusion scans) and would have needed correction. Consequently, we would have expected that any effect would have been detected. Therefore, we do not believe the level of exercise required for travel to an appointment or running and playing for paediatric patients etc, would have an evident effect on diffusion indices in muscle.Acknowledgements
AM was supported in part by a grant from Great Ormond St Hospital’s Biomedical Research Centre, UK. AM is also supported by a grant from the National Physical Laboratory, UKReferences
1. Bruschetta D, Anastasi G, Andronaco V, et al. Human calf muscles changes after strength training as revealed by diffusion tensor imaging. J Sports Med Phys Fitness 2018.
2. Fulford J, Eston RG, Rowlands AV, Davies RC. Assessment of magnetic resonance techniques to measure muscle damage 24 h after eccentric exercise. Scand J Med Sci Sports 2015; 25(1): e28-39.
3. Froeling M, Oudeman J, Strijkers GJ, et al. Muscle changes detected with diffusion-tensor imaging after long-distance running. Radiology 2015; 274(2): 548-62.
4. Yanagisawa O, Kurihara T, Kobayashi N, Fukubayashi T. Strenuous resistance exercise effects on magnetic resonance diffusion parameters and muscle-tendon function in human skeletal muscle. Journal of magnetic resonance imaging : JMRI 2011; 34(4): 887-94.
Figures