3165
Dynamic MR imaging of muscle contraction during electrical stimulation in facioscapulohumeral muscular dystrophy: a longitudinal study
Xeni Deligianni1,2, Francesco Santini1,2, Matteo Paoletti3, Francesca Solazzo3, Niels Bergsland4,5, Giovanni Savini3, Arianna Faggioli3, Giancarlo Germani3, Mauro Monforte6, Giorgio Tasca6, Enzo Ricci6, and Anna Pichiecchio3,7
1Department of Radiology/ Division of Radiological Physics, University Hospital of Basel, Basel, Switzerland, 2Biomedical Engineering, University of Basel, Allschwil, Switzerland, 3Advanced Imaging and Radiomics Center, Neuroradiology Department, IRCCS Mondino Foundation, Pavia, Italy, 4Buffalo Neuroimaging Analysis Center, Department of Neurology, Buffalo Neuroimaging Analysis Center, Department of Neurology, Jacobs School of Medicine and Biomedical Sciences, Buffalo, NY, United States, 5IRCCS, Fondazione Don Carlo Gnocchi ONLUS, Milan, Italy, 6Unità Operativa Complessa di Neurologia, Fondazione Policlinico Universitario A. Gemelli IRCCS, Rome, Italy, 7Department of Brain and Behavioral Sciences, University of Pavia, Pavia, Italy
1Department of Radiology/ Division of Radiological Physics, University Hospital of Basel, Basel, Switzerland, 2Biomedical Engineering, University of Basel, Allschwil, Switzerland, 3Advanced Imaging and Radiomics Center, Neuroradiology Department, IRCCS Mondino Foundation, Pavia, Italy, 4Buffalo Neuroimaging Analysis Center, Department of Neurology, Buffalo Neuroimaging Analysis Center, Department of Neurology, Jacobs School of Medicine and Biomedical Sciences, Buffalo, NY, United States, 5IRCCS, Fondazione Don Carlo Gnocchi ONLUS, Milan, Italy, 6Unità Operativa Complessa di Neurologia, Fondazione Policlinico Universitario A. Gemelli IRCCS, Rome, Italy, 7Department of Brain and Behavioral Sciences, University of Pavia, Pavia, Italy
Synopsis
Quantitative muscle MRI (T2&fat mapping) is progressively more used to assess disease involvement in muscle disorders, but in a static way, with dynamic assessment usually performed by clinical and instrumental examinations. To characterize muscle deformation we applied dynamic MRI synchronized with neuromuscular electrical stimulation evaluating the quadriceps muscles in 34 ambulatory subjects affected by facioscapulohumeral muscular dystrophy (FSHD) and ten healthy controls, longitudinally. Maximum values and rates of the strain differed between the two groups. Our results suggest that the evaluation of muscle ability to contract could be potentially used to monitor the evolution of muscle involvement in FSHD.
Introduction
Facioscapulohumeral muscular dystrophy (FSHD) is one of the most common forms of muscular dystrophy1, it is dominantly inherited and characterized by a non-linear, muscle-by-muscle progressive involvement2–4. Consequently, weakness mostly develops in a stepwise and asymmetric way5,6. Up-to-date, muscle magnetic resonance imaging (MRI), specifically T2 & fat fraction mapping, has been applied in various studies4,7,8 for monitoring the disease. In addition, physiological or force measurements 9,10 are complementary to the radiological measurements. Dynamic MRI of muscle deformation synchronized with neuromuscular electrical stimulation (NMES) can be applied to characterize muscle deformation with strain maps11,12. Our aim was to apply dynamic MRI coupled to NMES to characterize the deformation patterns of quadriceps muscles in FSHD patients longitudinally in order to investigate whether differences are observed in respect to controls.Methods
34 ambulatory FSHD patients (13 female/ 21 male, 44.9 ± 9.0 years old), with at least one abnormal muscle on STIR images (by evidence of any hyperintensity), and 10 healthy controls (HCs) (7 female/ 3 male, 51.0 ± 11.9 years old) were included in this study. The study was approved by the Ethics Committee and all patients gave written informed consent. The patients underwent dynamic MRI scans at up to 4 time points approximately 6 months apart (t0, t1, t2, t3), while HCs were scanned up to 3 times (T0, T1, T2).For the dynamic MRI acquisition, a commercial NMES device was synchronized with the MRI acquisition. The electrodes were attached to the muscle belly of the quadriceps muscle group on both right and left legs on the thigh. The current was set to a sufficient level to evoke muscle twitching without knee extension. For every subsequent scan, the current was set at the same level provided the muscle contraction was visible. All subjects were scanned on a 3T clinical MRI scanner with a three-directional single-slice high-temporal-resolution cine phase contrast velocity encoding acquisition (parameters: 2.3x2.3x5 mm3, temporal resolution: 42 ms, velocity encoding: 25 cm/ s, TR/ TE=10.6/ 7.21 ms, bandwidth/ pixel=400Hz/ Px, flip angle=10°, FOV = 225 x 300 mm2, 1 k-space line per segment, acquisition time 5 min, 94 temporal phases)12. Strain vectors were extracted from the velocity fields12. Maximum strain was calculated on a region of interest (ROI) including both the vastus lateralis and vastus intermedius. The rates at which the strain reached the maximum (buildup rate) and relaxed to zero (release rate) were also calculated by fitting a sigmoid curve to the corresponding portions of the strain curve11. All graphical plots, fitting and correlation coefficients calculations were performed with R/ R studio13.
Results
A weak correlation (0.178) between the applied current and the resulting strain was observed for FSHD patients, while there was no correlation (-0.024) for HCs (Fig. 1). The strain values were compared between subjects and HCs for the first two time points of FSHD patients (t0,t1) and controls (T0,T1), these being the most balanced datasets (Fig. 2-left). The maximum strain was reduced in the second visit (t1) for the patient group and increased for the HCs group (T1). Similarly, the applied current showed comparable but much smaller changes (Fig. 2).Single side datasets of the patients, that had at least 3 time points, were analyzed separately, since these datasets were the most numerous and complete (t0 (26 datasets), t1 (17), t2 (24)). There was a decrease of the strain over time (Fig. 3), which was more pronounced between the first and the second time point (i.e., decreased by 49%).
Finally, regarding the build-up and the release rates, the results of patients and controls were also compared for the two first time points (Fig. 4). While, for the patients there was no distinctive difference between the two time points (median build-up rate (t0,t1)=(800,808.8), median release rate(t0,t1)=(835.2,837.9)1/s), for the HCs the buildup rate was increased and the release rate was decreased (median build-up rate (T0,T1)=(787.2,854.2)1/s, median release rate(T0,T1)=(841.8,810.8))1/s.
Discussion
In this longitudinal study, the results of dynamic MRI of the quadriceps muscle contraction were different over time for FSHD subjects compared to HCs. For FSHD subjects the maximum strain reduced over time and the rates remained largely unchanged. For HCs maximum strain and build-up rate both increased whereas the release rate decreased.A limitation of the dynamic MRI method applied in this study is that it is not completely flexible on the choice of muscles to which it can be applied. The examined muscles have to be superficial and single muscles cannot be stimulated individually. In addition, in this study there was no measurement of the NMES-evoked force, so stimulation was standardized based on the current and visual output. A bias because of the current cannot be completely excluded, but nevertheless the correlation of applied current to resulting strain is at most weak.
Our results suggest that the dynamic measurement of the muscle ability to contract and deform could offer useful insight into the disease progression in superficial muscles of FSHD.
Conclusion
In conclusion, the presented quantitative analysis of strain MRI through evoked NEMS can represent a novel quantitative tool in the study toolbox of neuromuscular disease.Acknowledgements
This work was supported by the Swiss National Science Foundation (SNSF) grant n° 172876 and the Italian Ministry of Health (RC 2017-2019, RC 2020 and RF-2016-02362914).References
- Deenen JCW, Arnts H, van der Maarel SM, et al. Population-based incidence and prevalence of facioscapulohumeral dystrophy. Neurology 2014;83:1056–1059
- Sacconi S, Camaño P, de Greef JC, et al. Patients with a phenotype consistent with facioscapulohumeral muscular dystrophy display genetic and epigenetic heterogeneity. J. Med. Genet. 2012;49:41–46
- Tasca G, Monforte M, De Fino C, Kley RA, Ricci E, Mirabella M. Magnetic resonance imaging pattern recognition in sporadic inclusion-body myositis. Muscle Nerve 2015;52:956–962
- Tasca G, Monforte M, Ottaviani P, et al. Magnetic resonance imaging in a large cohort of facioscapulohumeral muscular dystrophy patients: Pattern refinement and implications for clinical trials. Ann. Neurol. 2016;79:854–864
- Dahlqvist JR, Andersen G, Khawajazada T, Vissing C, Thomsen C, Vissing J. Relationship between muscle inflammation and fat replacement assessed by MRI in facioscapulohumeral muscular dystrophy. J. Neurol. 2019;266:1127–1135
- Hamel J, Tawil R. Facioscapulohumeral Muscular Dystrophy: Update on Pathogenesis and Future Treatments. Neurother. J. Am. Soc. Exp. Neurother. 2018;15:863–871
- Andersen G, Dahlqvist JR, Vissing CR, Heje K, Thomsen C, Vissing J. MRI as outcome measure in facioscapulohumeral muscular dystrophy: 1-year follow-up of 45 patients. J. Neurol. 2016;3:438–447
- Janssen B, Voet N, Geurts A, van Engelen B, Heerschap A. Quantitative MRI reveals decelerated fatty infiltration in muscles of active FSHD patients. Neurology 2016;86:1700–1707
- Eichinger K, Heatwole C, Heininger S, et al. Validity of the 6 minute walk test in facioscapulohumeral muscular dystrophy. Muscle Nerve 2017;55:333–337
- Lassche S, Voermans NC, Schreuder T, et al. Reduced specific force in patients with mild and severe facioscapulohumeral muscular dystrophy. Muscle Nerve
- Deligianni X, Hirschmann A, Place N, Bieri O, Santini F. Dynamic MRI of plantar flexion: A comprehensive repeatability study of electrical stimulation-gated muscle contraction standardized on evoked force. PLOS ONE 2020;15:e0241832
- Deligianni X, Pansini M, Garcia M, et al. Synchronous MRI of muscle motion induced by electrical stimulation. Magn Reson Med 2017;77:664–672 doi: 10.1002/mrm.26154
- R Core Team (2020). R: A language and environment for statistical computing. R Foundation for Statistical Computing, Vienna, Austria. URL: https://www.R-project.org/
Figures
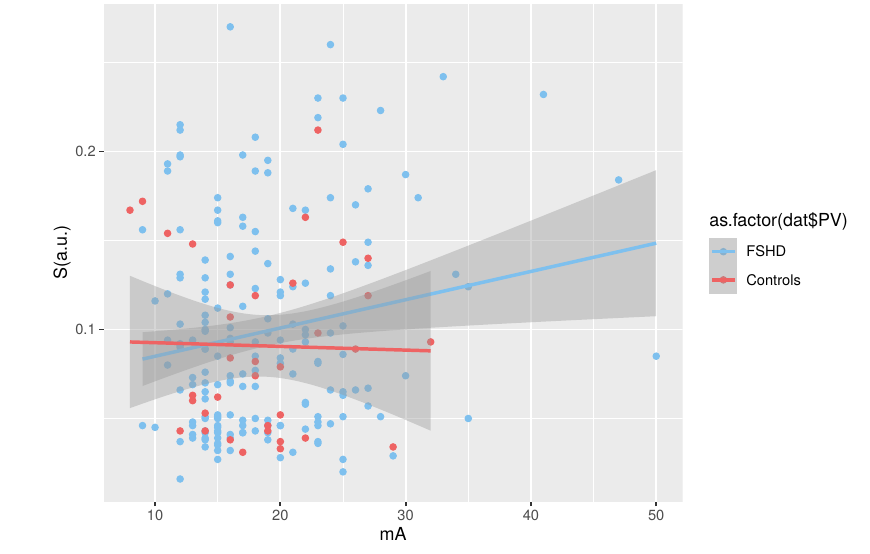
Figure 1: Principal strain versus the current that was applied for the stimulation and linear fitting for FSHD patients and healthy controls. For healthy controls, there was no correlation between the resulting strain and the current, while for FSHD patients there was only a weak positive (<0.2) correlation indicating that the strain values are reasonably independent from the applied current.
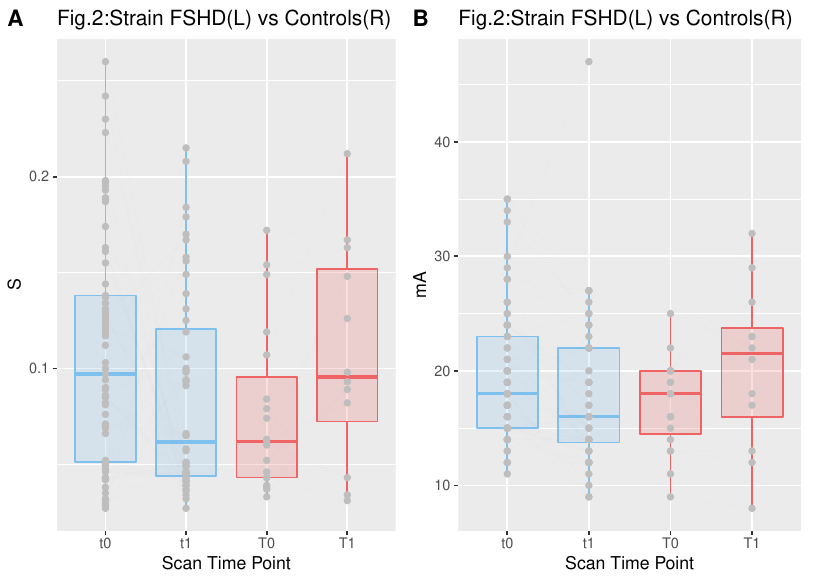
Figure 2. Maximum strain values for FSHD patients (blue-left) and healthy controls (red-right) for 2 different time points.
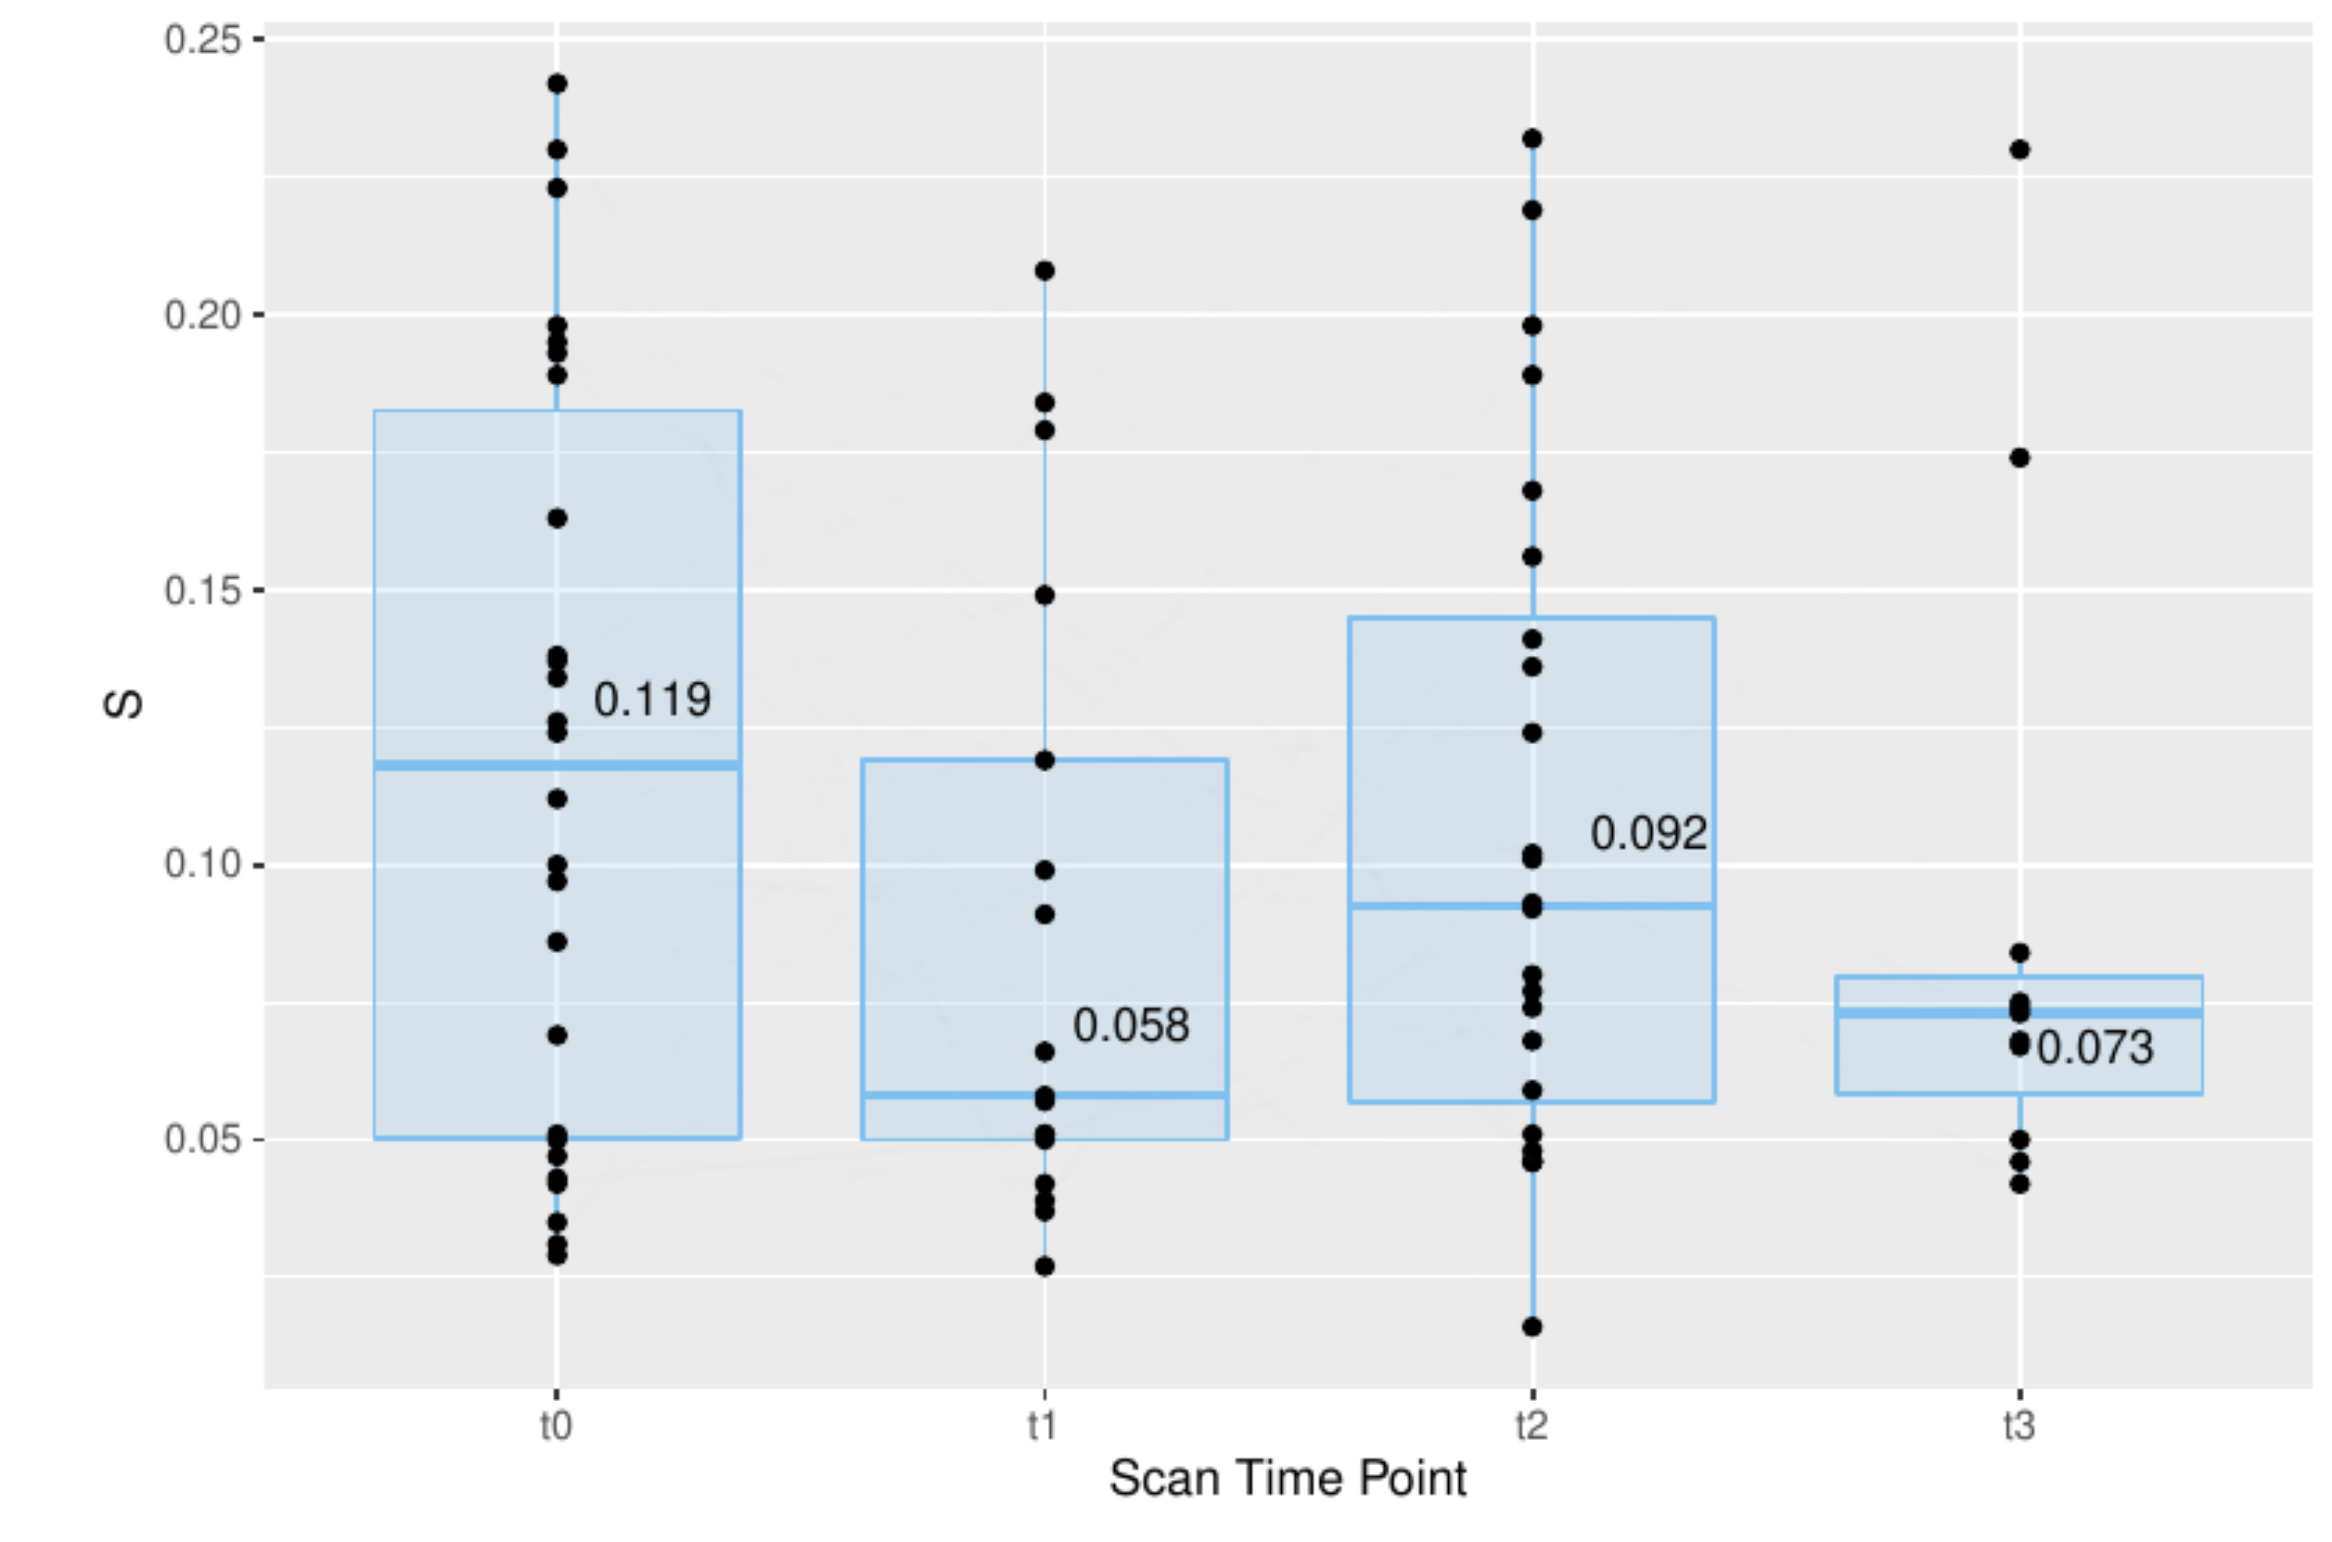
Figure 3. Maximum strain values for FHSD patients that were scanned at least three times. At time points 1-4, the principal strain value was respectively t0 (mean=0.119), t1(median=0.058), t2(median=0.092), t3(median=0.073).
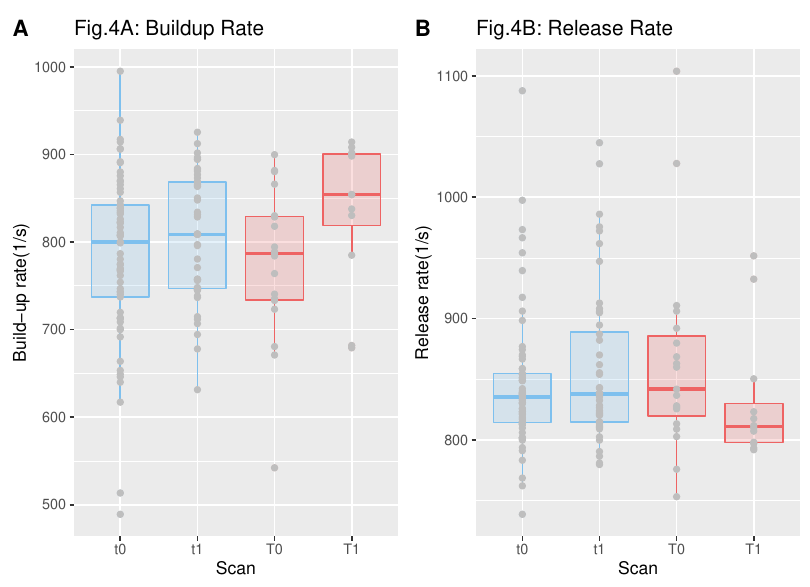
Figure 4. Build-up and release rates for the maximum strain of patients (blue) and healthy controls (red) for two different time points.