3162
Can familial Alzheimer variability affect brain networks? Exploration through Osaka Ab variant inoculation in mice.1Université Paris-Saclay, Commissariat à l’Energie Atomique et aux Energies Alternatives (CEA), Centre National de la Recherche Scientifique (CNRS), Molecular Imaging Research Center (MIRCen), Laboratoire des Maladies Neurodégénératives, Fontenay-aux-roses, France, 2University Grenoble Alpes, Inserm, U1216, Grenoble Institut Neurosciences (GIN), Grenoble, France
Synopsis
Early brain dysfunctions found in Alzheimer's disease are due to soluble pathological forms of b-amyloid peptide (Aβ). Among the familial Aβ mutations, the Osaka-Aβ variant is characterized by the intraneuronal accumulation of toxic Aβ without forming extracellular Aβ deposition. It affects synaptic function by modulating excitatory pathways leading to memory defects. Here, we performed a multimodal study to unveil brain network signatures of the pathology. Combining resting-state fMRI, gluCEST and diffusion analysis, we revealed that exposition to Osaka-Aβ leads to abnormal brain connectivity through impairment of the default mode and the hippocampal-memory networks.
Purpose
Alzheimer's disease (AD) is a neurodegenerative disease causing progressive synaptic loss and functional network modifications, leading to cognitive impairments. Developing noninvasive tools to understand AD functional and clinical heterogeneity is critical to improve patient classification in clinical trials. Intracerebral accumulation of b-amyloid peptide (Aβ) occurs early in the pathogenesis and different forms of Aβ can exist following genetic mutations in humans. Most mutations increase Aβ toxicity, but some of them can be protective1. Here, we used multimodal MRI markers to characterize the functional impacts of different Aβ variants on network communication and brain metabolism in a transgenic mouse model. We show that Osaka-Aβ induce a reduction of functional connectivity in the hippocampus and to a general reorganization of connectivity patterns. These changes were associated to modification of diffusion parameters. Age-related changes of glutamate metabolism were also detected and were modulated by Aβosa or Aβice inoculations.Material & Methods
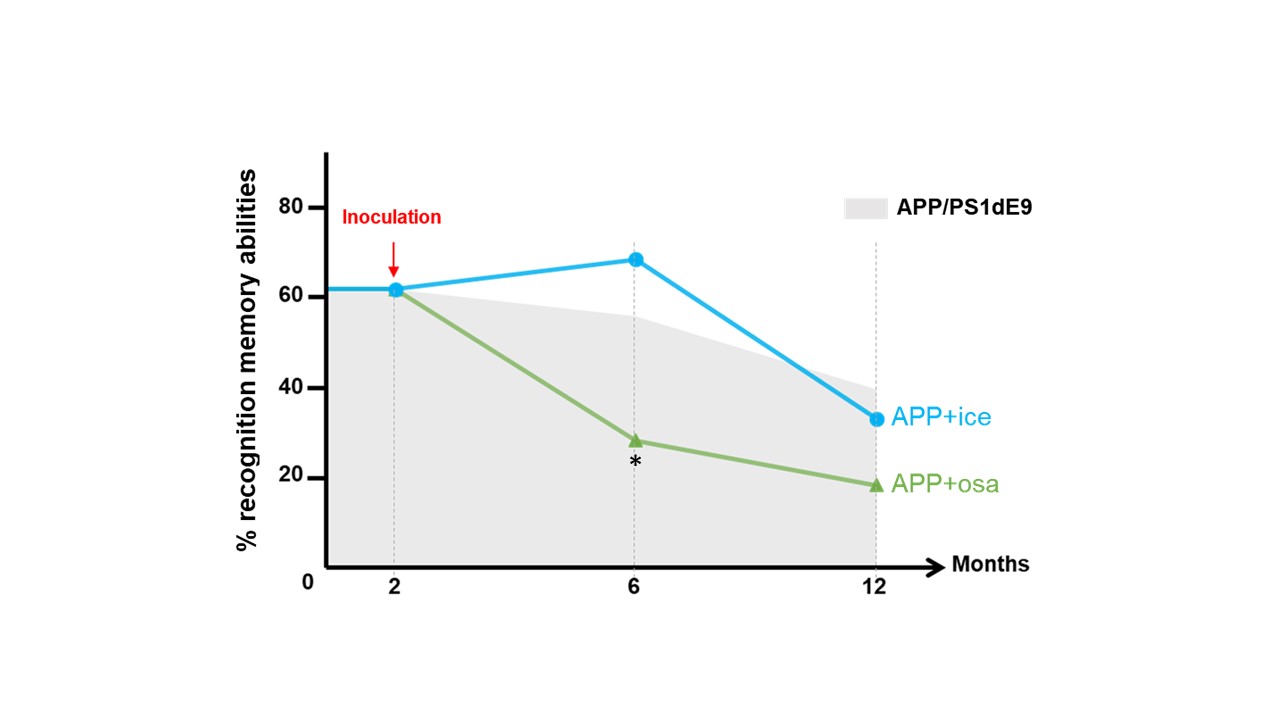
Animals and cognitive studies: Two-month-old APPswe/PS1dE9 mice were inoculated in the dentate gyrus with Aβ variants bearing toxic Osaka (E22D2, n=9) or protective Icelandic (A2T1, n=6) mutations. These mice were compared to their age-matched littermates APPswe/PS1dE9 inoculated with PBS (n=6). Longitudinal behavioral assessment was performed on these mice at 4 and 9 months post-inoculation (mpi). Novel object recognition task revealed an impairment of APPosa starting at 4 mpi (Fig. 1) whereas spatial memory was altered at 9 mpi (data not shown). APPice cognition were not altered in both task.MRI acquisition: Animals were scanned at 4 and 9 mpi on an 11.7T spectrometer (Bruker) using a cryoprobe. First, anatomical images were recorded using a multi-spin-multi-echo sequence. Then, resting state fMRI (rsfMRI) data were acquired using echo-planar imaging (GE-EPI, TE/TR=10/1000ms, resolution=0.2x0.2x0.7 mm3). GluCEST images were obtained from Magnetization Transfer Ratio3 at ±3 ppm calculated from a Zspectrum acquired between -5 and 5 ppm (B1=5 µT, Tsat=1 s, WASSR correction for B0 inhomogeneity). Diffusion tensor images (DTI) were acquired using echo-planar imaging (TE/TR=30/3200ms, resolution 0.1x0.1x0.5 mm3) in 35 directions.
MRI data processing and analysis: Spatial normalization of the anatomical images was performed to generate a high-resolution template. Then, all modalities (fMRI, gluCEST and DTI images) were co-registered to this template. The Python Sammba-MRI pipeline4 was used to perform all registration steps. Multi-subject dictionary learning was performed with Nilearn5 on preprocessed rsfMRI using 20 sparse components. Seed-based analysis was performed among functional regions identified in these components. Then brain template was automatically segmented into 48 bilateral regions based on the Allen mouse brain atlas. Partial correlation analysis was performed between 28 bilateral key regions of interest (ROIs) involved in AD extracted from this atlas. Hippocampal functional connectivity per animal was calculated by averaging Fisher z-transformed correlation to ROI. Voxelwise analysis of fractional anisotropy (FA) and axial diffusivity (AxD) calculated from preprocessed DTI was carried out in FSL using the Tract-Based Spatial Statistics (TBSS) pipeline6,7.
Statistical analysis: Mean correlation matrix of resting state functional connectivity (FC) for each group and gluCEST signal in each ROI were compared using a two-sample t-test (p<0.05) corrected for multiple comparisons (Bonferroni). TBSS group comparison were performed using a permutation test (Threshold-Free Cluster Enhancement, p<0.05) with false discovery rate correction.
Results
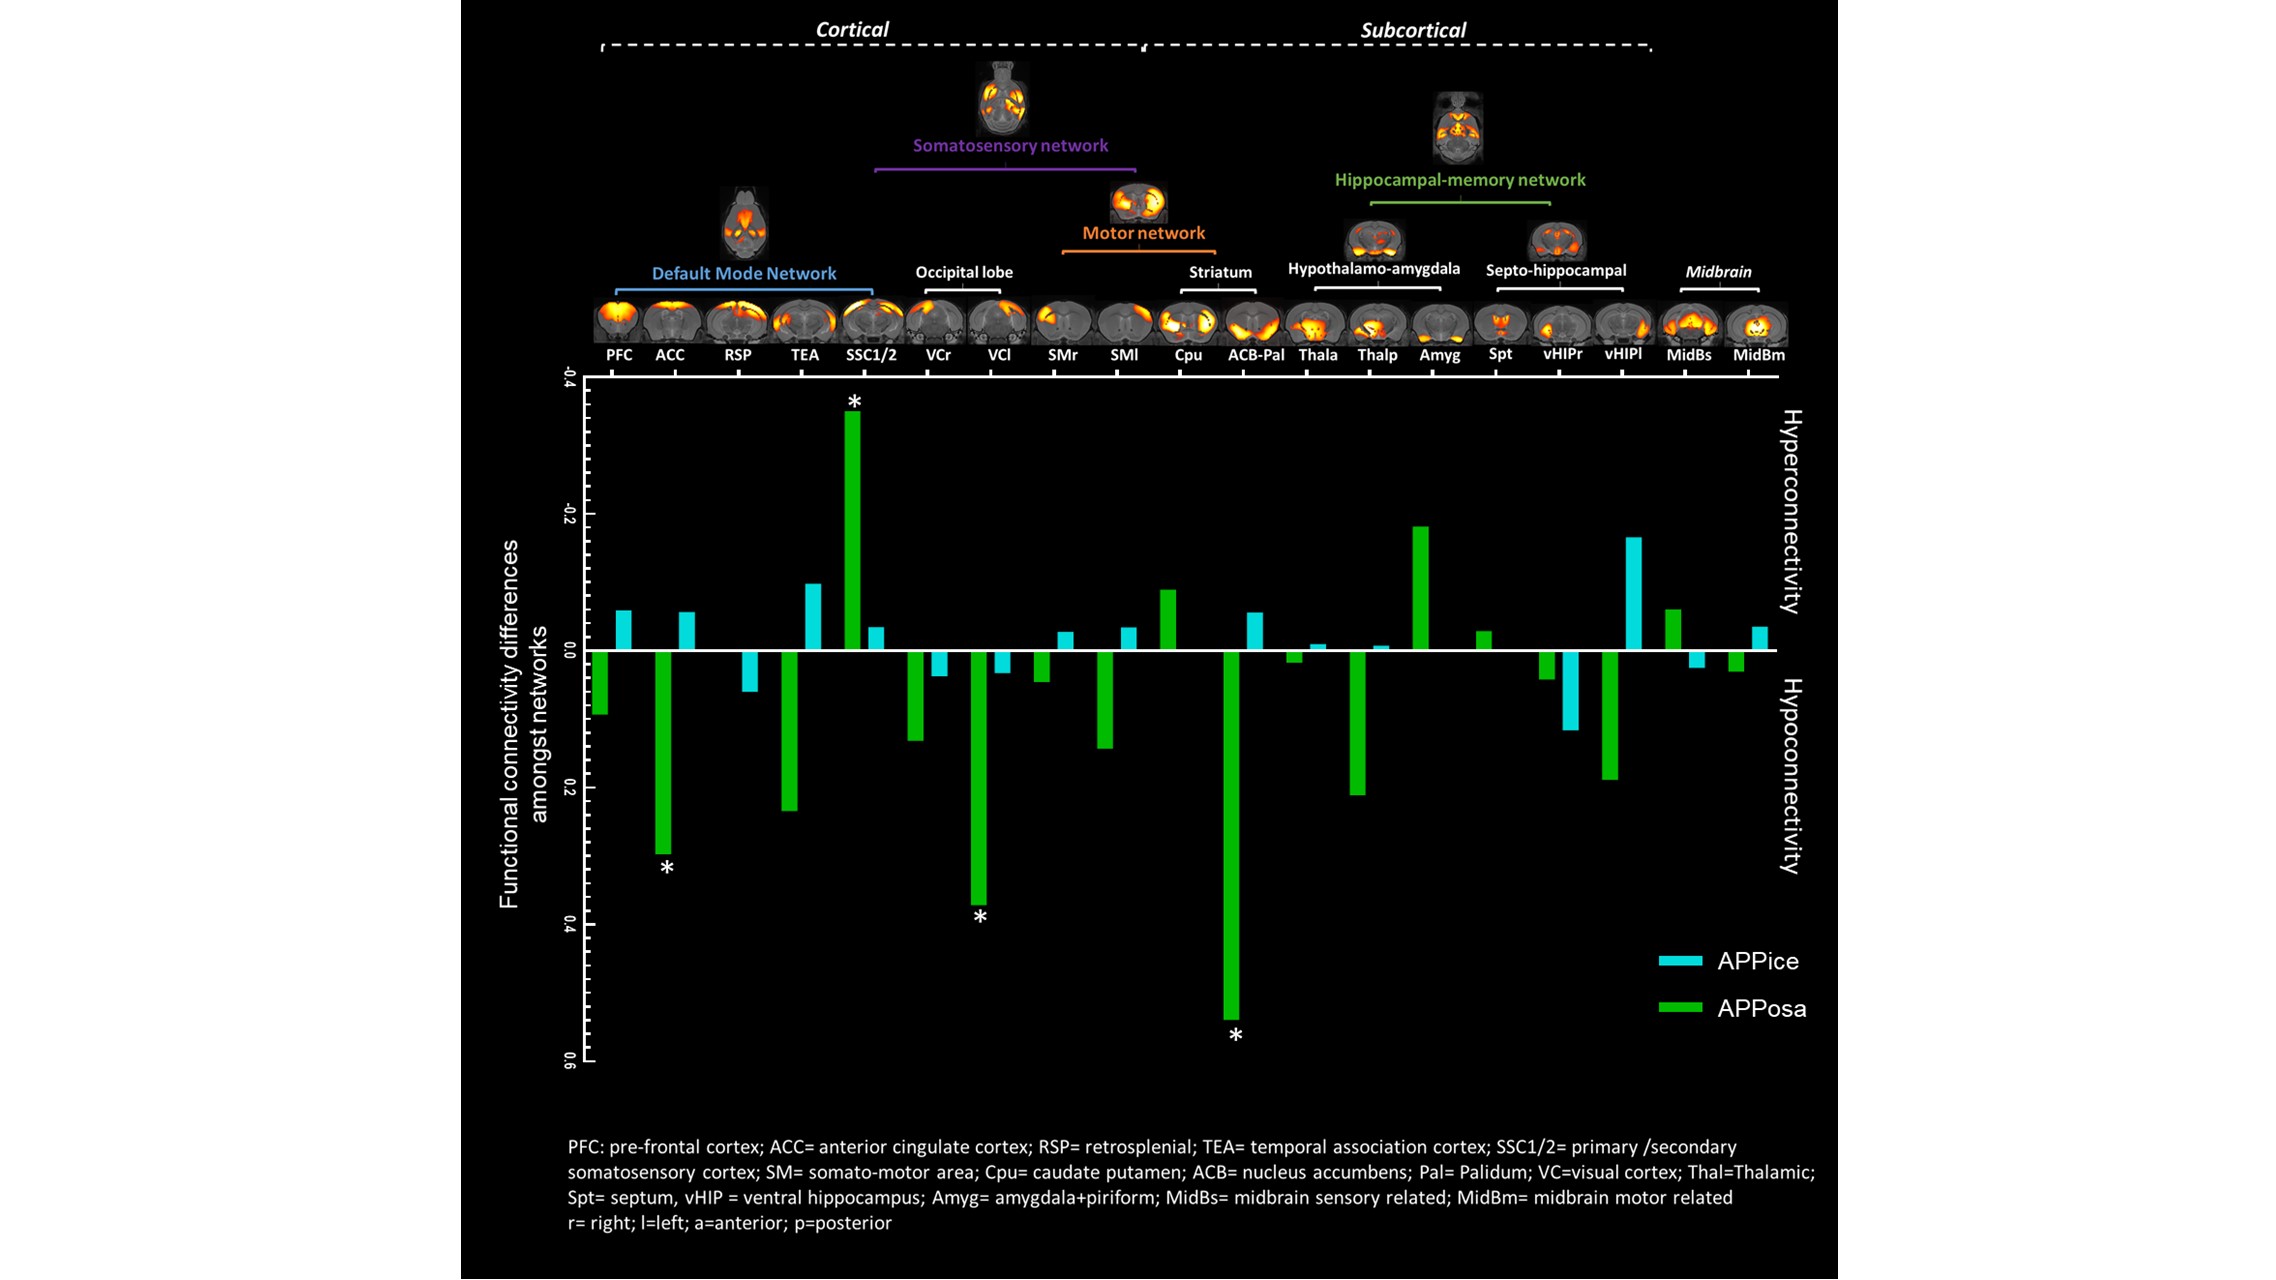
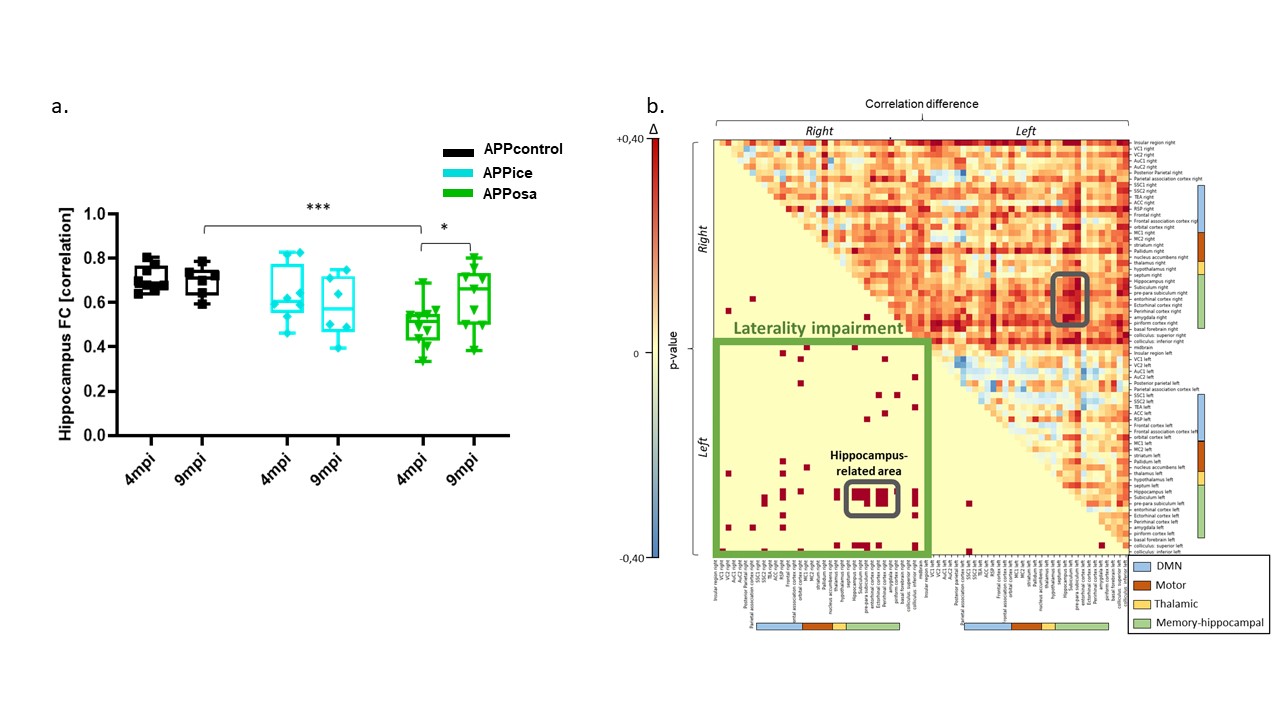
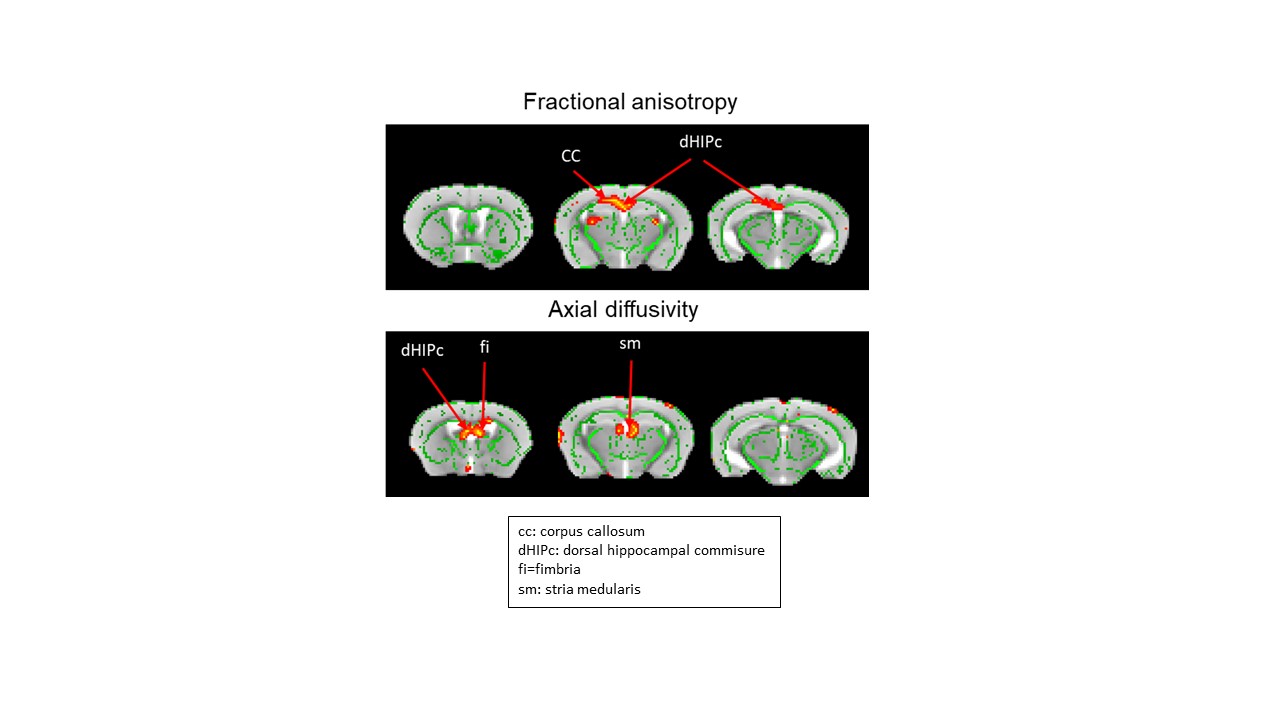
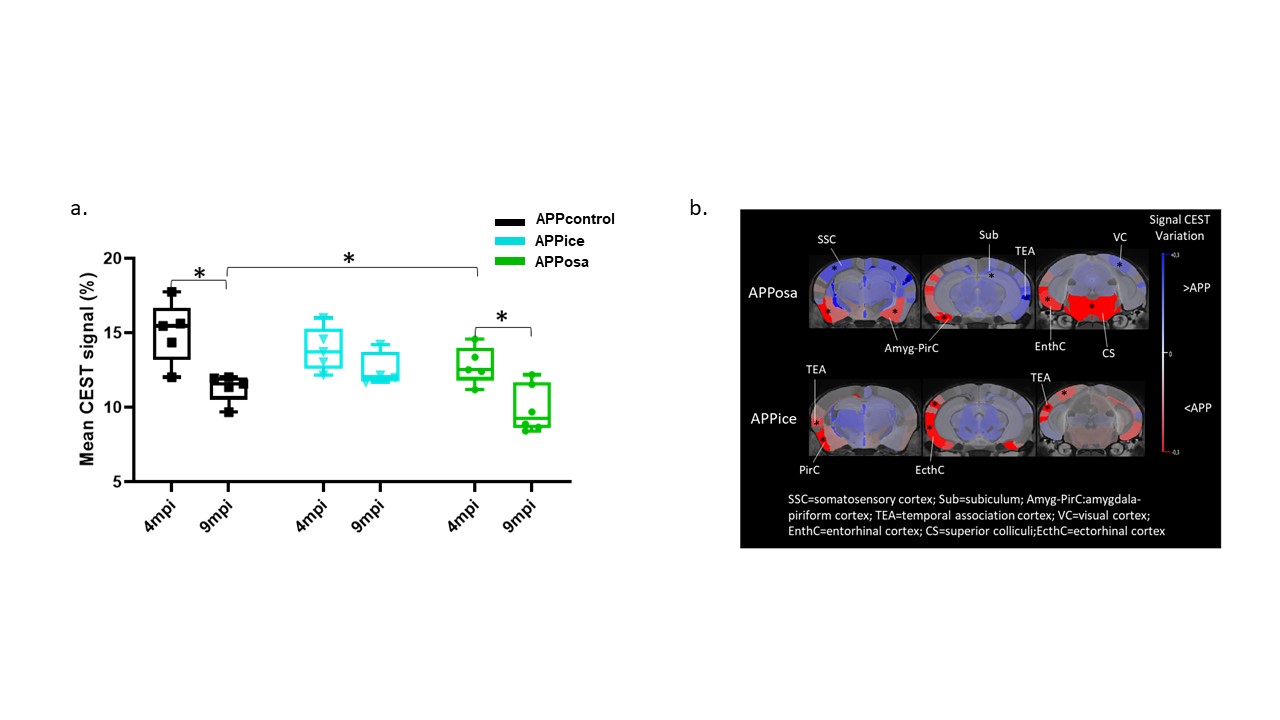
Decomposition of brain signal into 25 components revealed nine cortical functional components, three of which overlapped with elements of default mode network (DMN), and ten sub-cortical components composed of thalamus, hippocampus, amygdala, striatum and midbrain networks (Fig. 2). Seed-based analysis for inoculum seeds showed significant alterations of FC including hypo and hyperconnectivities in memory-related hippocampal network and DMN of APPosa mice compared to APPice at 4mpi (Fig. 2). Furthermore, Osaka-Aβ led to a decrease of hippocampus connectivity at 4mpi followed by a recovery at 9mpi (Fig. 3a). Atlas-based functional connectivity analysis demonstrated significant disruption of laterality in the hippocampus, the subiculum and the ectorhinal cortex, which are related to the memory pathway (Fig. 3b). We also detected loss of FA in the corpus callosum and the dorsal hippocampal commissure of Osaka-Aβ inoculated animals (Fig. 4). GluCEST signal decreased at 9 mpi in APPabeta and APPosa mice (Fig. 5a). Moreover, APPosa mice exhibited a significant decrease of gluCEST signal in the somatosensory cortex (-22%, p<0.01) and the subiculum (-24%, p<0.01) whereas increases in amygdala (+30%, p<0.01) and entorhinal cortex (+23%, p<0.01) were observed (Fig. 5b).Discussion/Conclusion
Our study provides a multimodal investigation of Osaka-Aβ related-pathology compared to protective Icelandic-Aβ effect. Osaka-Aβ led to variation of functional connectivity and glutamate levels at 4 mpi and to loss of fiber in the fornix system (fimbria, dHIPc). The hippocampus connectivity recovery observed at 9 mpi in APPosa may result from a loss of local Aβ effect with age or an increase of non-relevant connection to compensate earlier functional alteration. Correlation studies between glutamate level and functional connectivity will be performed in the future as Osaka-Aβ has been found to mediate neuronal hyperactivation via glutamate modulation 8.We highlight the abilities of Aβ to modulate network following a single inoculation, which emphasize the possibility to models Aβ pathology in animals. Moreover, while Osaka-Aβ exhibits toxic patterns, Icelandic-Aβ maintains its protectives effects until 4mpi. These results indicating the time-lapse where Aβ have a crucial impact on slowing or accelerating the pathology.
Acknowledgements
Fondation Vaincre-AlzheimerReferences
1. Thorlakur J. et al. A mutation in APP protects against Alzheimer's disease and age-related cognitive decline. Nature 2012 2;488(7409):96-9
2. Tomiyama, T et al. A new amyloid beta variant favoring oligomerization in Alzheimer’s-type dementia. Ann. Neurol. 2008, 63, 377–387.
3. Kim, M. et al. Water saturation shift referencing (WASSR) for chemical exchange saturation transfer (CEST) experiments. Magn. Reson. Med., 2009. 61(6):1441-50
4. Celestine et al. Sammba-MRI, a library for small animal neuroimaging data processing in Python. 2020 Frontiers in NeuroInformatics. 2020;14:24. PMID: 32547380.
5. Abraham A et al., Machine learning for neuroimaging with scikit-learn. Front. Neuroinform., 2014, 8:14.
6. Smith, S.M. et al. Tract-based spatial statistics: voxelwise analysis of multi-subject diffusion data. Neuroimage. 2006 15;31(4):1487-505.
7. Smith, S.M. et al., Advances in functional and structural MR image analysis and implementation as FSL. NeuroImage, 2004 23(S1):208-219.
8. Zott, B et al. A vicious cycle of β amyloid-dependent neuronal hyperactivation. Science 2019, 9;365(6453):559-565
Figures