3156
Dynamic functional network connectivity differences and its association with neurocognitive changes in cirrhotic patients1Department of Radiology, Fujian Medical University Union Hospital, Fuzhou, China, 2SIEMENS Healthcare, Shanghai, China
Synopsis
We aimed to explore dynamic functional network connectivity (dFNC) differences and to elucidate their association with neurocognitive changes in cirrhotic patients. Sliding window correlation approach was employed to calculate dFNC. FNC states were determined by k-means clustering method, and then state analysis was conducted. The patients showed decreased FNC in State 2 and state 3. The patients spent significantly longer time in State 4 that was with weakest FNC. We observed a significant correlation between Psychometric Hepatic Encephalopathy Score and fraction time/mean dwell time in State 4. Aberrant dFNC may be the underlying mechanism of neurocognitive impairments in cirrhosis.
Introduction
The functional network connectivity (FNC), which is used to identify the functional interaction between distinct networks,1 has also been analyzed in cirrhosis to uncover the mechanisms of neurocognitive dysfunctions. However, static connectivity exclusively evaluates average brain activities over time within the observation period and thus does not fully capture temporal properties of connectivity.2 Brain functional connectivity is highly dynamic3 and facilitates in the functional integration, coordination, and response to internal and external stimuli at different time scales. To our best knowledge, however, only one study investigating alterations in the dynamic functional connectivity (FC) in MHE4 has been conducted to date. The report revealed that MHE patients trended to remain in the functional state, wherein the DMN subsystems were less connected, for longer period time. Although the above study proposed that aberrant dynamic FC within DMN is an additional characteristic of MHE, changes in dynamic FNC (dFNC) between distinct networks in the cirrhotic patients were not evaluated. Several studies have shown that dFNC analysis is a novel approach in assessing the underappreciated flexibility in relation to the functional coordination among different neural systems in the human brain, thereby improving our understanding of neuropsychiatric disorders [e.g., Huntington's disease, epilepsy and major depressive disorder.5-7 In this context, the current study aimed to perform the first investigation on dFNC alterations in cirrhotic patients without overt hepatic encephalopathy (OHE) and their association with neurocognitive impairments, which may provide novel information on the pathophysiology of cirrhosis-related neurological dysfunction.Methods
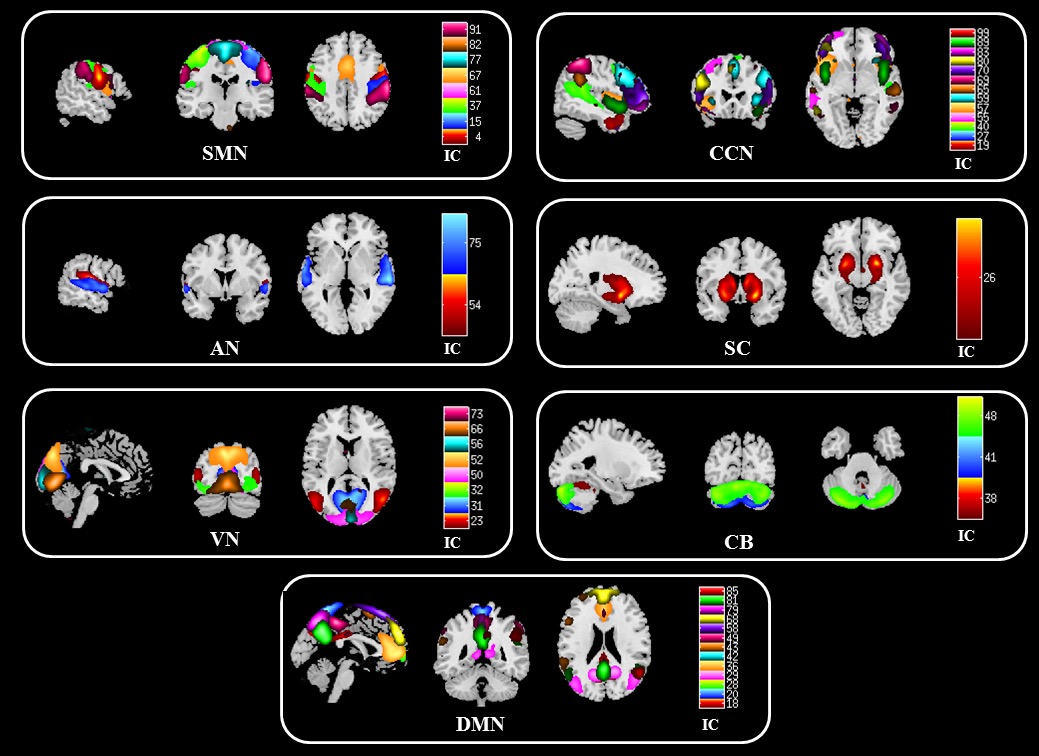
Fifty-four cirrhotic patients and 42 healthy controls underwent resting-state functional magnetic resonance imaging. Psychometric hepatic encephalopathy score (PHES) was used to assess neurocognitive function. Independent component analysis was performed to identify the components of seven intrinsic brain networks, including sensorimotor (SMN), auditory, visual, cognitive control (CCN), default mode (DMN), subcortical (SC), and cerebellar networks. Sliding window correlation approach was employed to calculate dFNC. FNC states were determined by k-means clustering method, and then functional state analysis was conducted to measure dynamic indices.Results
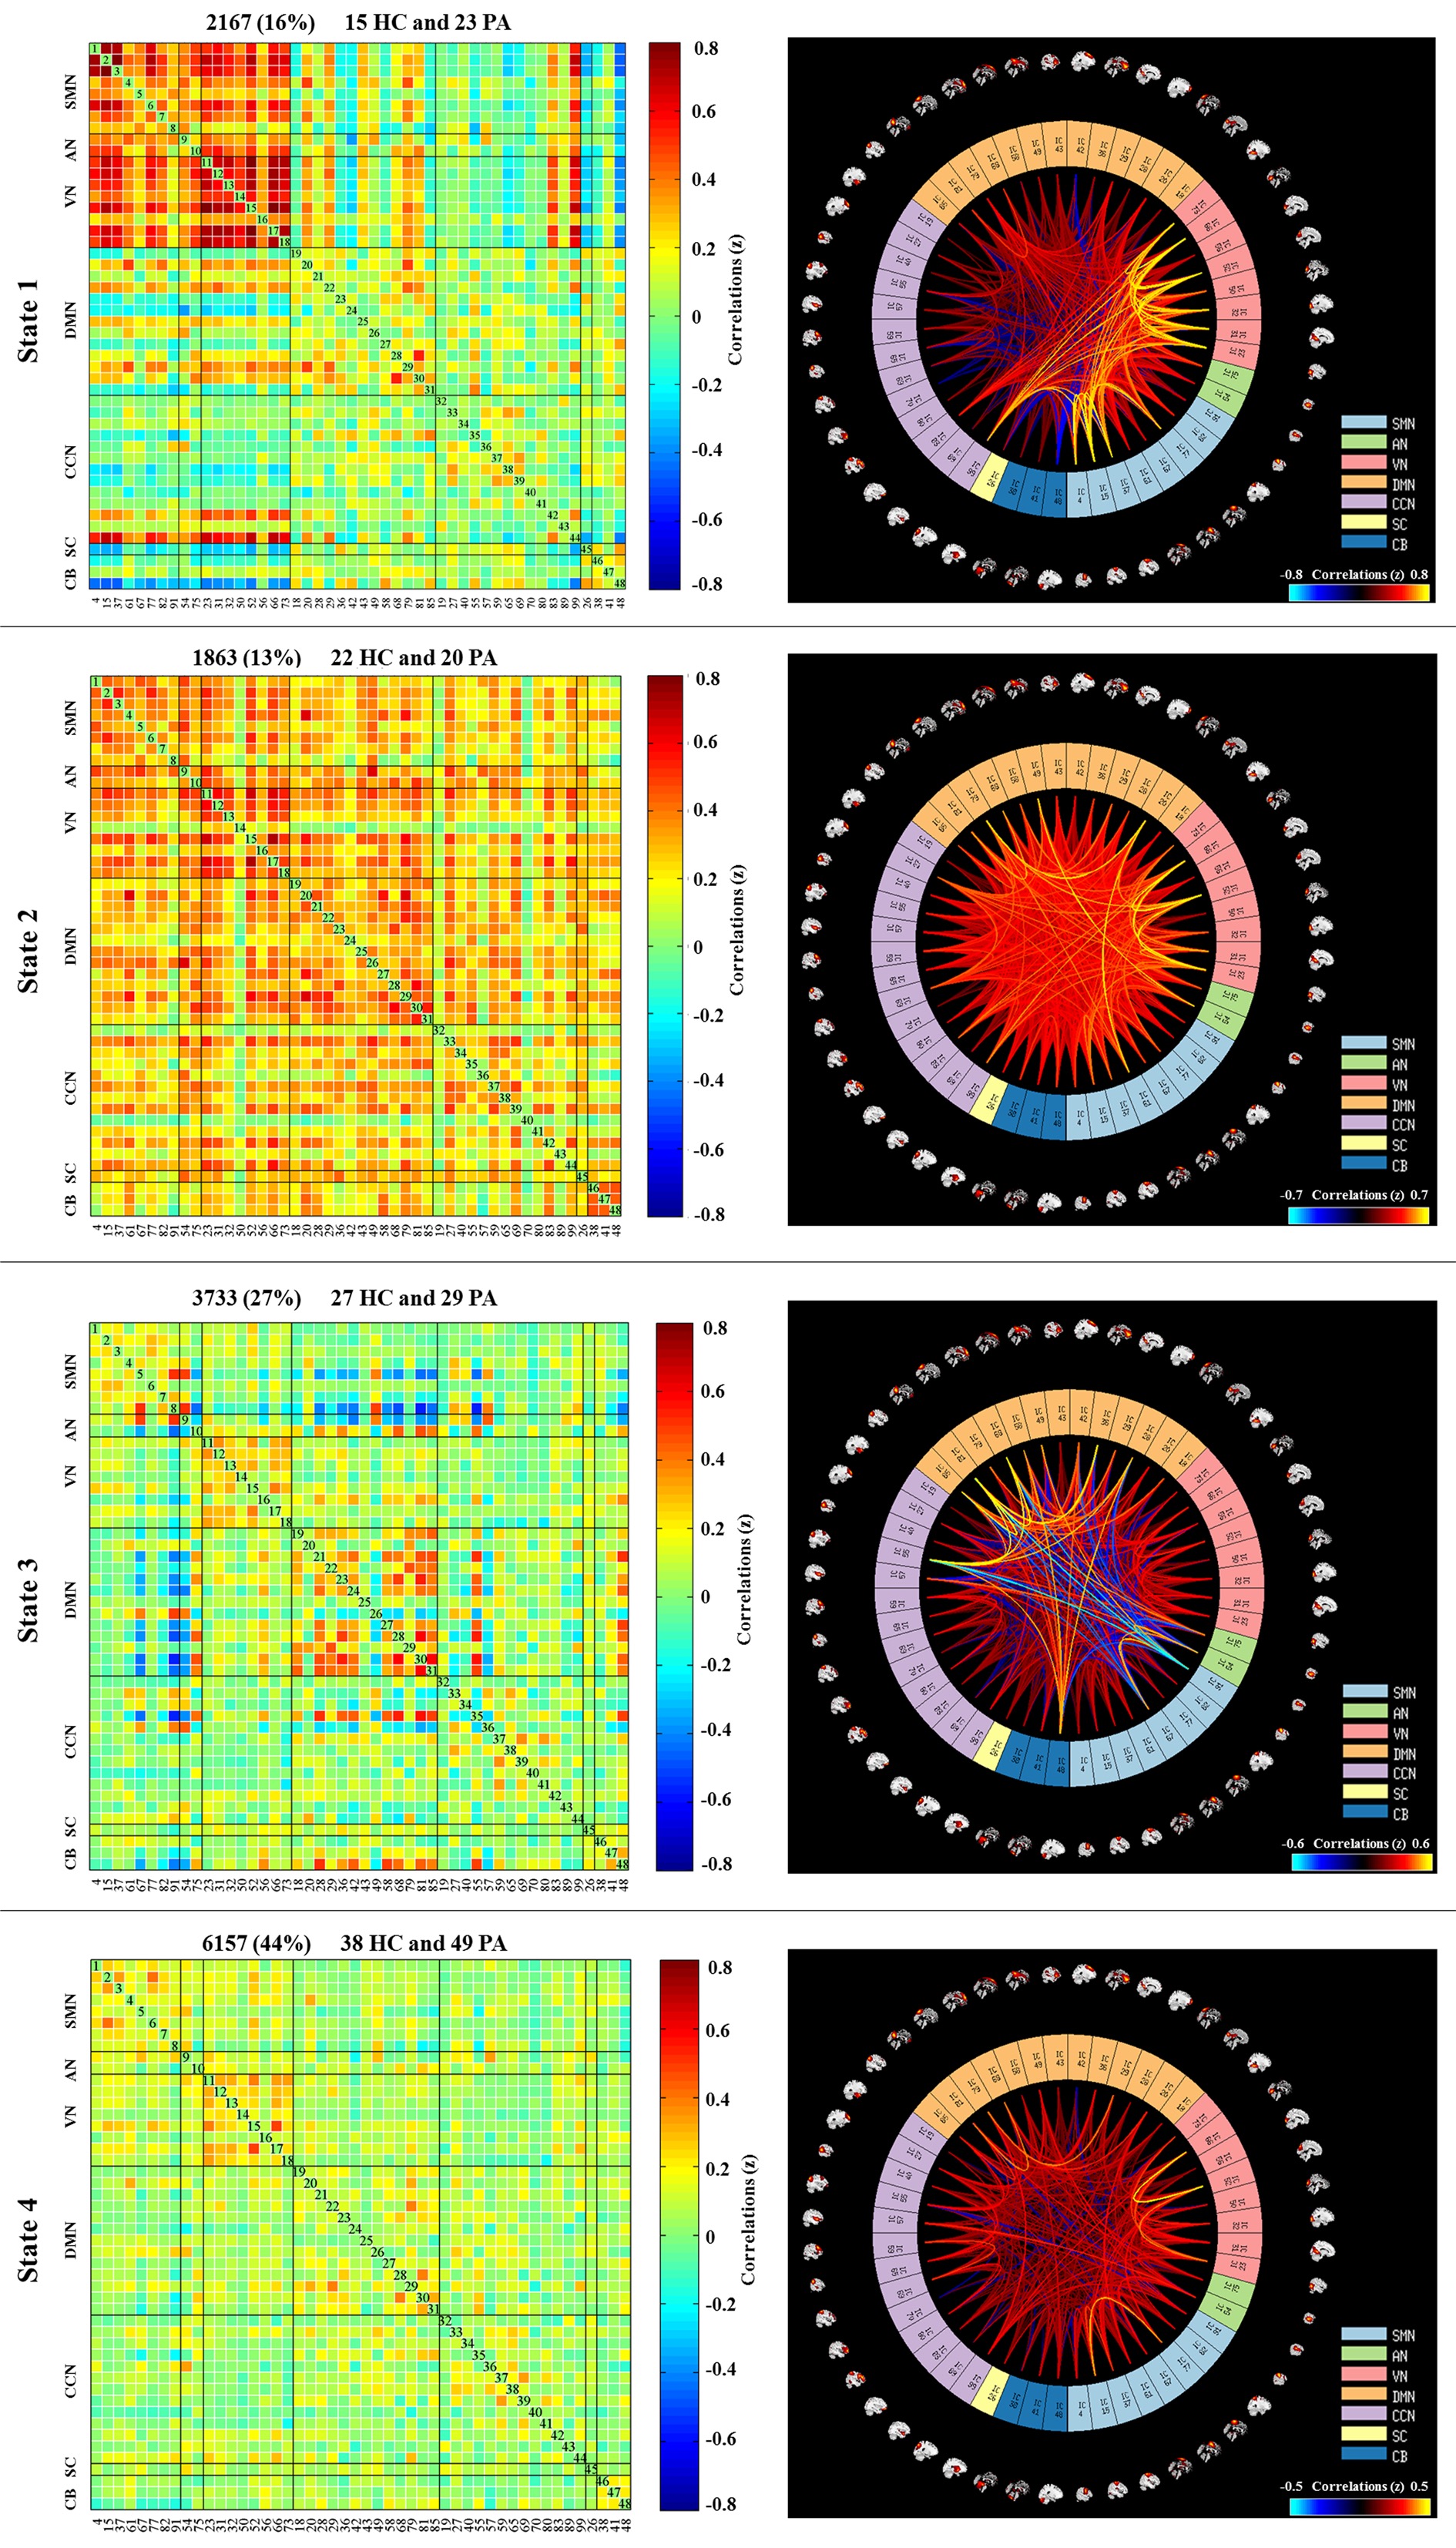
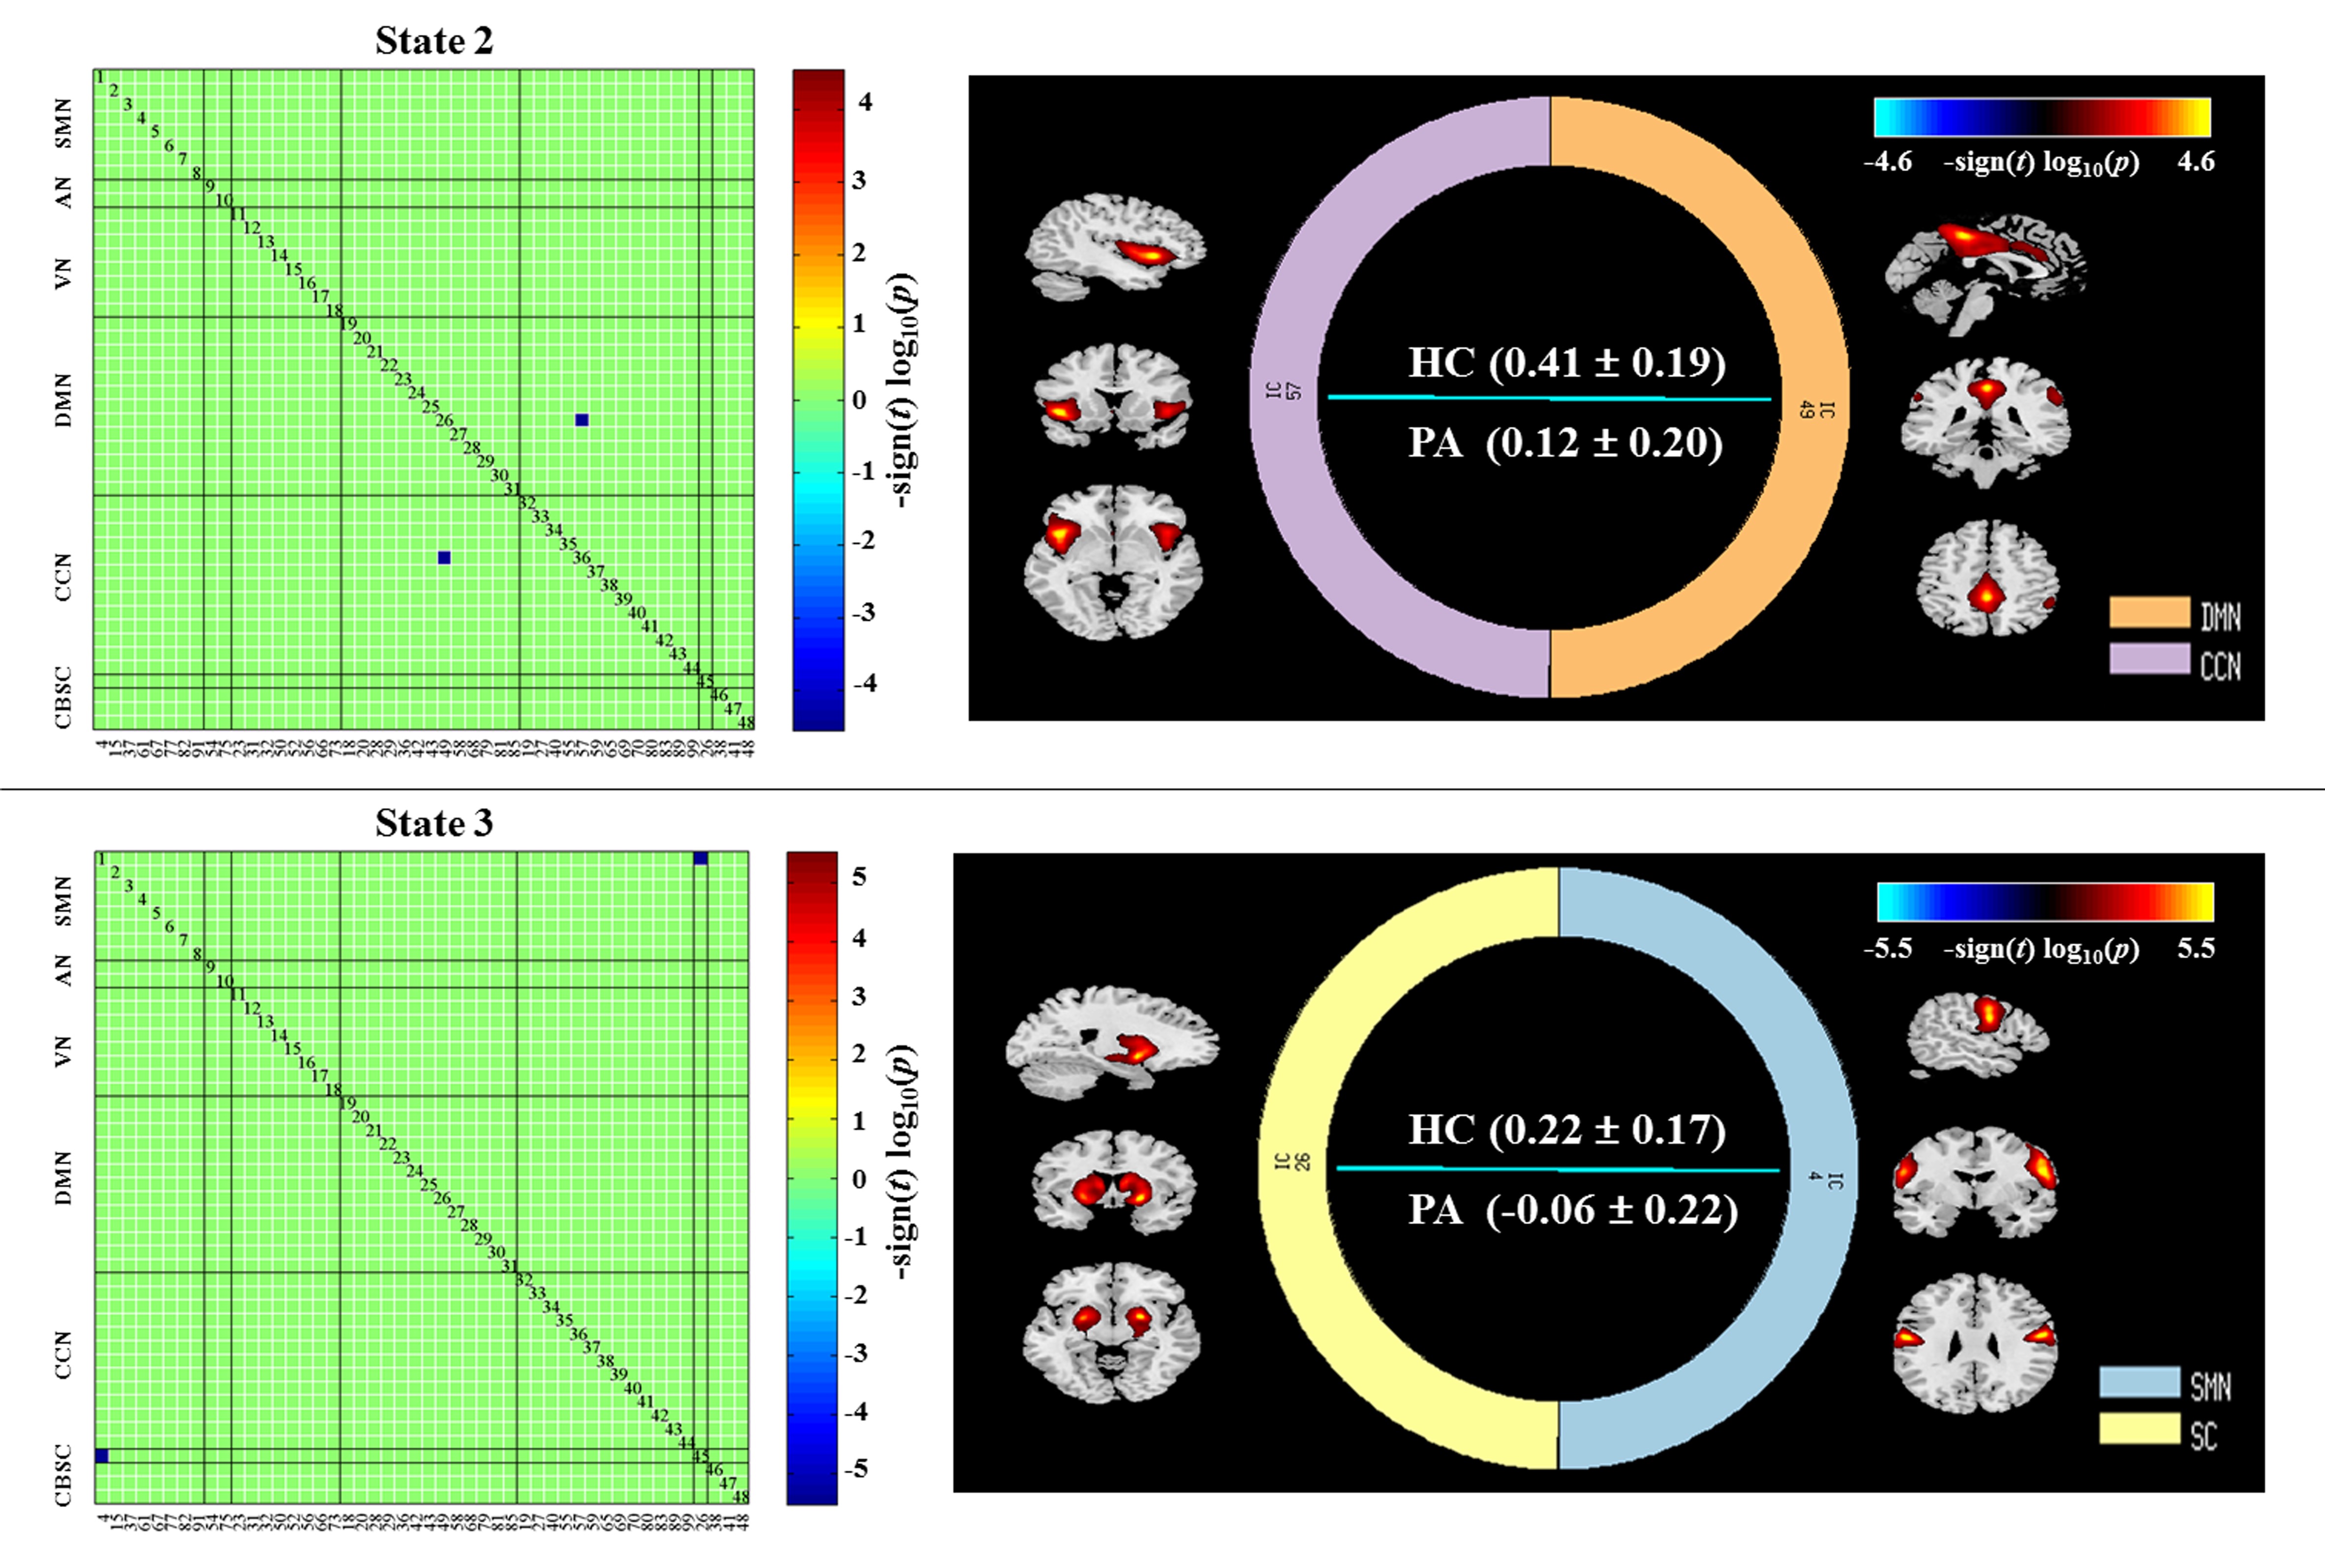
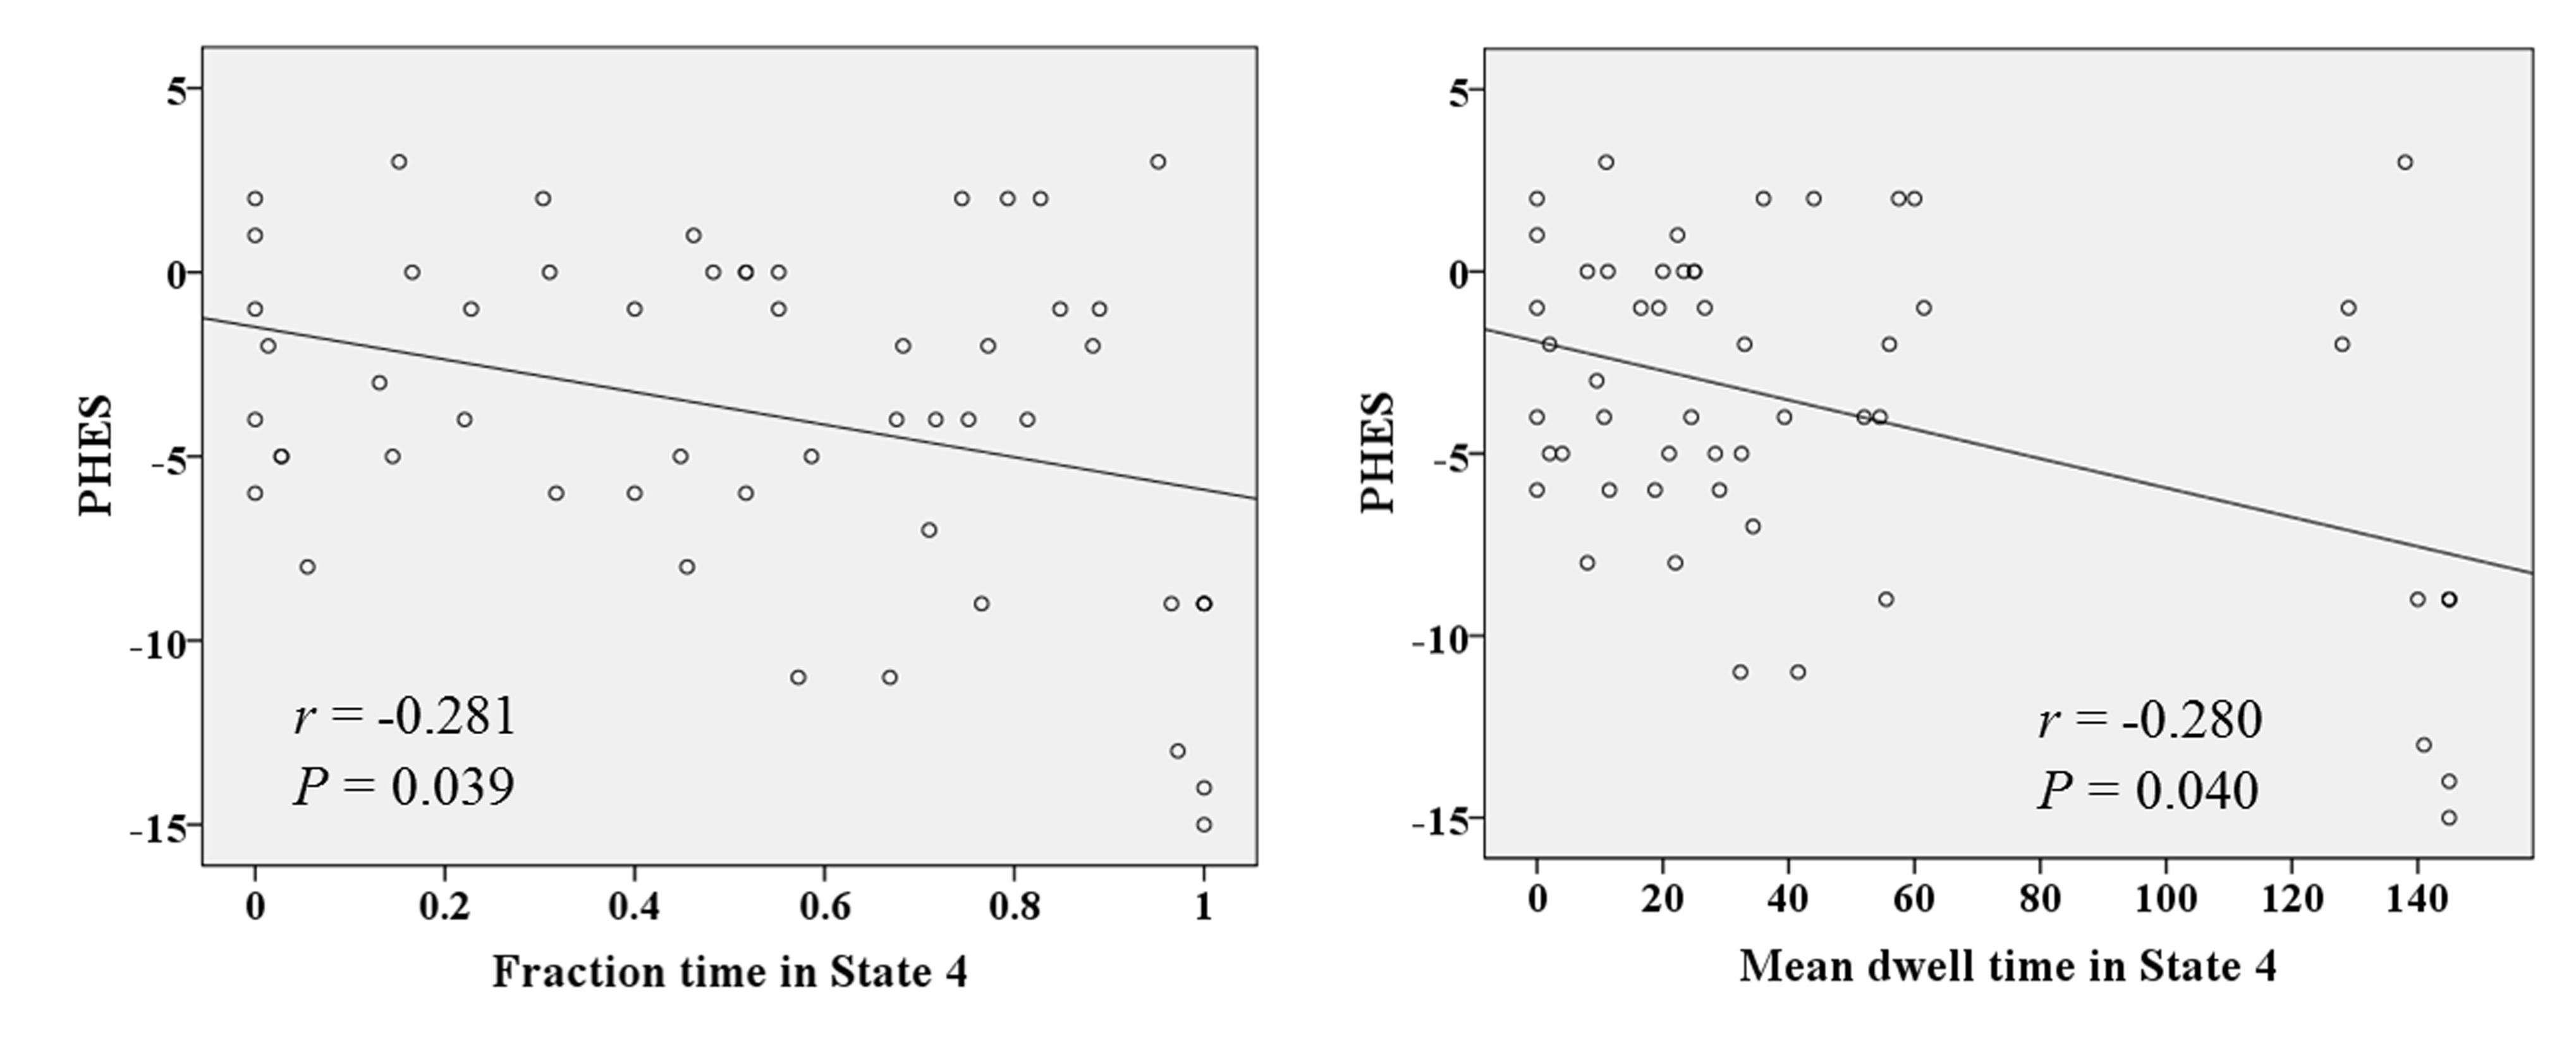
The cirrhotic patients had significant neurocognitive impairments, which were reflected by a decrease in PHES. Figure 2 shows the higher positive connections across all networks were detected at State 2 and decreased in other states to varying degrees. The strong positive connectivity among the perceptual networks was kept in State 1, whereas the relatively sufficient negative dFNC were investigated in States 1 and 3. Most inadequate dFNC appeared in State 4. The FNC reduction was detected in States 2 and 3, which involved the connectivities of DMN to CCN and of SMN to SC (Figure 3). Compared with HCs, the fraction time and mean dwell time in State 4 were significantly higher in patients, which indicates that the cirrhotic patients spent significantly longer time in that state. Correlation analyses revealed a significant negative correlation between PHES result and fraction time (r = -0.281 and P = 0.039) and mean dwell time (r = -0.280 and P = 0.040) in State 4 in the patient group (Figure 4).Conclusions
Aberrant dFNC may be the underlying mechanism of neurocognitive impairments in cirrhosis. dFNC analysis may potentially be utilized in investigating cirrhosis-related neuropathological processes.Acknowledgements
The National Natural Science Foundation of China (No. 81501450 and 82071900), Fujian Provincial Science Fund for Distinguished Young Scholars (No.2018J06023), Fujian Provincial Program for Distinguished Young Scholars (No. 2017B023), Fujian Provincial Program for Science and Technology Innovation (No.2019Y9067), Fujian Provincial Health Commission Project for Scientific Research Talents (No. 2018-ZQN-28), and Academic Exchange Fund for Postgraduates of Fujian Medical University supported this study.References
1. M.J. Jafri, G.D. Pearlson, et al. A method for functional network connectivity among spatially independent resting-state components in schizophrenia, Neuroimage;39(4) (2008) 1666-81.
2. V.D. Calhoun, R. Miller, et al. The chronnectome: time-varying connectivity networks as the next frontier in fMRI data discovery, Neuron; 84(2) (2014) 262-74.
3. F. de Pasquale, et al, Temporal dynamics of spontaneous MEG activity in brain networks, Proc Natl Acad Sci USA ;107(13) (2010) 6040-5.
4. H.J. Chen, et al, Altered dynamic functional connectivity in the default mode network in patients with cirrhosis and minimal hepatic encephalopathy, Neuroradiology; 59 (9) (2017) 905-914.
5. F.A. Espinoza, et al,Dynamic functional network connectivity in Huntington's disease and its associations with motor and cognitive measures, Hum Brain Mapp 40(6) (2019) 1955-1968.
6. B. Klugah-Brown, et al, Altered Dynamic Functional Network Connectivity in Frontal Lobe Epilepsy, Brain Topogr (2018).
7. D. Zhi, et al, Aberrant Dynamic Functional Network Connectivity and Graph Properties in Major Depressive Disorder, Front Psychiatry 9 (2018) 339.
Figures