3149
Functional connectivity markers of cross-modal inhibition: Effects of auditory and visual stimulation on homo- and hetero-modal brain networks1Radiological Sciences, DCN, School of Medicine, University of Nottingham, Nottingham, United Kingdom, 2SPMIC, School of Medicine, University of Nottingham, Nottingham, United Kingdom, 3National Institute for Health Research (NIHR), Nottingham BRC, Queens Medical Ctr, Nottingham, United Kingdom, 4Hearing Sciences, DCN, School of Medicine, University of Nottingham, Nottingham, United Kingdom
Synopsis
Functional magnetic resonance imaging (fMRI) studies have suggested that neural variability and connectivity (temporal coherence) are generally reduced during active versus passive (or resting) brain states. In this study, we investigate if this reduction in brain coherence is a supra-modal or modality-specific effect. For that, we compared BOLD signal during rest and whilst performing a continuous auditory or visual task. Our results suggest that task-induced reduction in brain coherence occurs only in default-mode and hetero-modal brain regions.
Introduction
During rest, brain regions activate coherently at both local and global (long-range network) levels. In contrast, in the active state, when performing a task or receiving a sensory stimulus, brain coherence has been shown to be reduced, prompting the suggestion that decreased brain coherence is associated with increased information capacity1,2,3. However, it is unclear whether reduction in brain coherence is specific to brain regions responding to the external stimuli or task (henceforth referred to as homo-modal regions), or whether it is more widely affecting long-range networks and occuring also in brain regions not associated with the task or stimulus modality (referred to as hetero-modal regions). Evidence for the latter has come from studies of cross-modal deactivation4,5. Understanding the detailed relationship between task conditions and brain coherence may help us to understand how phantom perceptions such as tinnitus are generated and maintained and how they, in turn, may affect supra-modal brain processes.We used BOLD fMRI to compare spontaneous activity and functional connectivity changes during an auditory and a visual task and during rest. Both tasks required continuous task engagement throughout an imaging run.
Methods
Data acquisitionA total of 11 healthy participants (3 female, mean age = 29 years, age range = 18-35 years) took part in this study. Imaging was performed on a 3T GE Discovery scanner with 32-channel head coil (Sir Peter Mansfield Imaging Centre, Nottingham). Functional images were acquired using a gradient-echo EPI sequence (TR = 2000 ms, TE = 32 ms, voxel resolution = 3x3x3 mm3, 0.5 mm inter-slice gap). We acquired three fMRI scans consisting of 240 volumes each (two task scans and one resting-state scan). In addition, we also acquired a T1-weighted structural image using a Sagittal FSPGR Bravo sequence (TR = 8.156 ms, TE =3.172 ms, resolution = 1x1x1-mm3, FOV = 256 × 256 × 156).
Task conditions
During the task scans, participants either watched a silent movie or listened to a radio podcast, presented at a comfortable listening level. The movie and podcast were presented through MR-compatible goggles (VisuaStim Digital) or headphones (SereneSound; both Resonance Technology Company, USA). Participants were told to close their eyes for the resting-state and auditory task scans, and to stay awake during the resting-state scan. After scanning, participants were asked about their experience of the movie and podcast.
Data processing and analysis
Structural and functional data were processed using the BRC pipeline (v1.4.3)6 in FSL (v6.0.1). The pre-processing included brain extraction, motion correction, slice-timing correction, spatial smoothing (5-mm FWHM Gaussian kernel), ICA-AROMA, and conversion to standard space (2x2x2 mm3). The pre-processed data were then further denoised by means of scrubbing (FD > 0.5 mm or DVARS > 3%)7, and band-pass filtering between 0.01-0.08 Hz. Regional connectivity density, interregional correlations and fractional amplitude of low-frequency fluctuations (fALFF) were calculated using the CONN functional connectivity toolbox (v19c). Auditory cortical region of interests (ROIs) were defined using the Brodmann anatomical atlas. Inter-regional correlations were Fisher z-transformed.
Results
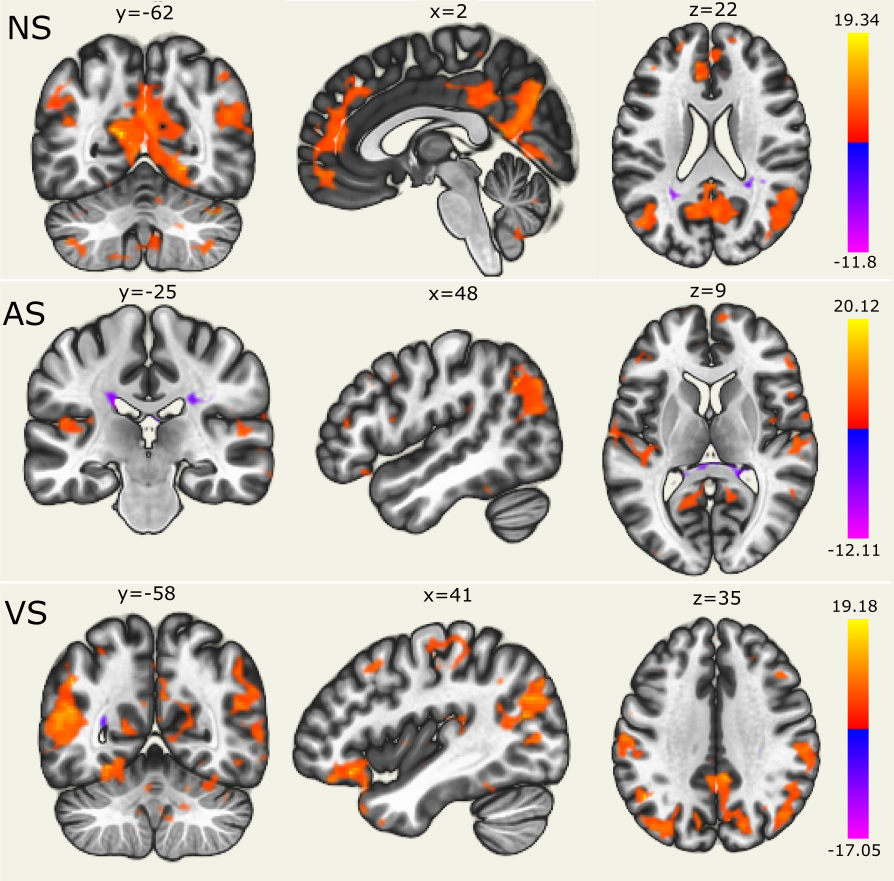
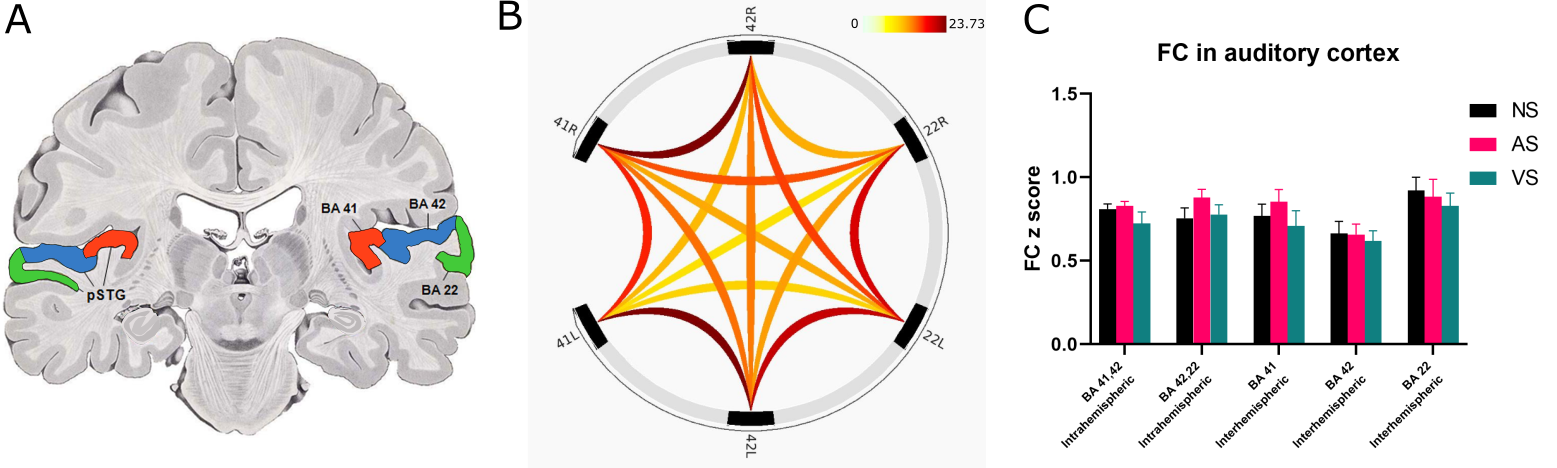
Functional connectivity during rest was largely limited to regions of what is typically know as the default-mode network. During both task conditions (auditory and visual), functional connectivity within these regions was reduced, but connectivity was increased in modality-specific regions—specifically, regions associated with the languange network in the auditory task and with the dorsal-visual network in the visual task.During rest, the auditory cortical regions (Fig. 2A) showed particularly strong connections between primary and secondary regions intra-hemispherically, and between the left secondary and tertiary regions, which are thought to be involved in speech perception8 (Fig. 2B). Generally, the visual task caused small but consistent reductions in connectivity strength across all auditory regions. In contrast, the effects of the auditory task were less consistent, with the intrahemispheric connections generally increasing in strength, but the interhemispheric connection generally decreasing in strength (with the exception of the interhemispheric connection between the primary regions; Fig 2C).
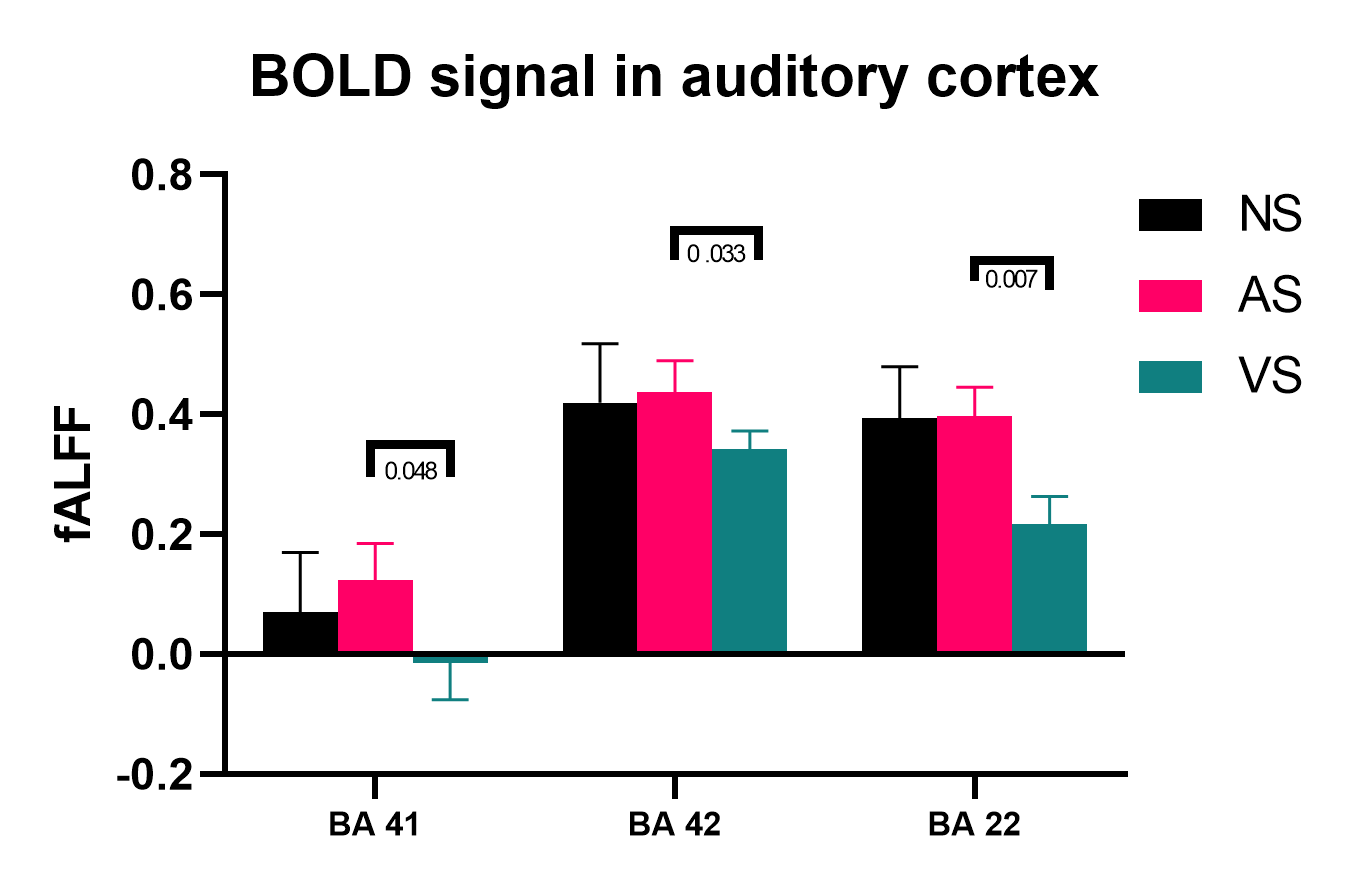
The local variability (represented by fALFF), showed a consistent pattern of regional differences, with the primary region showing less variability than the secondary and tertiary regions. During the auditory task, variability across all three regions tended to either remain unchanged or be slightly increased. In contrast, during the visual task, variability was consistently decreased across all three regions.
Discussion and conclusion
Contrary to the idea that performing a task causes general reduction in brain coherence, our results suggest that coherence reduction is specific to task modality, occurring only, or predominantly, within default-mode and hetero-modal regions, with homo-modal regions showing either no change or even increase in coherence. These results are consistent with the idea that performing a task increases long-range inhibitory drive exerted by the task-activated (homo-modal) regions, whilst, at the same time, reducing local inhibitory drive within these regions9. These, albeit preliminary, challenge the presumed association between brain coherence and information capacity. Instead, they suggest that increased brain coherence may actually facilitate information processing, perhaps through modulation of neural excitability at finer temporal or spatial scales.Assuming that the auditory task condition can be taken as a model of tinnitus, our results suggest that tinnitus should increase brain coherence in auditory-specific brain regions but decrease coherence in the default mode network and in non-auditory sensory networks.
Acknowledgements
*Author KK and DA share senior authorship.
This research is a part of the TINACT project and has received funding from the European Research Council (ERC) under the European Union's Horizon 2020 research and innovation programme (grant n°764604). We thank the NIHR Nottingham Biomedical Research Centre and Precision Imaging Beacon for valuable intellectual input.
References
- He, Biyu J. "Spontaneous and task-evoked brain activity negatively interact." Journal of Neuroscience 33.11 (2013): 4672-4682.
- Ito, Takuya, et al. "Task-evoked activity quenches neural correlations and variability across cortical areas." bioRxiv (2020): 560730.
- Deco, Gustavo, et al. "How local excitation–inhibition ratio impacts the whole brain dynamics." Journal of Neuroscience 34.23 (2014): 7886-7898.
- Laurienti, Paul J., et al. "Deactivation of sensory-specific cortex by cross-modal stimuli." Journal of cognitive neuroscience 14.3 (2002): 420-429.
- Mozolic, Jennifer L., et al. "Cross-modal deactivations during modality-specific selective attention." BMC neurology 8.1 (2008): 35.
- Mohammadi-Nejad, AR., et al. “Multi-modal neuroimaging pipelines for data preprocessing” (Version v1.4.3). Zenodo. http://doi.org/10.5281/zenodo.3909526. (2020).
- Power, Jonathan D., et al. "Methods to detect, characterize, and remove motion artifact in resting state fMRI." Neuroimage 84 (2014): 320-341.
- Scott, Sophie K., and Carolyn McGettigan. "Do temporal processes underlie left hemisphere dominance in speech perception?." Brain and language 127.1 (2013): 36-45.
- Koush, Y., et al. "Metabolic basis of deactivation and activation in default mode and sensory networks." Journal of Cerebral Blood Flow and Metabolism. Vol. 39. 2455 Teller Rd, Thousand Oaks, CA 91320 USA: Sage Publications INC, 2019.
Figures