3145
A quality-control database for the resting-state young-adult human connectome project1Institute for Advanced Biomedical Technologies, Department of Neuroscience, Imaging and Clinical Sciences, "G. D'Annunzio University" of Chieti-Pescara, Chieti, Italy, 2Centro Fermi - Museo storico della fisica e Centro studi e ricerche Enrico Fermi, Rome, Italy
Synopsis
The human connectome project collected resting-state data from over 1000 healthy young-adult subjects. Looking beyond its original purpose, this database represents a valuable resource for benchmarking denoising pipelines. Unfortunately, quality control data for selecting scans with opposite noise characteristics, such as scans with extremely low or high head motion, are not publicly available. Here, we explored the entire resting-state human connectome project to provide researchers with a database of quality control metrics. Using the database, we constructed two instances of samples with suitable features for benchmarking purposes.
Introduction
The human connectome project (HCP)1, with its excellent spatial and temporal resolution, represents a powerful tool for characterizing brain connectivity in the healthy brain2. At the same time, this huge database provides an extraordinary resource for evaluating denoising strategies, making it possible to compare pipelines between low and high motion subjects (between-subject comparisons) or within the same subjects across different runs with different levels of noise (within-subject comparisons). Despite such great potential, selecting subjects with different noise characteristics is challenged by the lack of a publicly available quality-control (QC) database and by the huge amount of data (~31TB), which makes the exploration of the database a cumbersome process. Here, we aimed at producing a QC database for the entire set of resting-state data and at showing the feasibility of constructing groups of subjects/scans with opposite noise characteristics.Methods
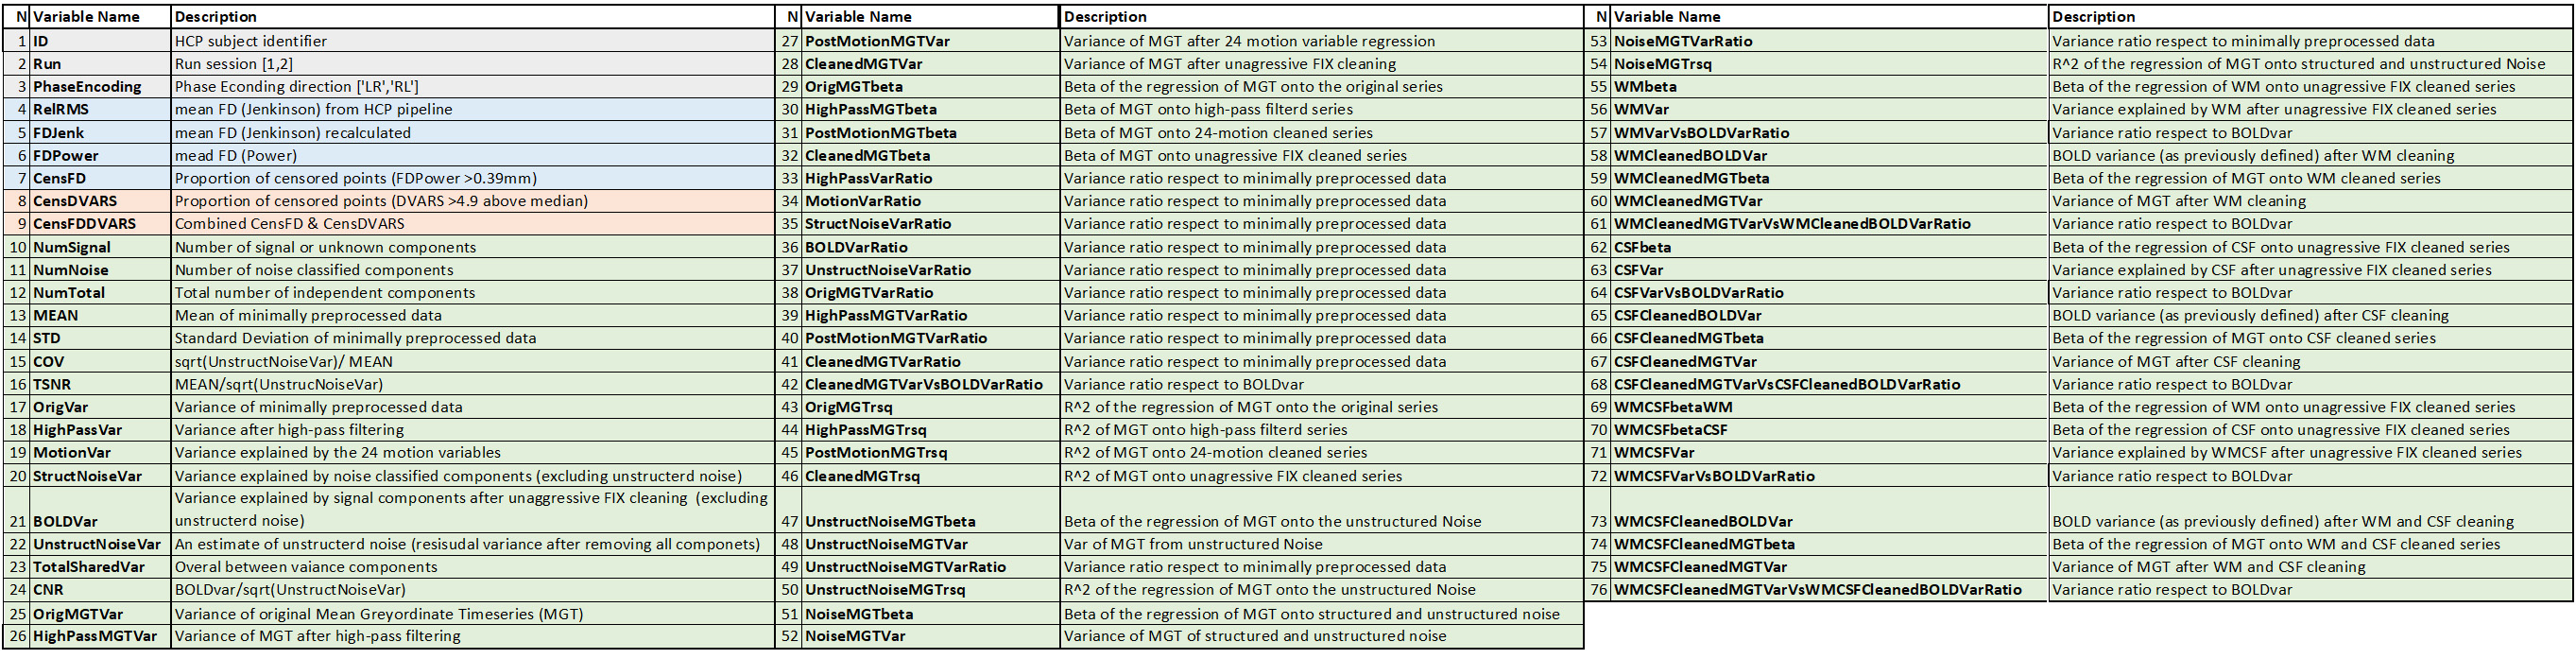
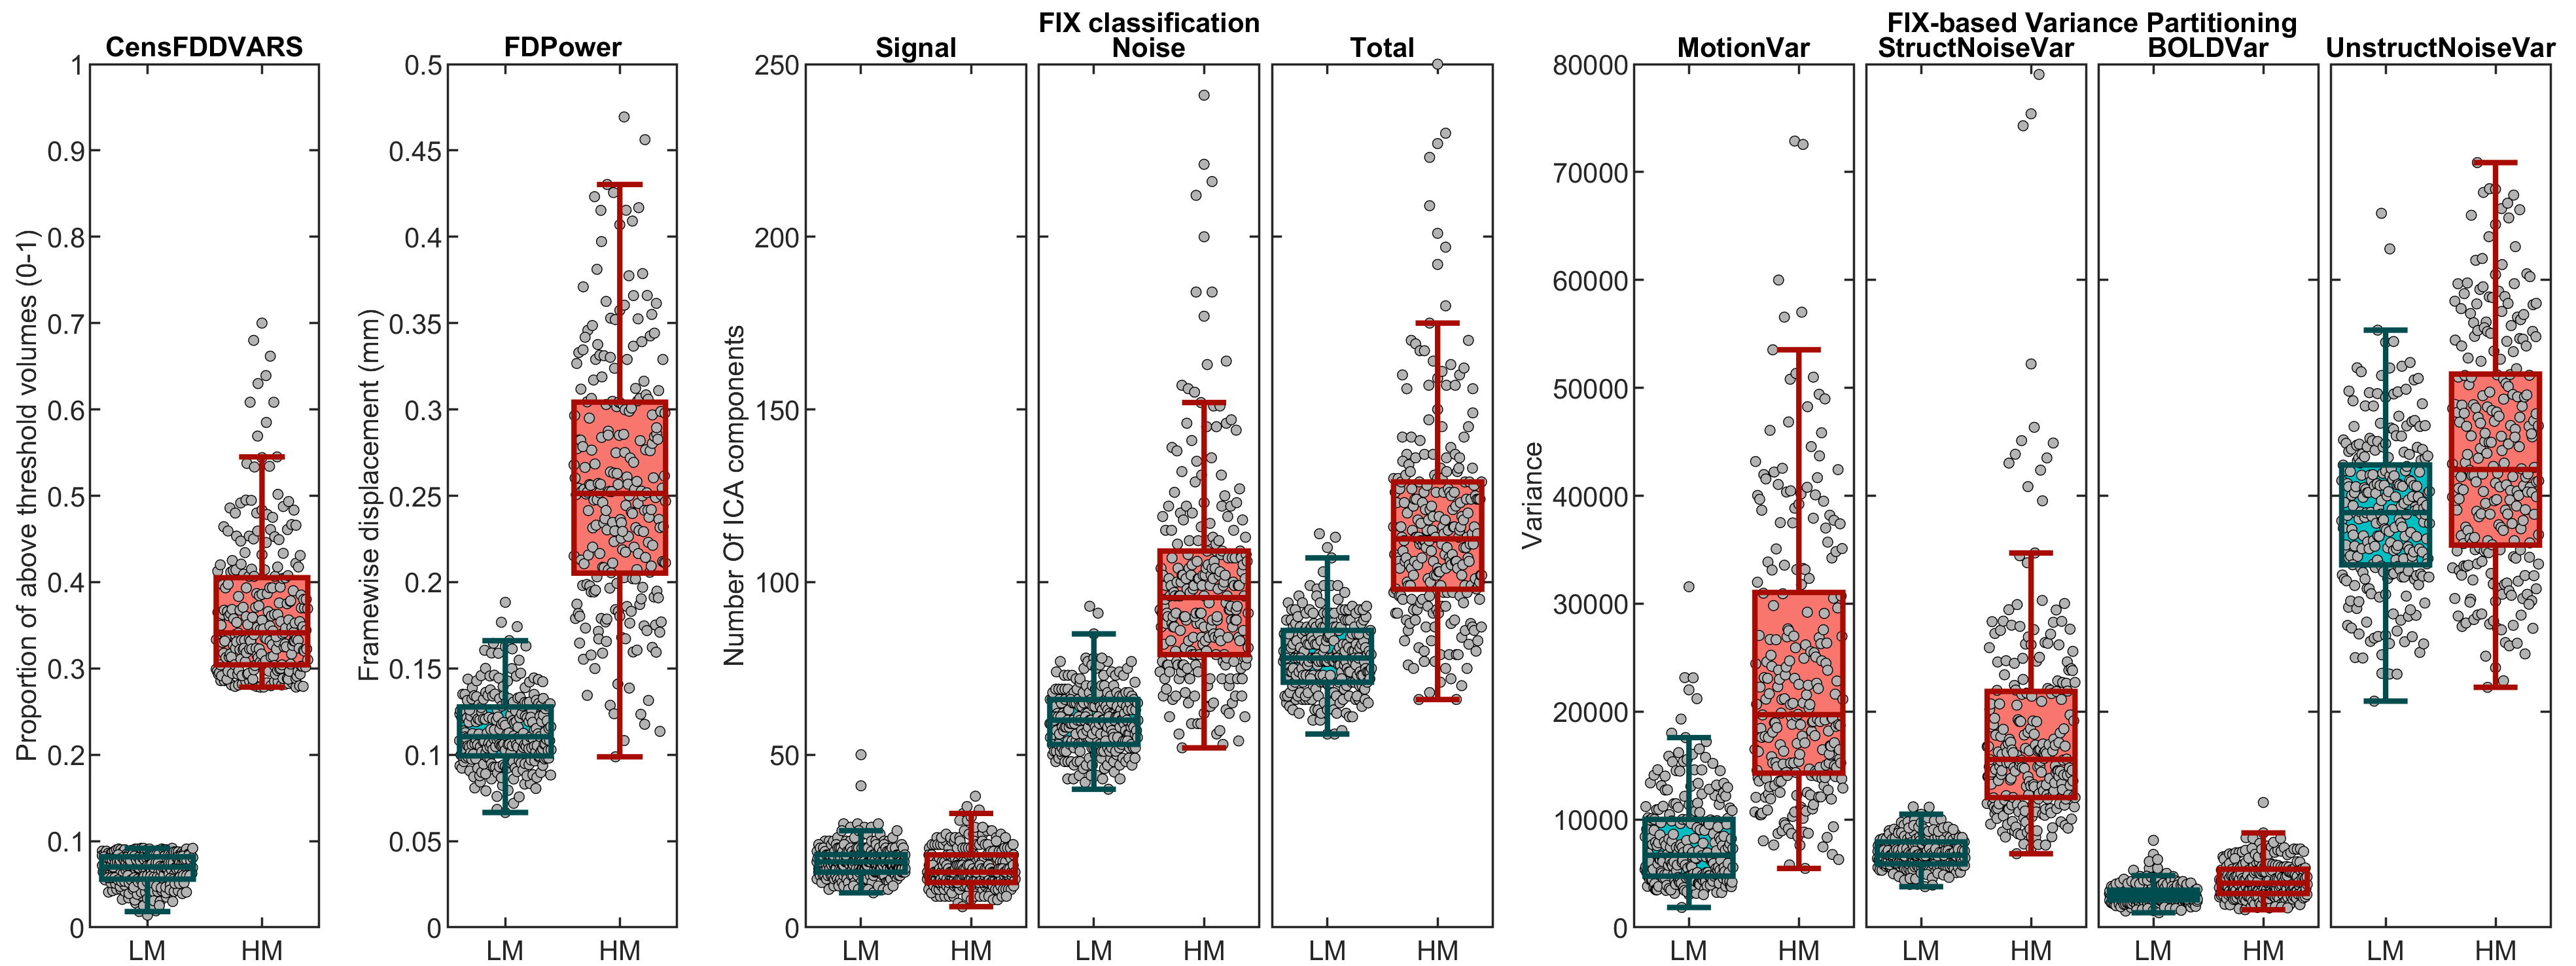
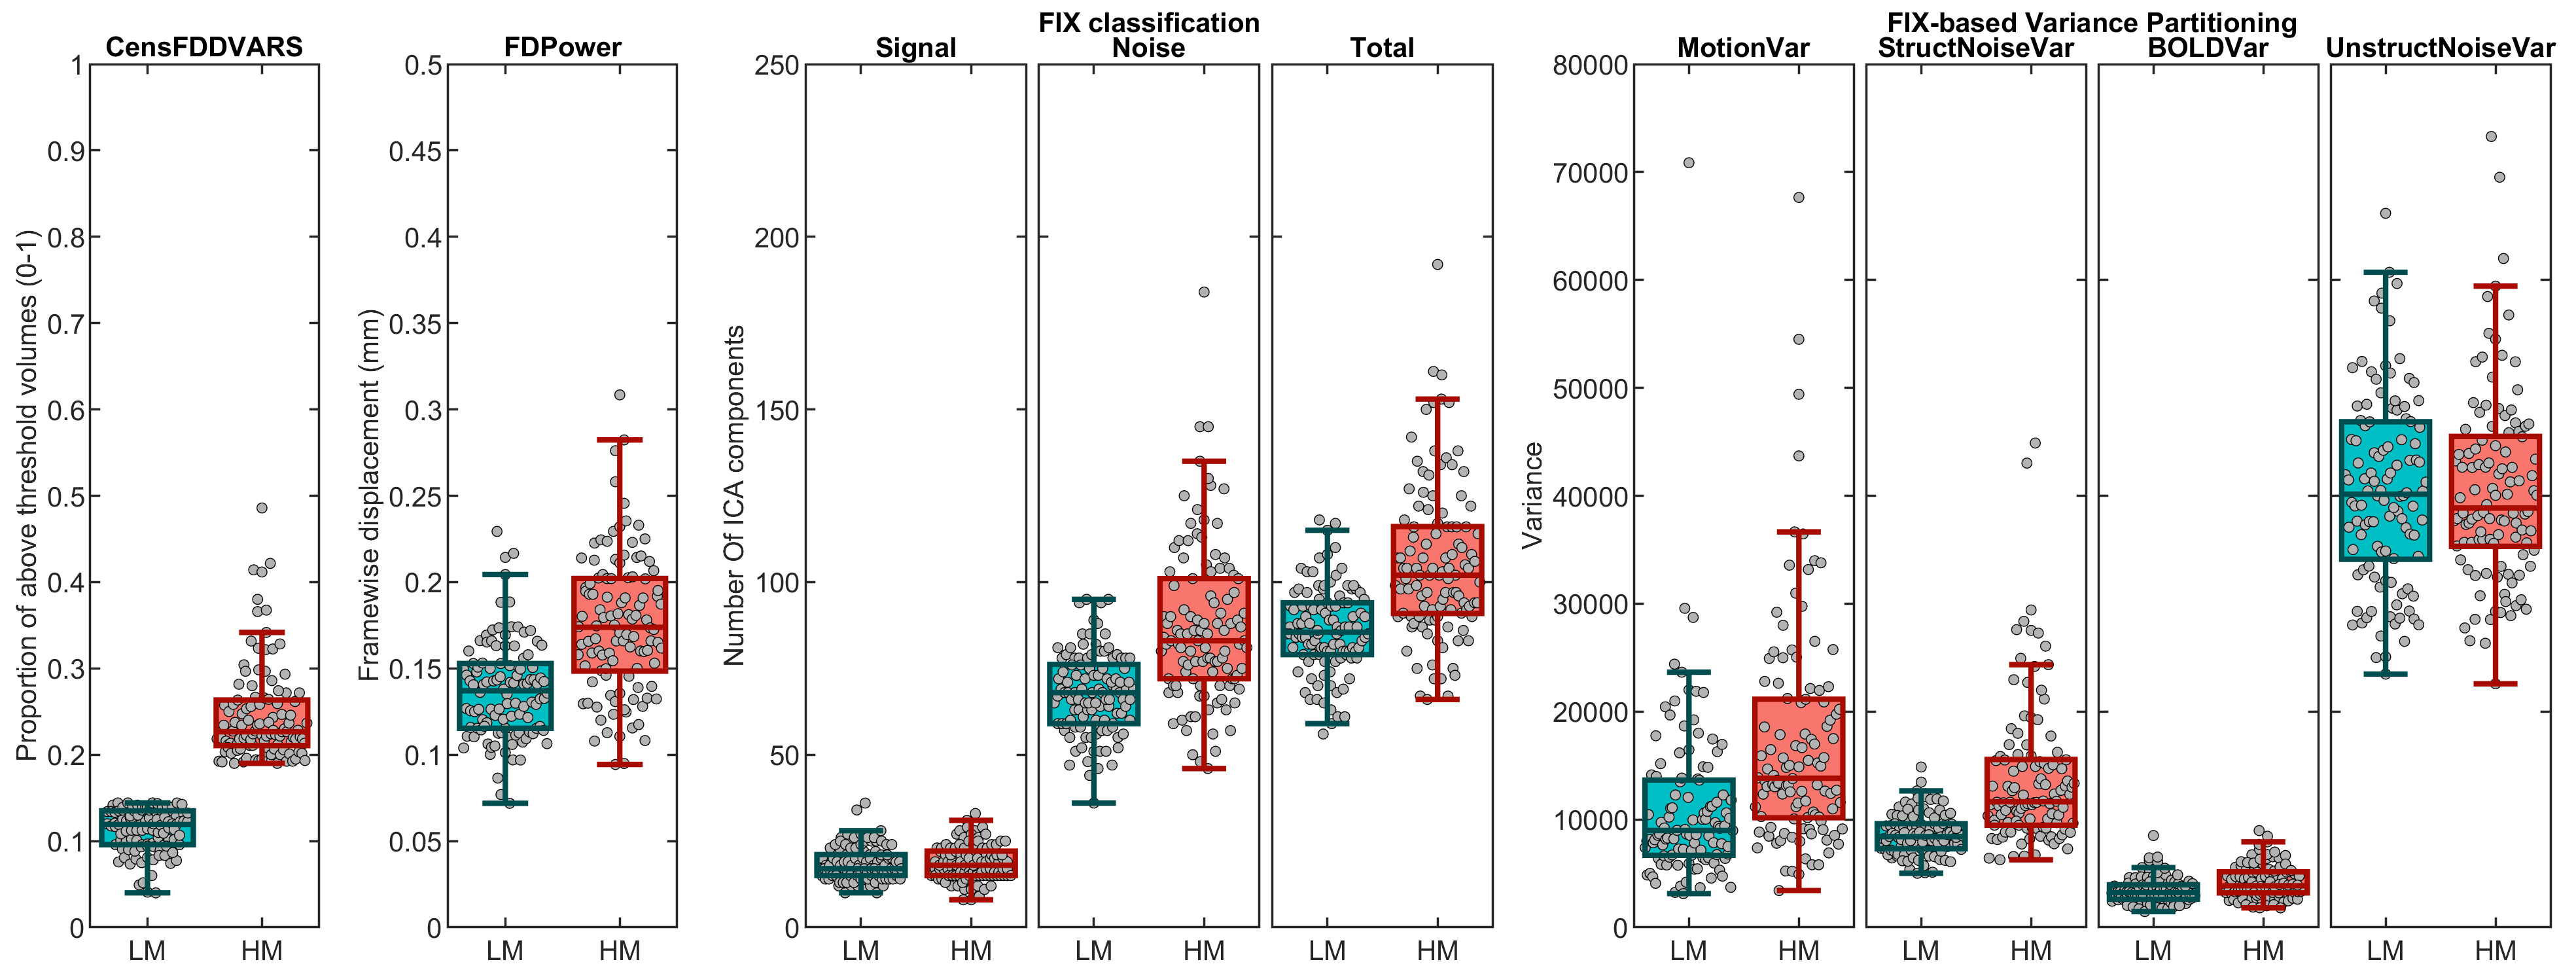
The HCP S1200 release2 was used for this study. The dataset includes 4227 15-minutes eyes-open resting-state scans from 1096 young-adult healthy subjects. We collected several QC metrics, which can be grouped in three categories: 1) motion-based metrics 2) image-based noise metrics 3) and FIX3-based metrics. From the estimated motion parameters, we calculated the mean framewise displacement (FD) according to Jenkinson’s4 and to Power’s5 definition. For image-based noise metrics, we calculated DVARS6 on the minimal preprocessed series7 in grayordinate representation. For both FD and DVARS, we defined the proportion of censored volumes as an additional quality index (CensFD, CensDVARS, respectively). Based on previous work8, for CensFD we counted any volume with FDPower > 0.39 mm, while for CensDVARS we counted volumes 4.9 units above the median DVARS for the scan. A combined index was also calculated (CensFDDVARS). Finally, FIX-based metrics were extracted from the stats file, the output of the HCP RestingStateStats function7. The stats file contains a detailed variance partitioning according to the FIX classification of the ICA decomposition in noise and signal components. All the above metrics, for each subject and run, were collected in a single matlab table, whose columns are described in Table 1. We then exploited the table to construct samples with opposite noise characteristics, constructing either groups of subjects with extreme noise characteristics (for between-subject comparisons), or selecting subjects with disproportionate noise characteristics between scans (for intra-subject comparisons). We assigned subjects/scans to motion groups (low motion, LM, or high motion, HM) according to the combined censoring index (CensFDDVARS). For between-subject comparisons, LM and HM groups were constructed by setting the desired sample size (N = 250) and collecting subjects with the lowest or highest proportion of above-threshold volumes, respectively. For intra-subject comparisons, the selection of subjects was based on percentiles, so that subjects had to meet the following criteria to be included: 1 scan with CensFDDVARS < pct (assigned to LM) and 1 scan with CensFDDVARS > (100-pct) (assigned to HM). We set the percentile to 40% and found 110 subjects meeting the selection criteria. The QC database, along with functions to select scans with opposite metric values, is available at https://github.com/dmascali/HCP_resting-state_QC.Results and Discussion
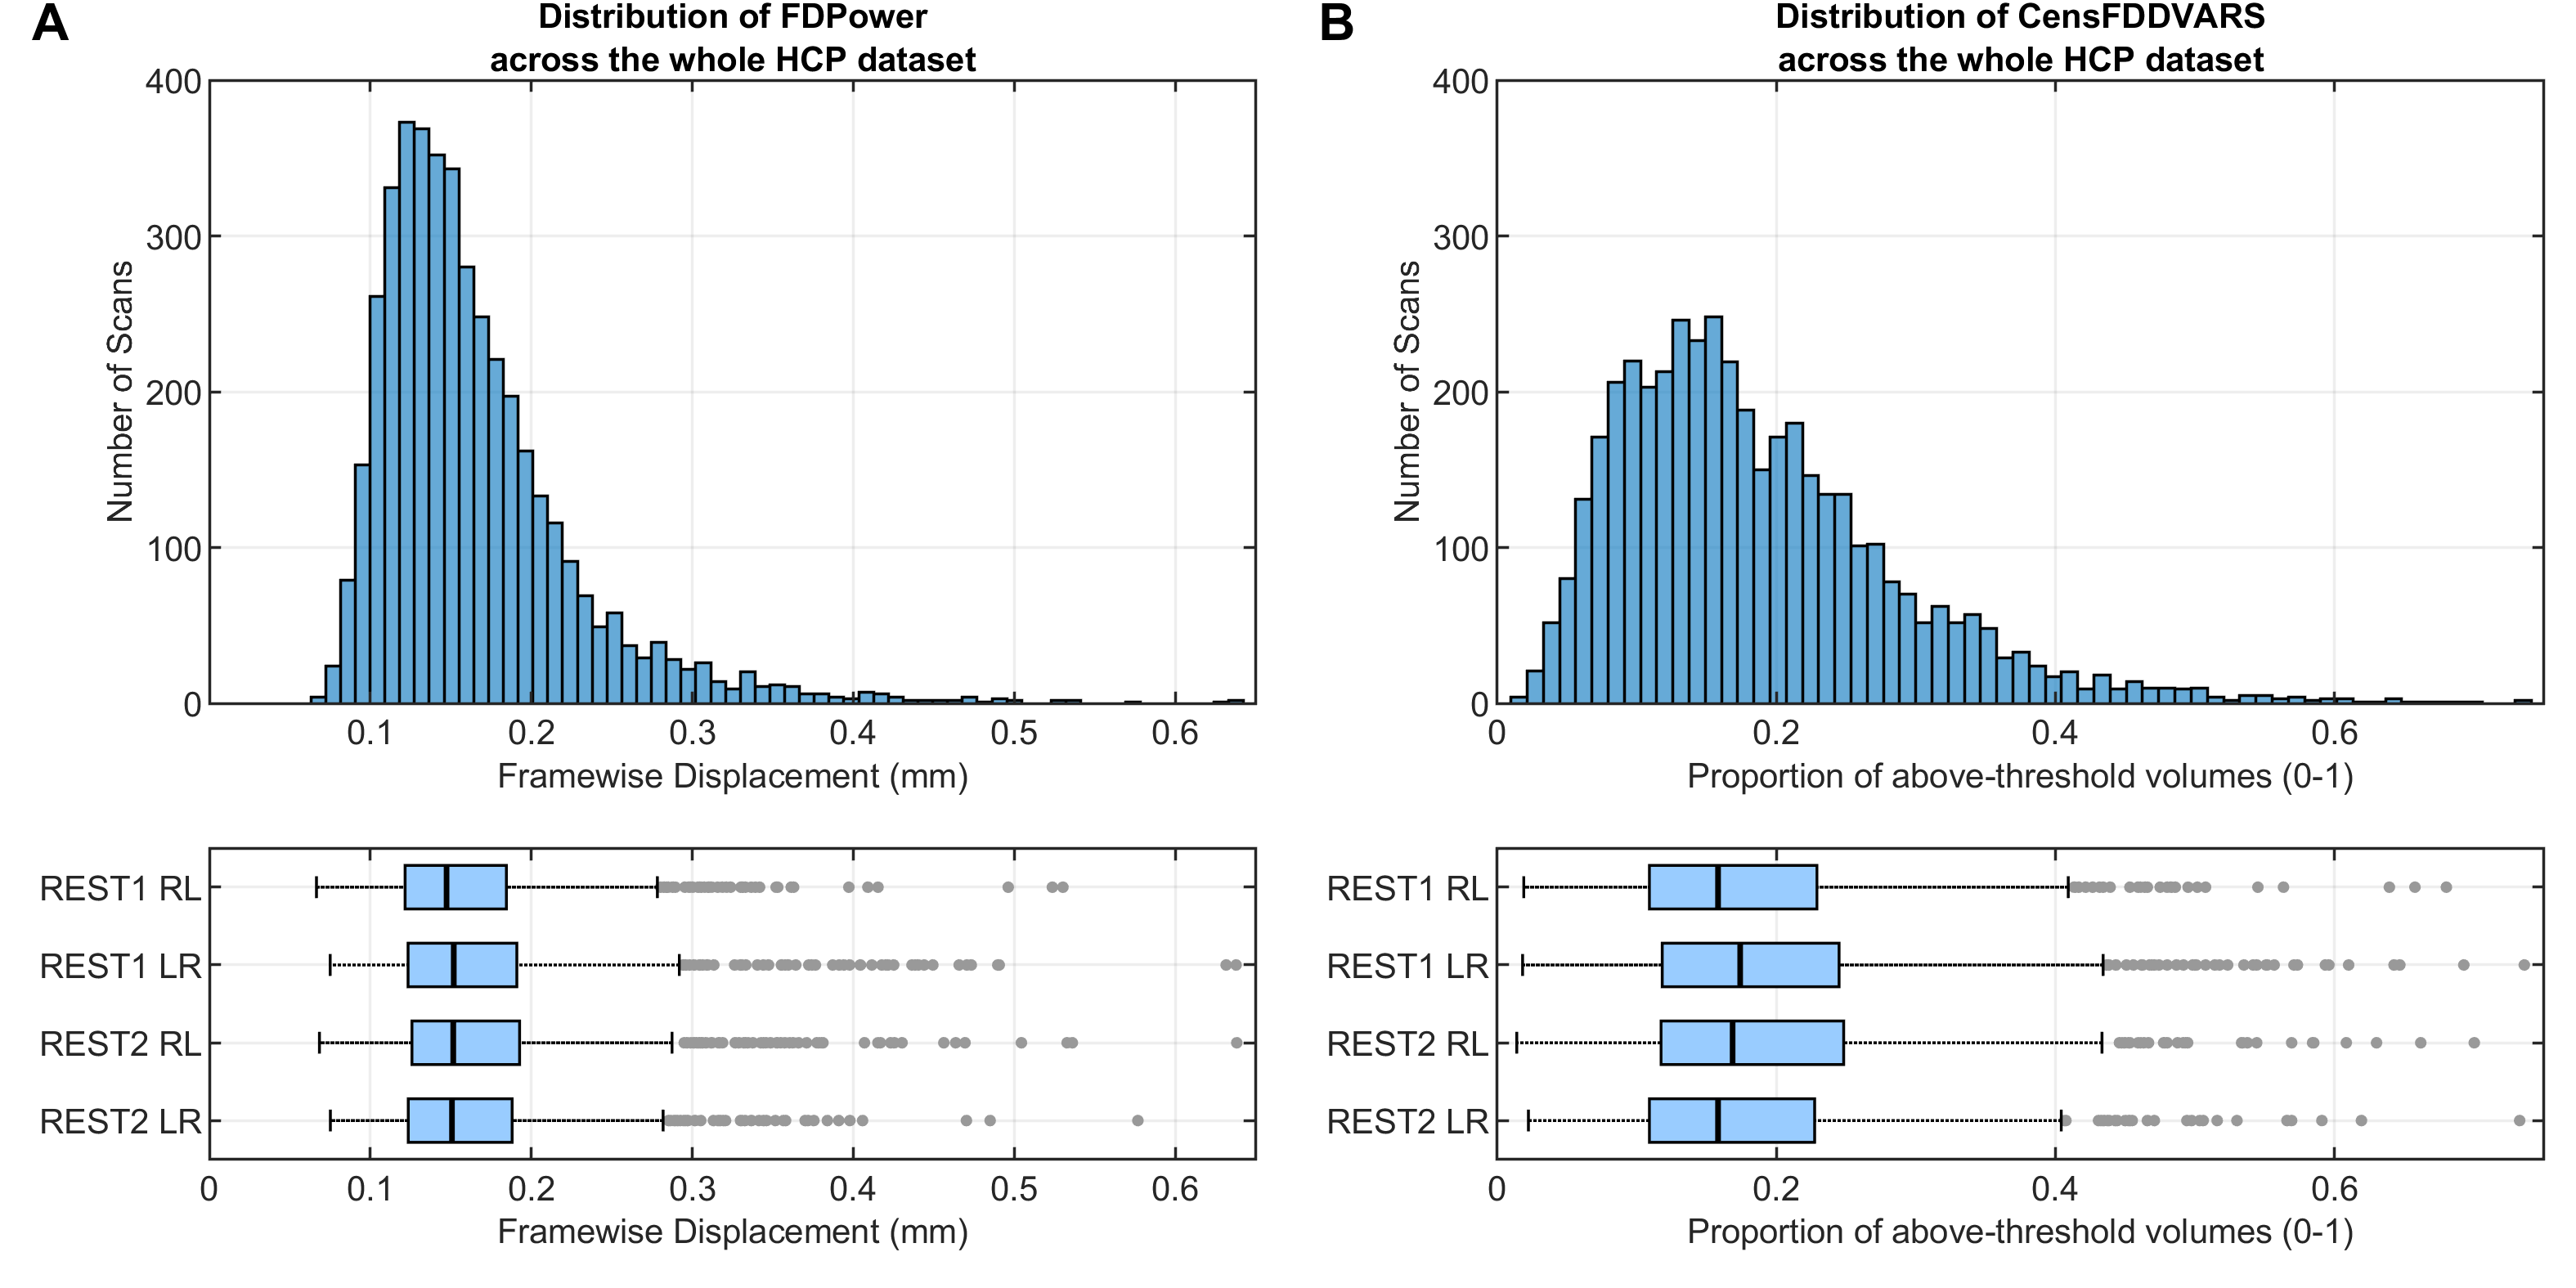
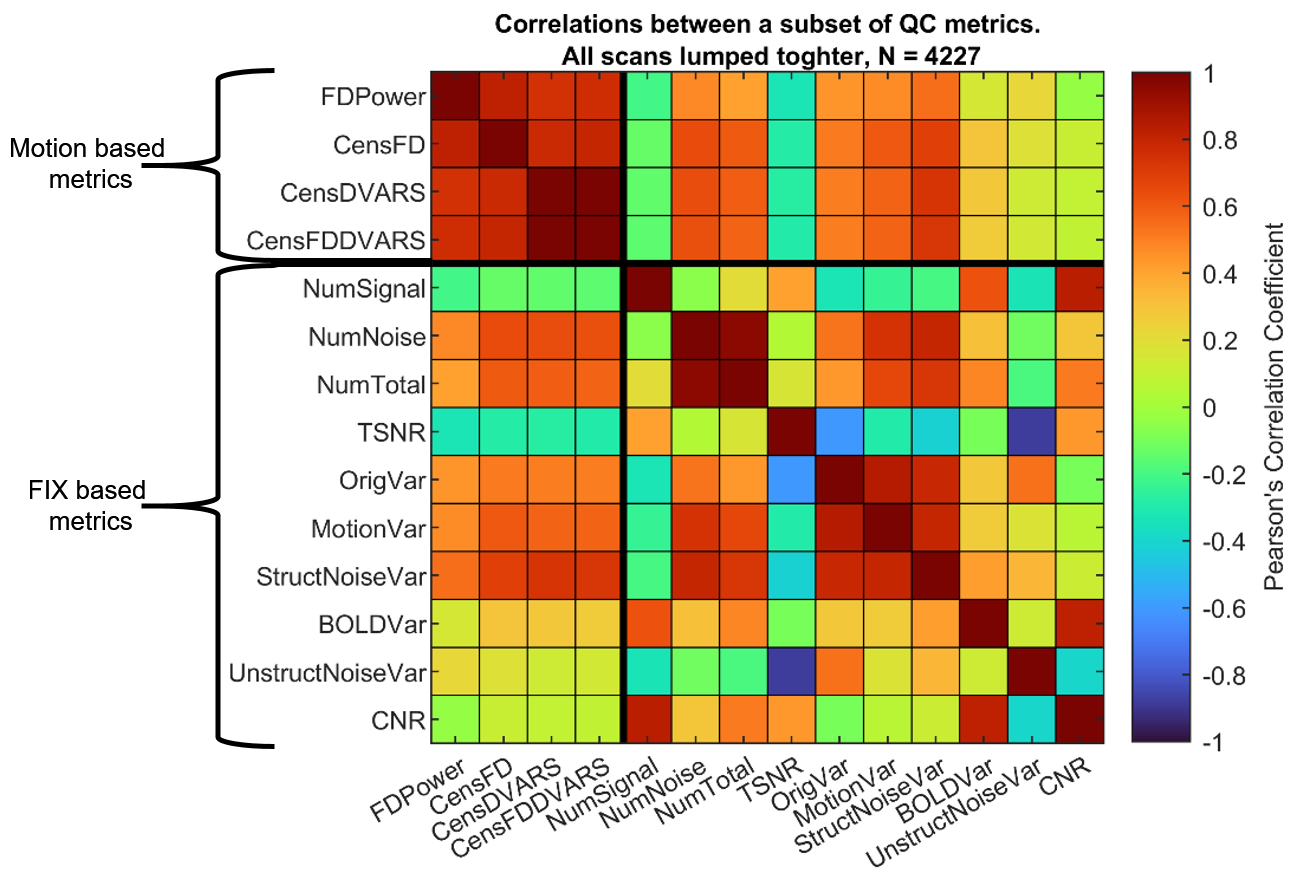
The distribution of FD and CenFDDVARS across the entire HCP dataset is reported in Figure 1. Pearson’s correlations between a subset of the extracted metrics is reported in Figure 2. The QC metrics derived from realignment parameters and from DVARS tend to be positively associated with the number of noise-classified components and with noise-related variance (e.g., StructNoiseVar). On the contrary, they show an inverse association with the number of signal classified components and with TSNR. These results indicate that metrics such as CenFDDVARS are valuable in partitioning subjects/scans into noise classes. We provide two examples of subject/scan selection with extreme noise characteristics for between-subject (Figure 3) and for within-subject (Figure 4) comparisons. In both cases, the two samples show markedly different distributions of QC metrics, including FD, the number of noise-classified components, the total number of components in which the dataset was decomposed, and the variance pertaining to motion and to structured noise. For their noise characteristics profiles, these samples are particularly suited for benchmarking the stability of functional connectivity estimates.Conclusion
Functional connectivity estimates from resting-state data are susceptible to many sources of spurious variance, including head motion, physiological processes and scanner artifacts. Thus, it is crucial to evaluate the effectiveness of denoising pipelines in cleaning BOLD data, a process that is compromised by the lack of information regarding neuronal-related variance. In this context, we showed that the HCP dataset provides the possibility of constructing large samples with extreme noise characteristics, which can be exploited to construct benchmarks for evaluating denoising strategies. The QC database, available at https://github.com/dmascali/HCP_resting-state_QC, facilitates the process of sample definition.Acknowledgements
No acknowledgement found.References
1. Van Essen DC, Smith SM, Barch DM, Behrens TE, Yacoub E, Ugurbil K, Wu-Minn HCP Consortium. The WU-Minn human connectome project: an overview. Neuroimage. 2013 Oct 15;80:62-79.
2. Smith SM, Beckmann CF, Andersson J, Auerbach EJ, Bijsterbosch J, Douaud G, Duff E, Feinberg DA, Griffanti L, Harms MP, Kelly M. Resting-state fMRI in the human connectome project. Neuroimage. 2013 Oct 15;80:144-68.
3. Salimi-Khorshidi G, Douaud G, Beckmann CF, Glasser MF, Griffanti L, Smith SM. Automatic denoising of functional MRI data: combining independent component analysis and hierarchical fusion of classifiers. Neuroimage. 2014 Apr 15;90:449-68.
4. Jenkinson, M., Bannister, P., Brady, M., & Smith, S. (2002). Improved optimization for the robust and accurate linear registration and motion correction of brain images. Neuroimage, 17(2), 825-841.
5. Power, J. D., Barnes, K. A., Snyder, A. Z., Schlaggar, B. L., & Petersen, S. E. (2012). Spurious but systematic correlations in functional connectivity MRI networks arise from subject motion. Neuroimage, 59(3), 2142-2154. doi: 10.1016/j.neuroimage.2011.10.018
6. Smyser, C. D., Inder, T. E., Shimony, J. S., Hill, J. E., Degnan, A. J., Snyder, A. Z., & Neil, J. J. (2010). Longitudinal analysis of neural network development in preterm infants. Cereb Cortex, 20(12), 2852-2862. doi: 10.1093/cercor/bhq035
7. Glasser MF, Sotiropoulos SN, Wilson JA, Coalson TS, Fischl B, Andersson JL, Xu J, Jbabdi S, Webster M, Polimeni JR, Van Essen DC, Jenkinson M; WU-Minn HCP Consortium. (2013) The minimal preprocessing pipelines for the Human Connectome Project. Neuroimage 80:105-24. (doi: 10.1016/j.neuroimage.2013.04.127) PMID: 23668970
8. Burgess GC, Kandala S, Nolan D, Laumann TO, Power JD, Adeyemo B, Harms MP, Petersen SE, Barch DM. Evaluation of denoising strategies to address motion-correlated artifacts in resting-state functional magnetic resonance imaging data from the human connectome project. Brain connectivity. 2016 Nov 1;6(9):669-80.
Figures