3144
Optimizing connectome-based real-time neurofeedback for improved attentional control
Xiangrui Li1, Oyetunde Gbadeyan 1, and Ruchika Shaurya Prakash1
1Department of Psychology and Center for Cognitive and Behavioral Brain Imaging, The Ohio State University, Columbus, OH, United States
1Department of Psychology and Center for Cognitive and Behavioral Brain Imaging, The Ohio State University, Columbus, OH, United States
Synopsis
In this proof-of-concept study, we conducted an optimization assessment of predictive models for use with real-time functional magnetic resonance imaging. Here, we utilized two existing connectome-based models of sustained attention and mind-wandering derived in independent datasets, with each model comprising connections predictive of positive or negative associations with target behavior. Both models showed significant networks strengths across the blocks of the sustained attention task, with the combined model showing significant network strengths and capturing vigilance decrements. Our results suggest that our two models are representative of high and low attentional states, thus making them appropriate targets for neurofeedback.
Introduction
Real-time functional magnetic resonance (rt-fMRI) neurofeedback is a non-invasive therapeutic approach designed to provide feedback signal based on neural activity or connectivity to modulate brain dynamics and enhance associated cognitive processes 1,2. Recently, Schenoist et al. 3 provided support for the feasibility of providing neurofeedback based on network strength of a large-scale distributed model of sustained attention. Extending the prior literature, we are interested in examining rt-fMRI neurofeedback to enhance attentional control in older adults. Aging is associated with significant cognitive decline especially on tasks of attentional control requiring focusing on particular sources of information while ignoring irrelevant information 4,5. However, an important step in implementing rt-fMRI neurofeedback is to carefully select and optimize the target for providing neurofeedback, as modulation of target neural activity or connectivity will have important consequences for the cognitive domain of interest. As such, in this study, we examined differences in network strengths of two connectome-based models, derived in independent datasets, to predict sustained attention and mind-wandering, respectively.Methods
Twenty-five older adults (aged 65-85 years) participated in a neuroimaging session at the Center for Cognitive and Behavioral Brain Imaging on a 3T Siemens MAGNETOM Prisma system using a 32-channel head coil. Participants were presented with the gradual continuous performance task (GradCPT 6) where they were shown gradually changing images of city and mountain scenes, and were asked to respond via a button press for city, but not mountain scenes. All participants completed two separate runs, each consisting of four 3-minute blocks interleaved with rest blocks.To examine the connectome-based model that would be best suited for providing target signal during rt-fMRI neurofeedback, we applied two connectome-based network masks. The first mask – saCPM – was derived separately in a sample of 41 healthy older adults to predict d prime, or sensitivity, which takes both correct responses (i.e., hits) and errors of commission (i.e., false alarms) into account 7. Similarly, using the connectome-based predictive modeling approach, we also derived a mind-wandering connectome-based model to predict trial-to-trial fluctuation in reaction time during a task of sustained attention. Using data on 135 older adults from the Human Connectome in Aging (HCP-Aging 8) project, we derived a connectome-based model to predict reaction time variability (RT_CV= RT(SD)/RT(Mean)). As successful attentional control is likely a byproduct of the ability to select target representations, captured via d prime, and reduce interference associated with internal and external distractions, assessed in here via fluctuation in reaction time, we hypothesized that a mask derived from combining saCPM with mwCPM will likely serve as a potent target for neurofeedback. We thus applied the saCPM mask, including a high attention network and a low attention network, along with a mwCPM, including a high mind-wandering network and a low mind-wandering network, to the four blocks of the two gradCPT runs. For each of the four blocks in every run, we computed the network strength of the saCPM masks and the mwCPM masks and calculated the difference between the high and low networks. The difference score essentially represented a summary statistic indexing high connectivity in nodes associated positively with behavior and low connectivity in nodes associated negatively with behavior. For the combined mask, we combined high attention with low mind-wandering and low attention with high mind-wandering.
Results
Our saCPM combined model, indexing difference in network strengths between the high attention and low attention networks, showed an average difference of 0.19 (p<1e-30) between the network strengths of the two masks. This difference, as depicted in Figure 1, was seen in all blocks of runs 1 and 2, thus suggesting that the saCPM model differentiates between functional connections necessary for high attention from connections associated with poor performance. Interestingly, there was no block effect, such that across blocks there was no change in network strengths of the two maps. In contrast, the mwCPM, as depicted in Figure 2 had a smaller effect (~0.06); although there was a block effect such that the MW combined model showed a lower difference in Block 1 of runs 1 and 2 compared to the latter three blocks (p<0.022), suggesting that this model may be better suited to detect changes in mind-wandering over time. Our combined model, shown in Figure 3, showed both a block effect (P<0.04) as well as a statistically significant difference (average difference = 0.12; p < 1e-30) between the network strengths of functional connections representing high attentional control and low mind-wandering and low attentional control and high mind-wandering.Discussion and Conclusions
Our results suggest that our two models derived in independent datasets are representative of high and low attentional states, thus making them appropriate targets for neurofeedback. The increase in network strength difference of the mwCPM model with time suggests that this model uniquely captures increasing mind-wandering in the gradCPT over time thus adding unique variance to the model. Our future directions include providing neurofeedback using the combined saCPM and mwCPM masks to increase the potential for neurofeedback training to enhance attentional control in older adultsAcknowledgements
No acknowledgement found.References
- Stoeckel, L.E., Garrison, K.A., et al, 2014. Optimizing real time fMRI neurofeedback for therapeutic discovery and development. Neuroimage Clin 5, 245–255.
- Hawkinson JE, Ross AJ, Parthasarathy S, Scott DJ, Laramee EA, Posecion LJ, Rekshan WR, Sheau KE, Njaka ND, Bayley PJ, DeCharms RC. Quantification of adverse events associated with functional MRI scanning and with real-time fMRI-based training. Int J Behav Med. 2012;19(3):372–381.
- Scheinost D, Hsu T.W., et al. Connectome-based neurofeedback: a pilot study to improve sustained attention. NeuroImage (2020), Article 116684
- Hasher, L, Zacks, RT. 1988. Working Memory, Comprehension, and Aging: A Review and a New View. In: Bower, GH, editor. Psychology of Learning and Motivation. Academic Press, p 193–225.
- Lustig, C, Jantz, T. 2015. Questions of age differences in interference control: When and how, not if? Brain Res. 1612: 59–69.
- Esterman, M., Noonan, S. K., Rosenberg, M., & DeGutis, J. (2013). In the zone or zoning out? Tracking behavioral and neural fluctuations during sustained attention. Cerebral Cortex, 23(11), 2712–2723. https://doi.org/10.1093/cercor/bhs261
- Fountain-Zaragoza et al., under review
- Bookheimer, S. Y., Salat, D. H., et al. (2019). The lifespan human connectome project in aging: An overview. NeuroImage, 185, 335–348.
Figures
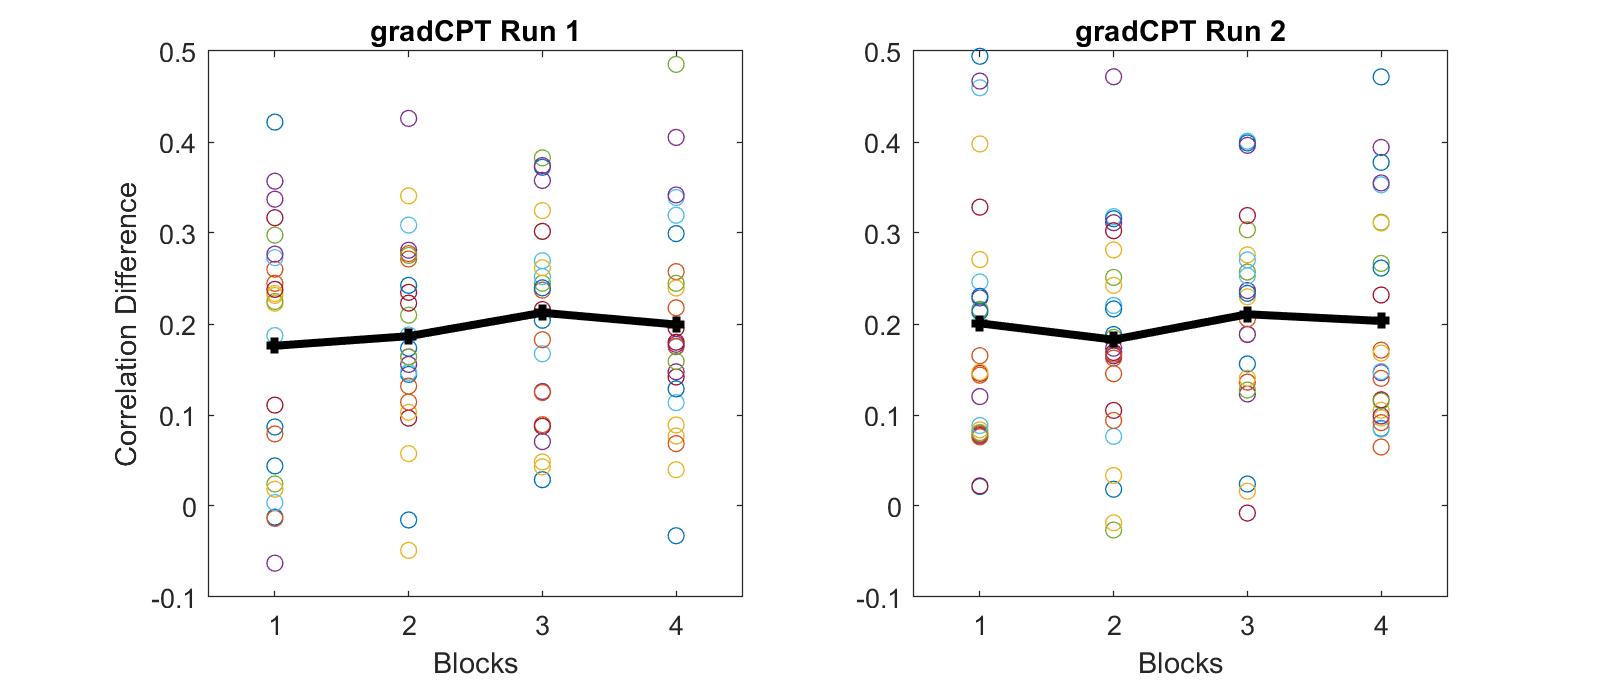
Figure 1. The correlation score difference
between high attention and low attention networks. The scatter plot colors code participants, and the black dots and lines are the average across participants.
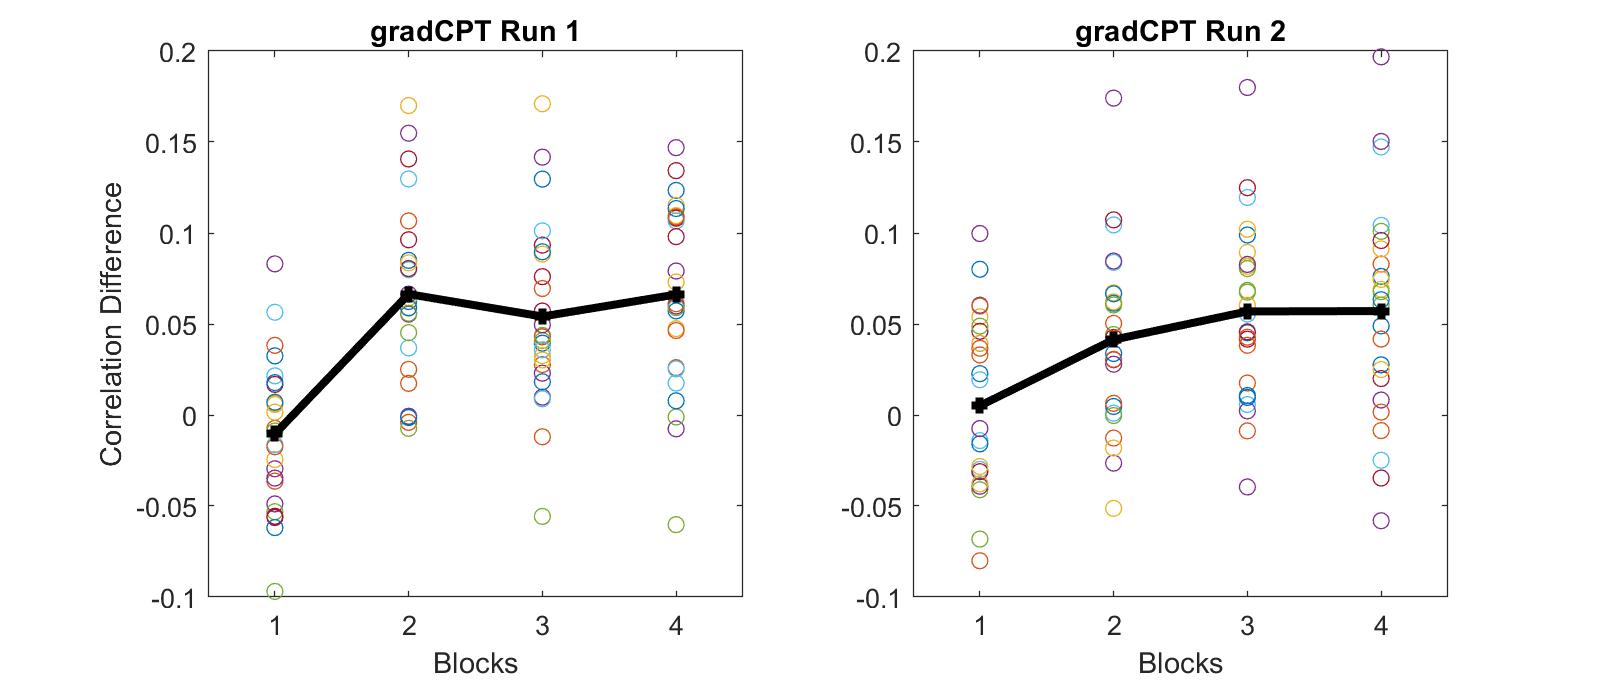
Figure 2. The correlation score difference between low mind-wandering and high mind-wandering networks. The score difference is significantly lower for the first block (p<2e-7 for Run1 and p<0.022 for Run 2), while they are not significant for later blocks.
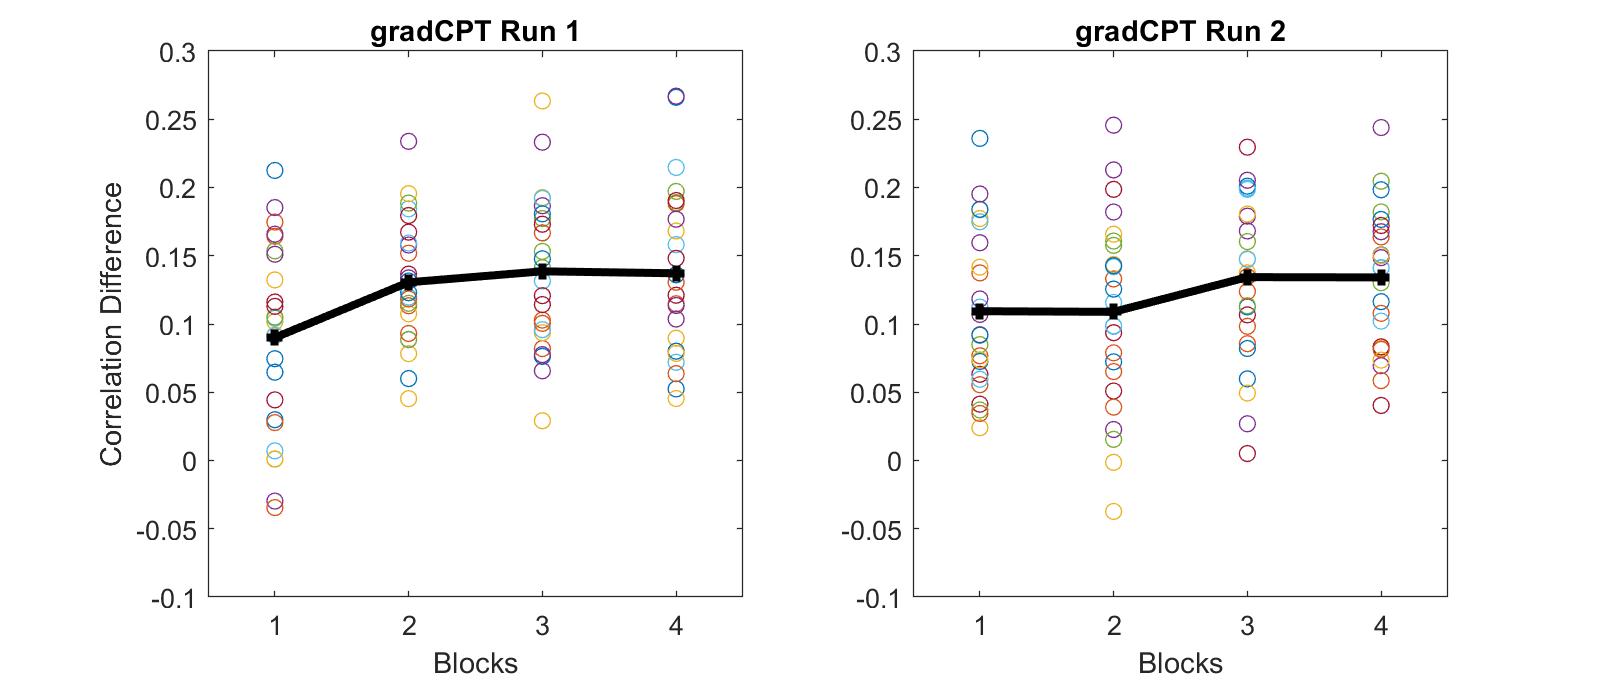
Figure 3. The correlation score difference between combined networks from both in Figures 1 and 2.