3143
Inter-group Heterogeneity of Regional Homogeneity (REHO)1Bishop's University, sherbrooke, QC, Canada, 2Diagnostic Radiology, University of Sherbrooke, sherbrooke, QC, Canada
Synopsis
Differences in REHO across groups may not be indicative of differences in neuronal activity. In this study, we investigate physiological contributions to REHO across 412 subjects in 9 separate datasets downloaded from OpenNeuro. Overall, we find the following: Inverse correlation between heartrate and REHO across subjects, inverse correlation between respiration and REHO across time, and differences in REHO across groups is driven primarily by FWHM of data and motion. We conclude that, due to REHO’s highly significant correlation with motion, heartrate, and respiration, REHO should be used with caution to infer differences in neuronal activity across groups.
Introduction
Regional homogeneity (REHO) originates from Kendall’s coefficient of concordance (KCC), used to measure similarity of the time series of a given voxel to those of its nearest neighbors. REHO is a widely-used method for resting state fMRI (rs-fMRI) analyses1. A number of studies have shown significant REHO differences observed in patients such as Parkinson’s Disease2, Bipolar Disorder3, Alzheimer4 and more. These studies use REHO as a proxy for increases/decreases in neuronal activity when interpreting, the blood oxygen-level-dependent (BOLD) signals. However, rs-fMRI measures are severely affected by multiple non-neuronal artifacts such as cardiac rate, respiration5 and head motion6.Despite dozens of reports linking REHO to neuropsychological disorders, the effects of non-neuronal artifacts on REHO has received little attention. Here, we investigate physiological contributions to REHO by analyzing correlations between REHO and physiology/motion at both single-subject level and group level. We also perform analysis pre/post Spatial Smoothing process and analysis after applying nuisance regression on REHO at subject level.
Materials and Methods
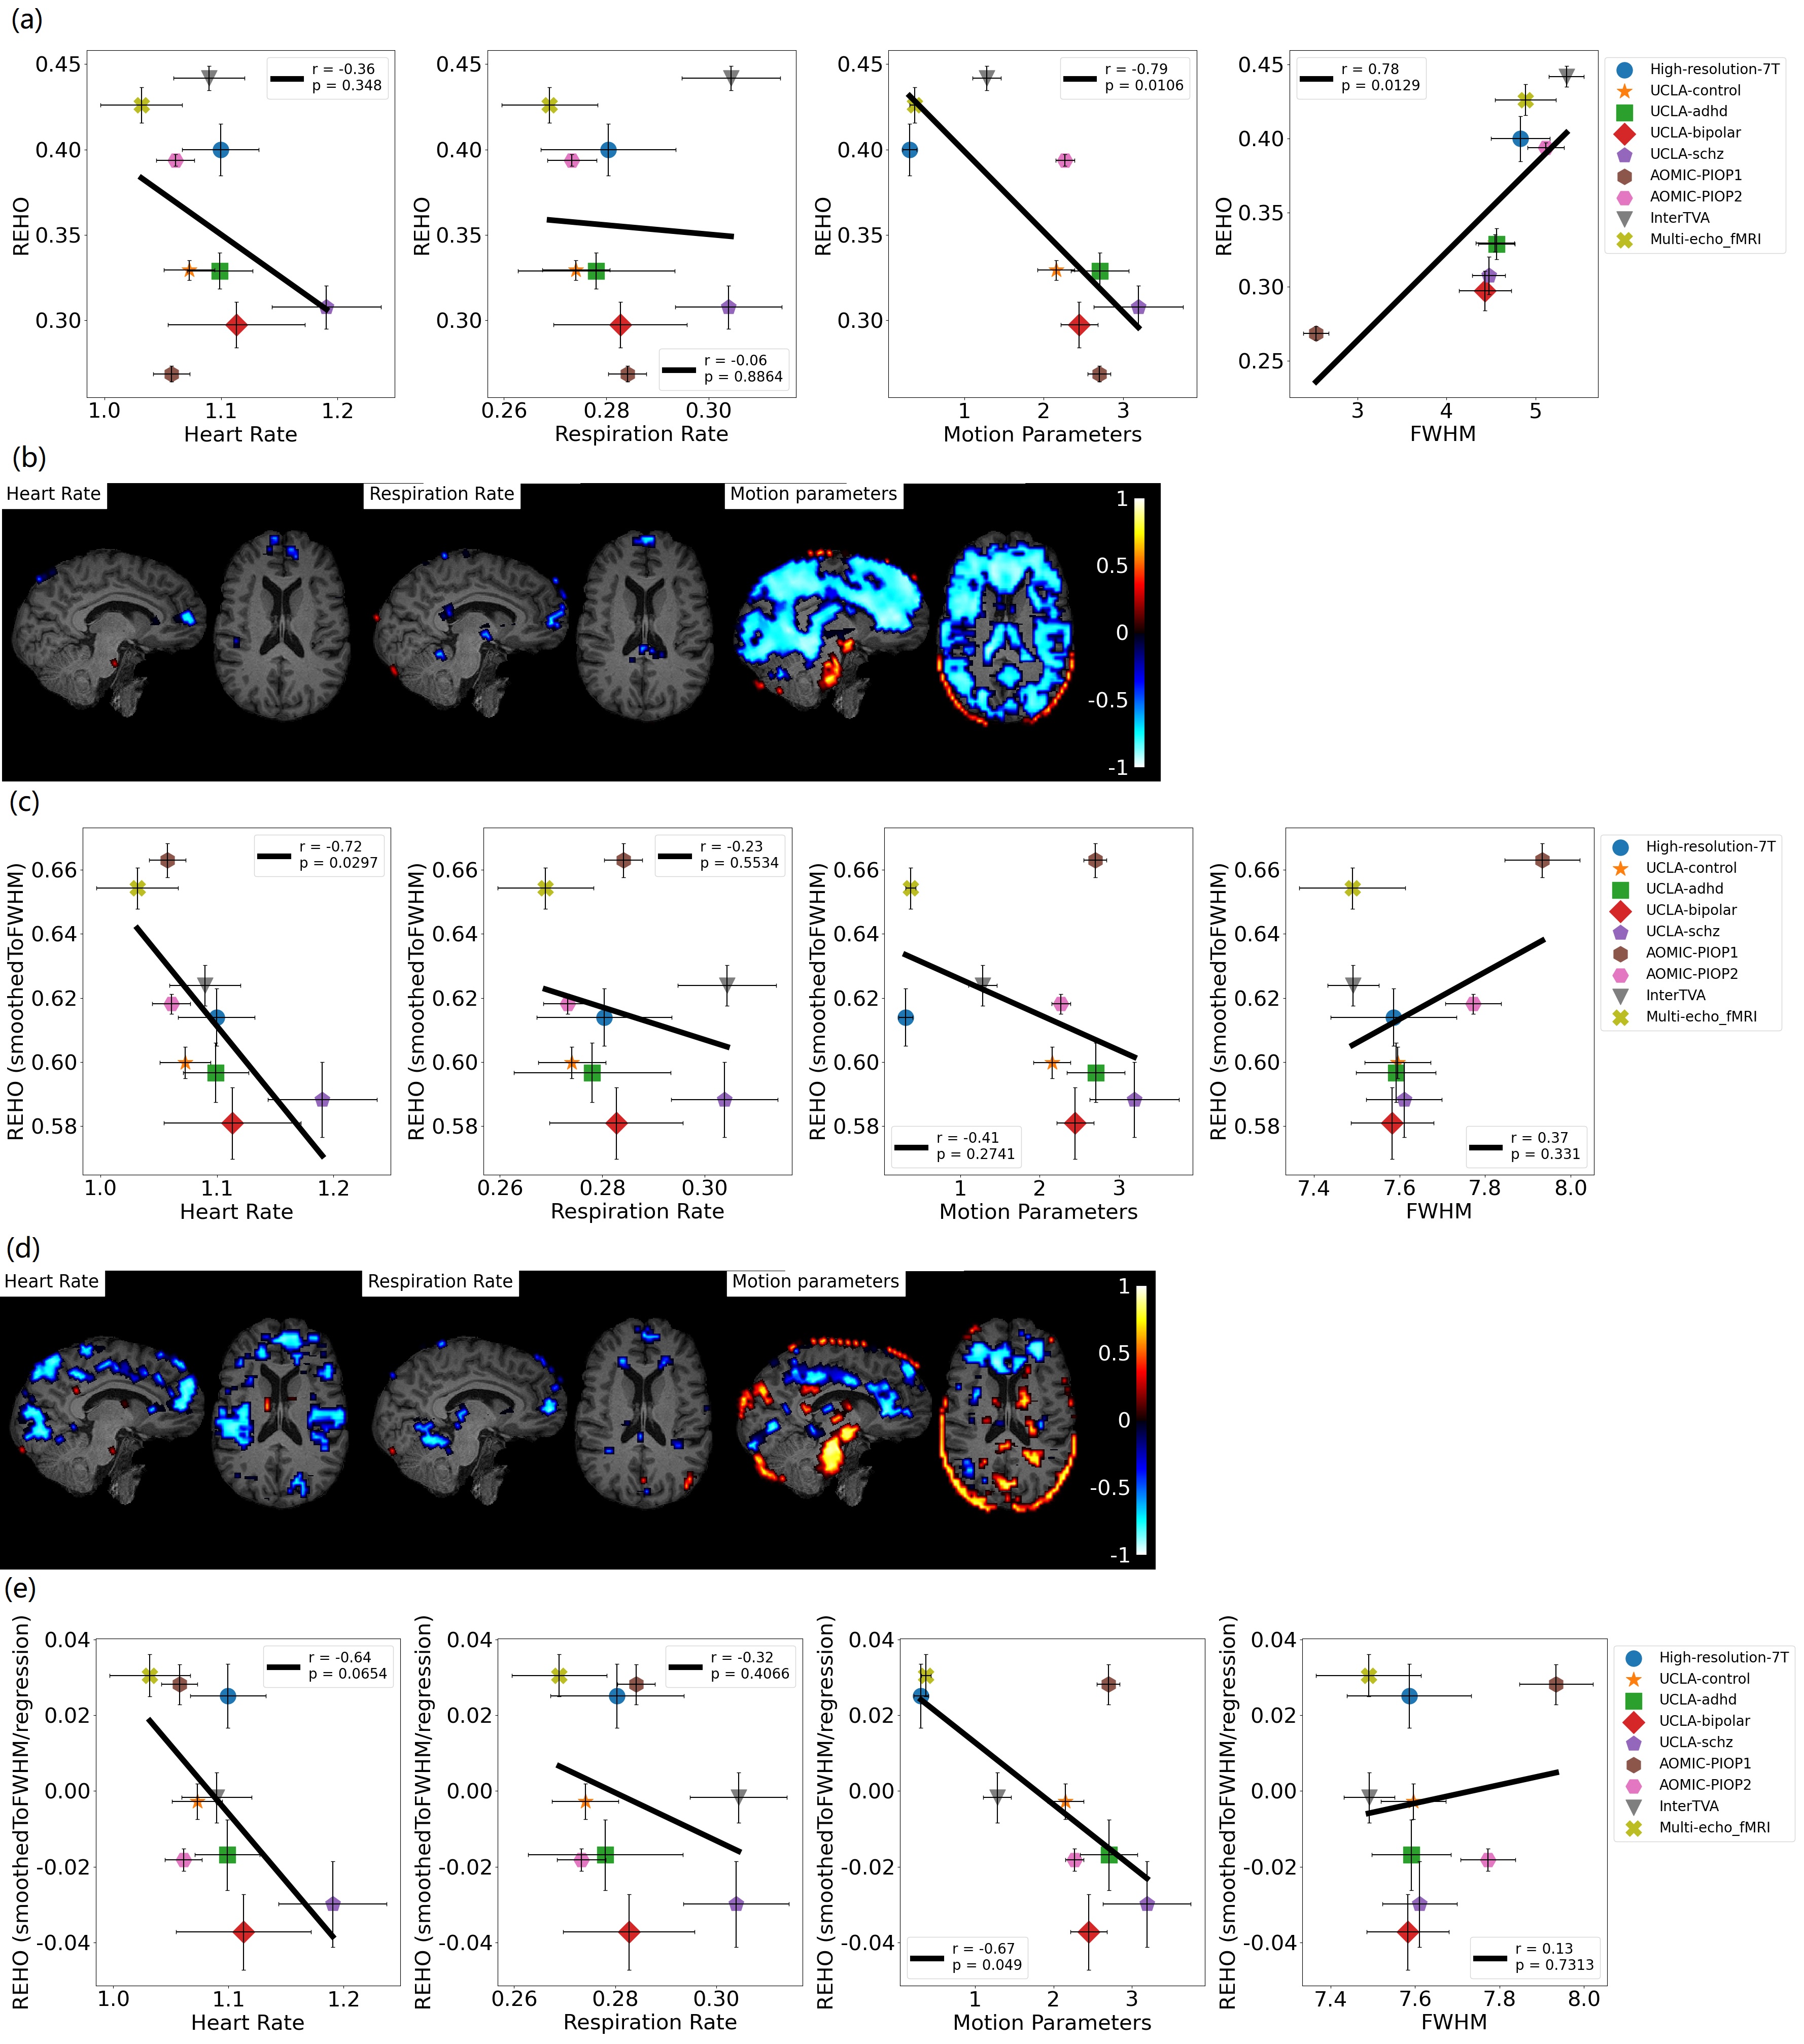
Datasets: Our study includes 9 datasets, which are UCLA_control, UCLA_adhd, UCLA_bipolar, UCLA_schz7,8, AOMIC_PIOP19, AOMIC_PIOP210,11, High-resolution-7T12,13, InterTVA14 and Multi-echo_fMRI15. We have resting-state fMRI with physiological data of 412 subjects including 352 healthy subjects and 60 with diseases including 167 men and 241 women with average age 25.3. All fMRI data are re-sampled to the same TR=2s (except for InterTVA TR=1.908s) and registered to voxel size 3 x 3 x 4 (mm). Motion correction, despiking, registration, bandpass (0.005 to 0.1 Hz) and smoothing (FWHM=8) were applied before calculating REHO.Nuisance (physiology and motion) regression was performed at the group level, after calculating REHO.
Physiological signals: heartrate (number of peaks divided by scanning time) was calculated. Respiratory signal was divided into 10 segments and respiratory rate (number of peaks divided by scanning time) was calculated for each segment separately. Motion time series were obtained by combining 6 realignment parameters of all dimensions to a single normalized motion parameter mp16.
All correlations are Pearson’s correlation coefficient (PCC), p-value<0.05 is considered as significant.
Results
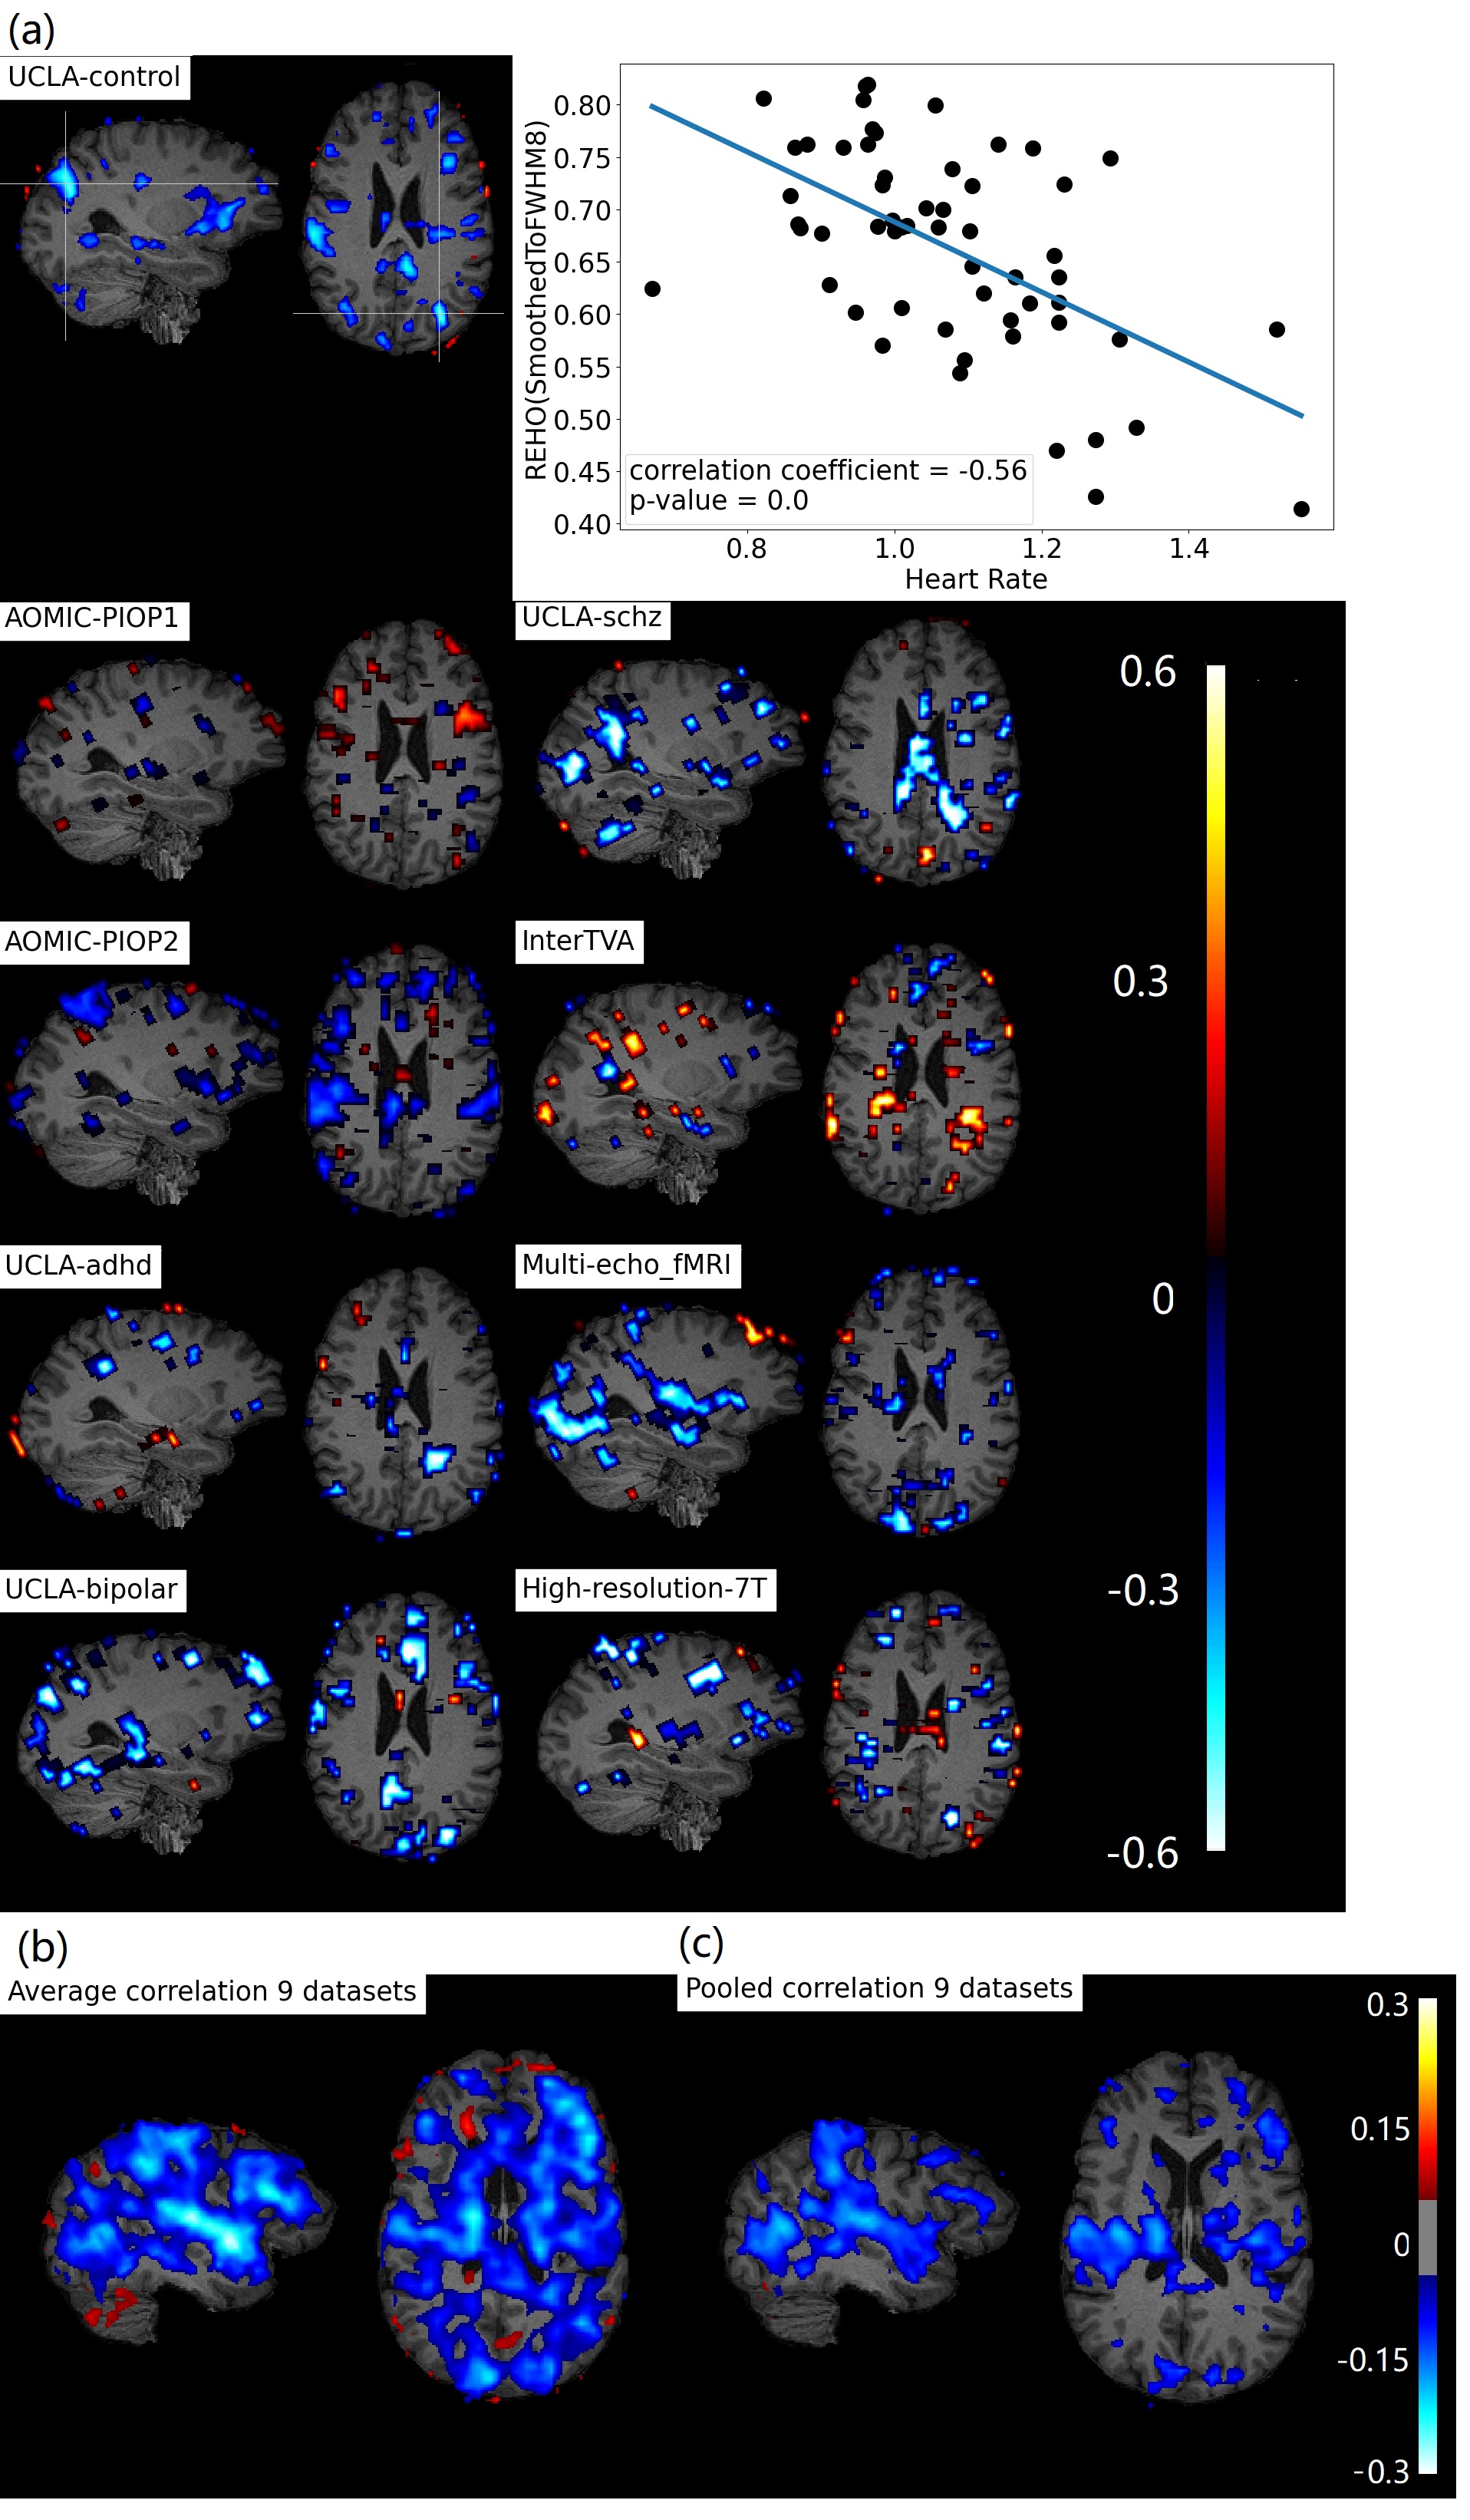
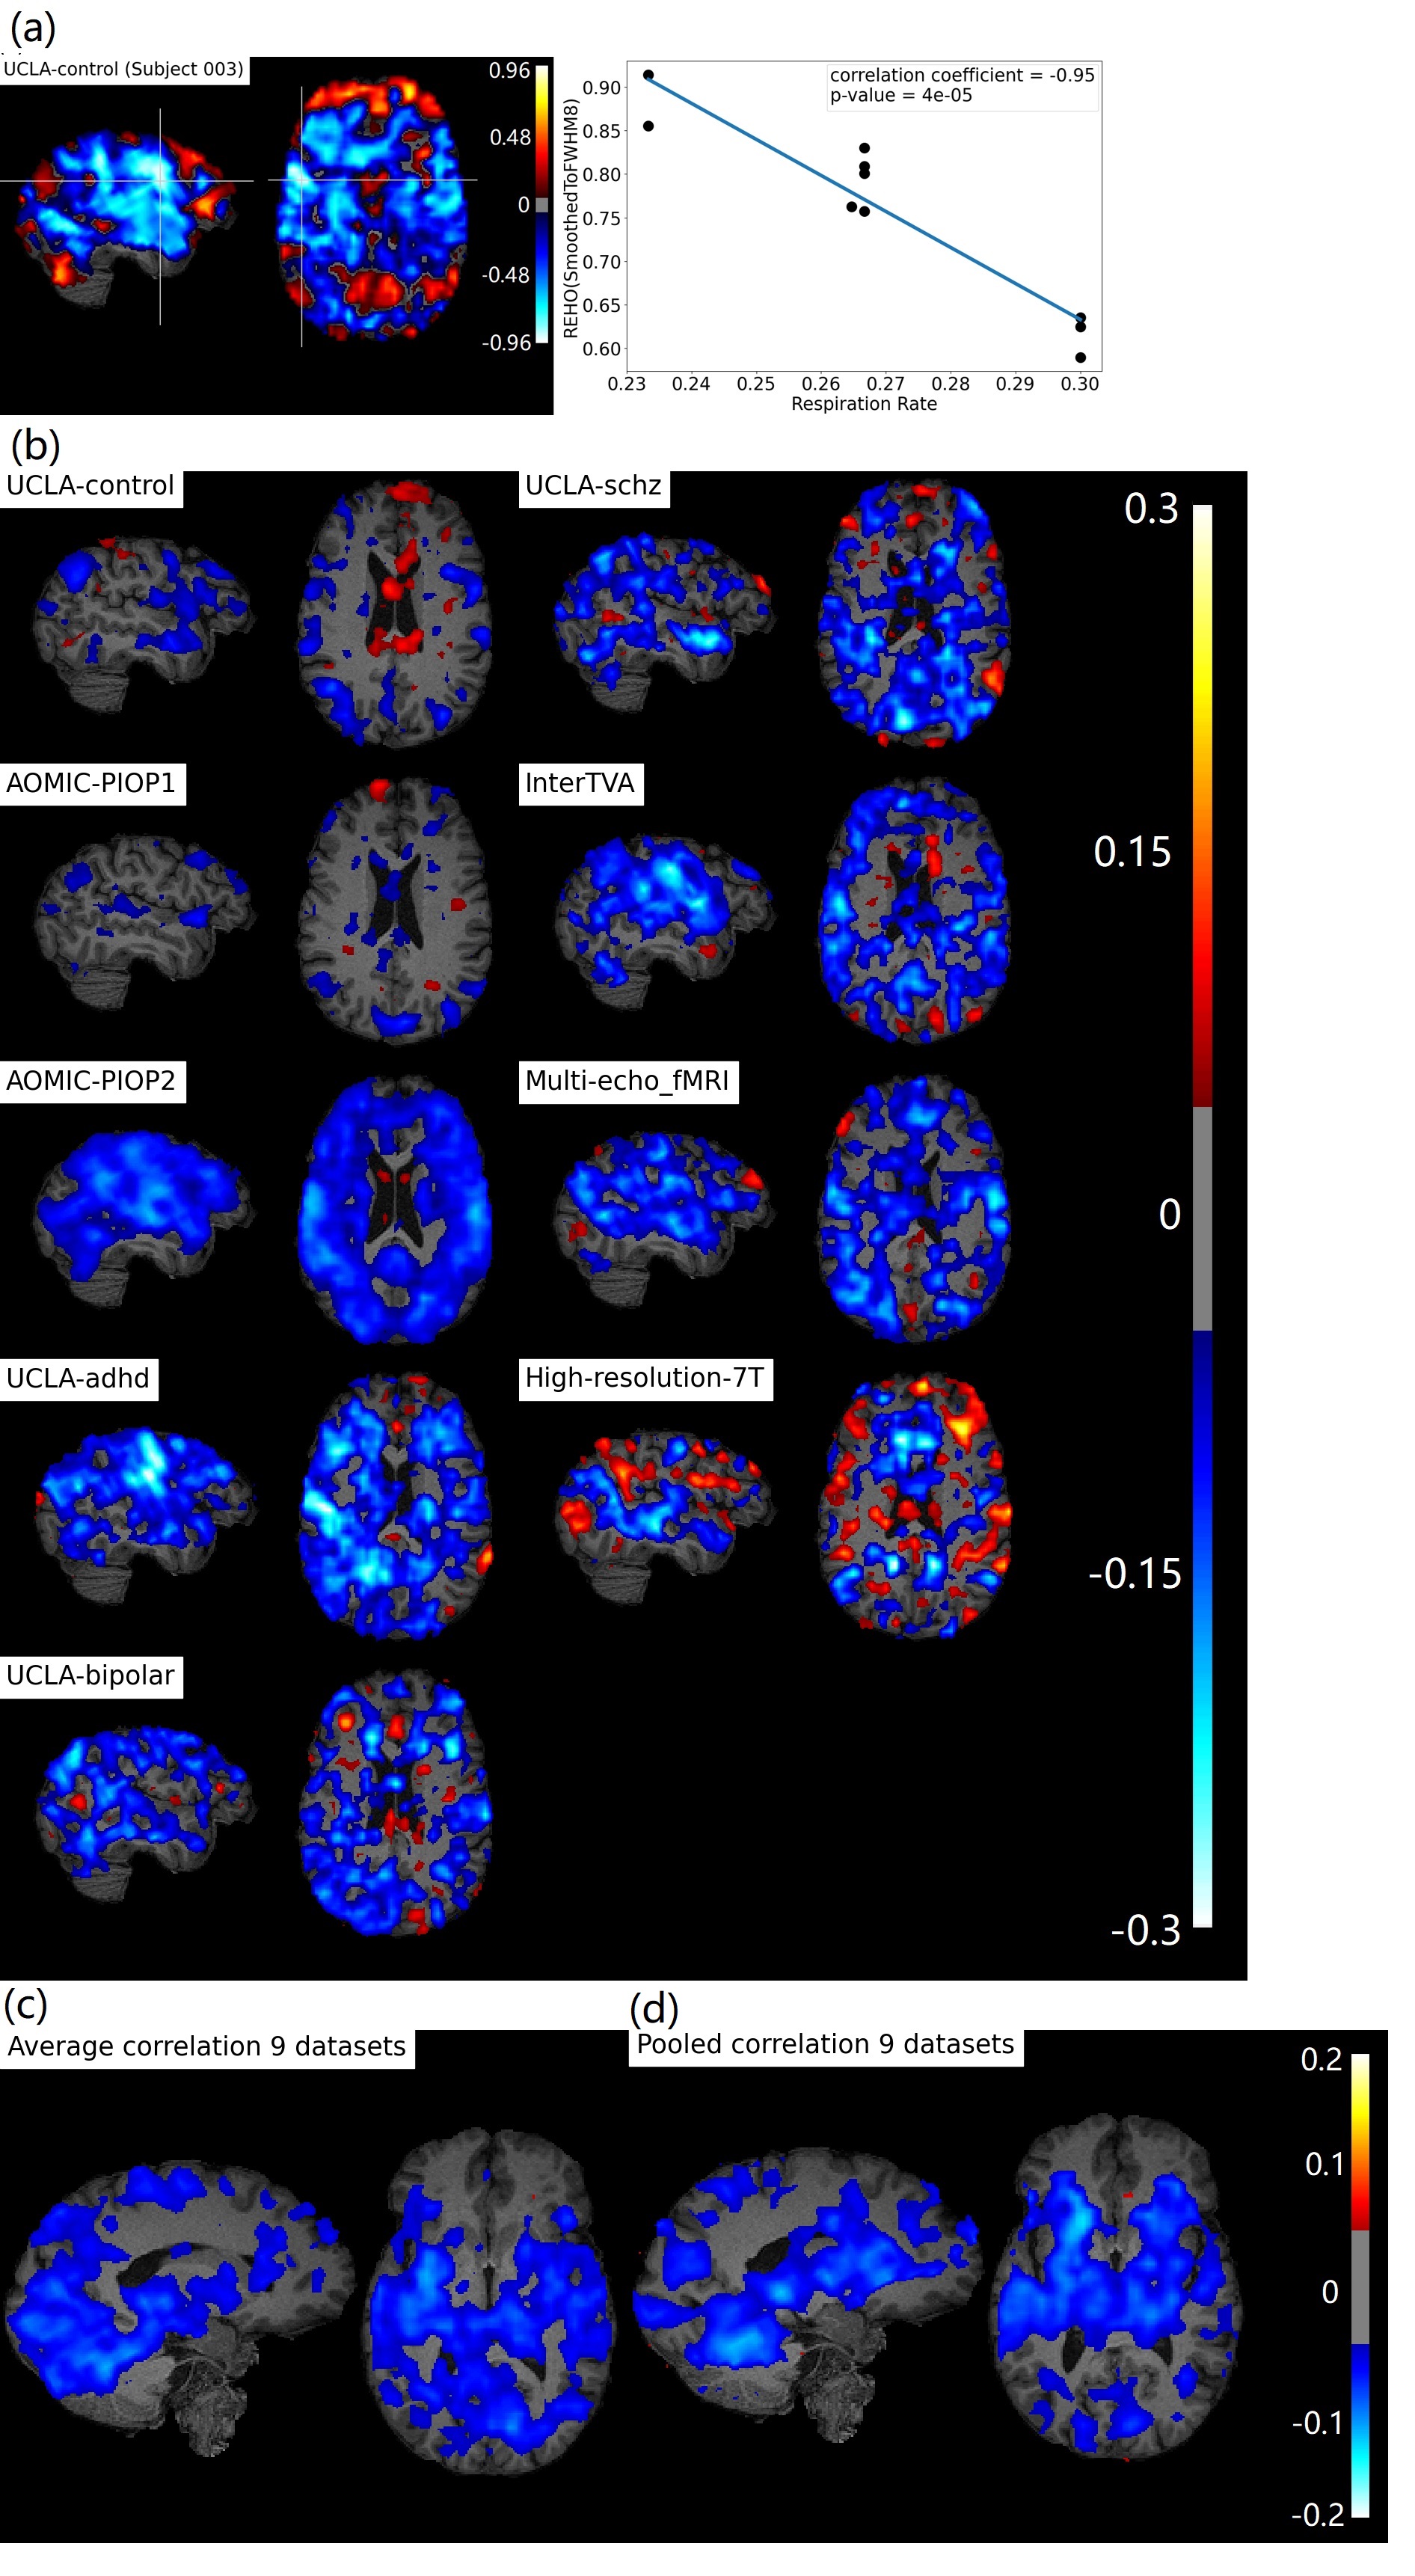
Figure 1b, c shows widespread, inverse relationship between heartrate and REHO, with peak values in the temporal lobe.In Figure 2, 6/9 datasets show significant wide spread inverse relationship between REHO and respiration across time. Correlations were strongest in the temporal lobe (similar with heartrate), parietal lobe and insula regions.
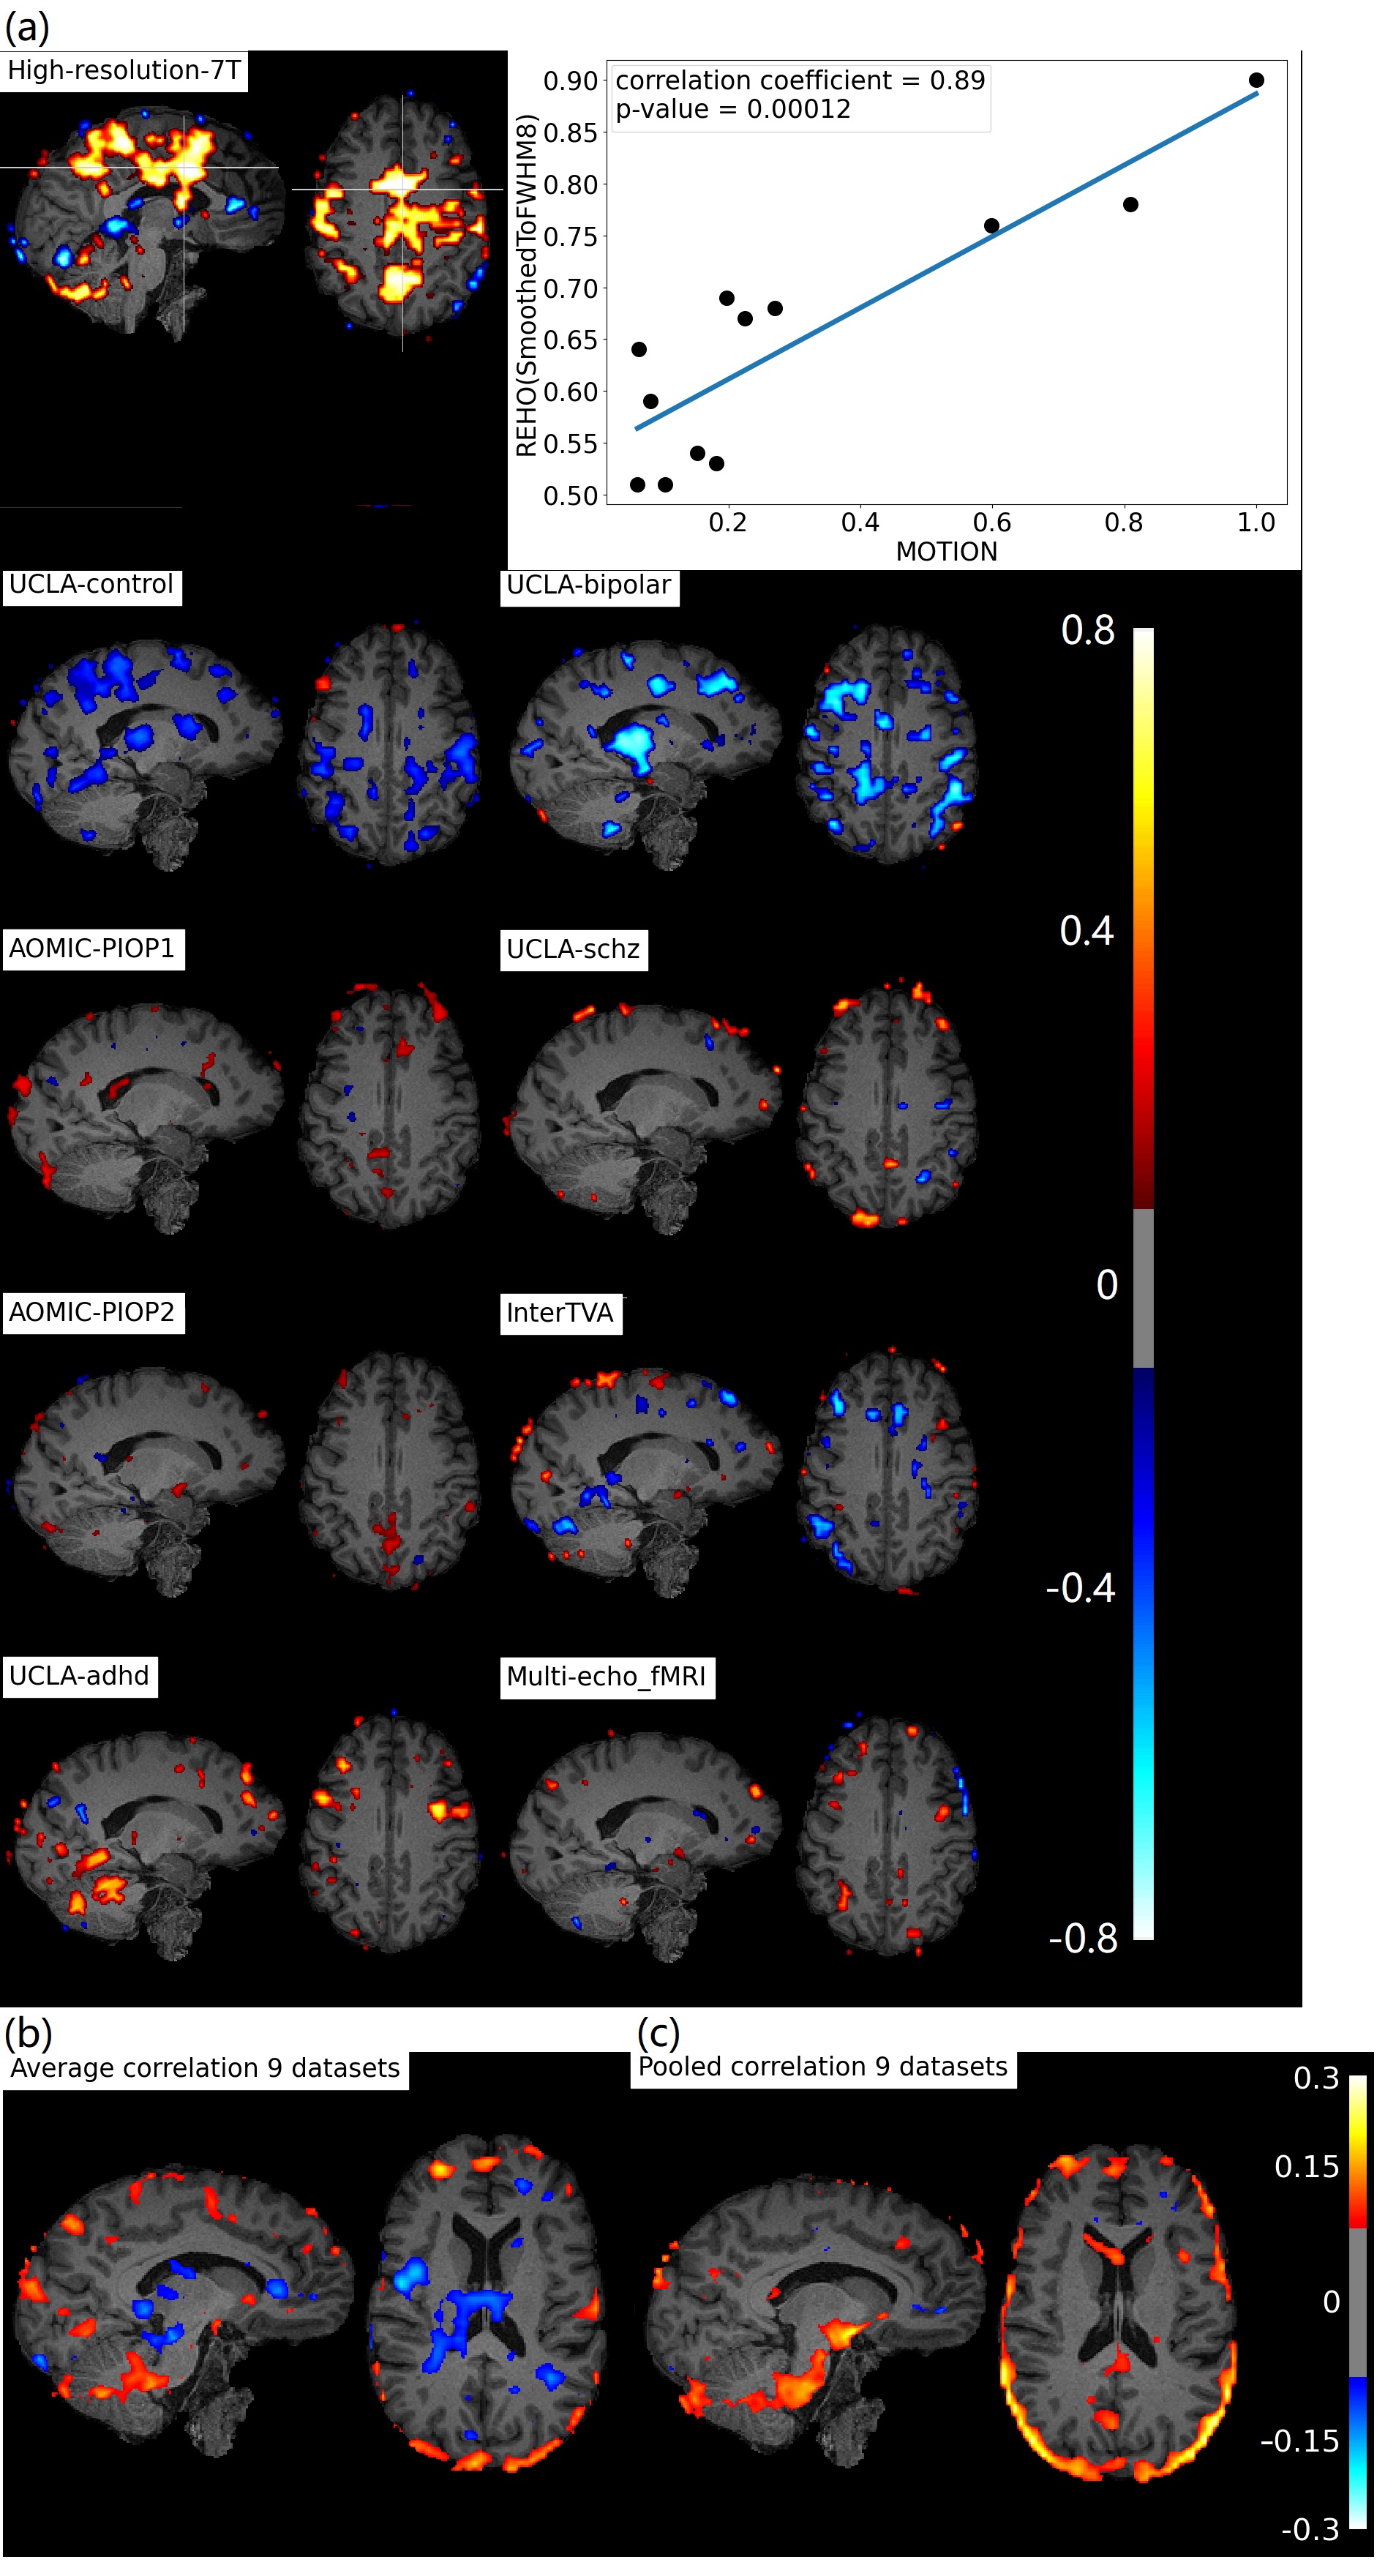
Figure 3b, c shows positive correlation between REHO and motion (r>0.15) in temporal lobe and edges of brain.
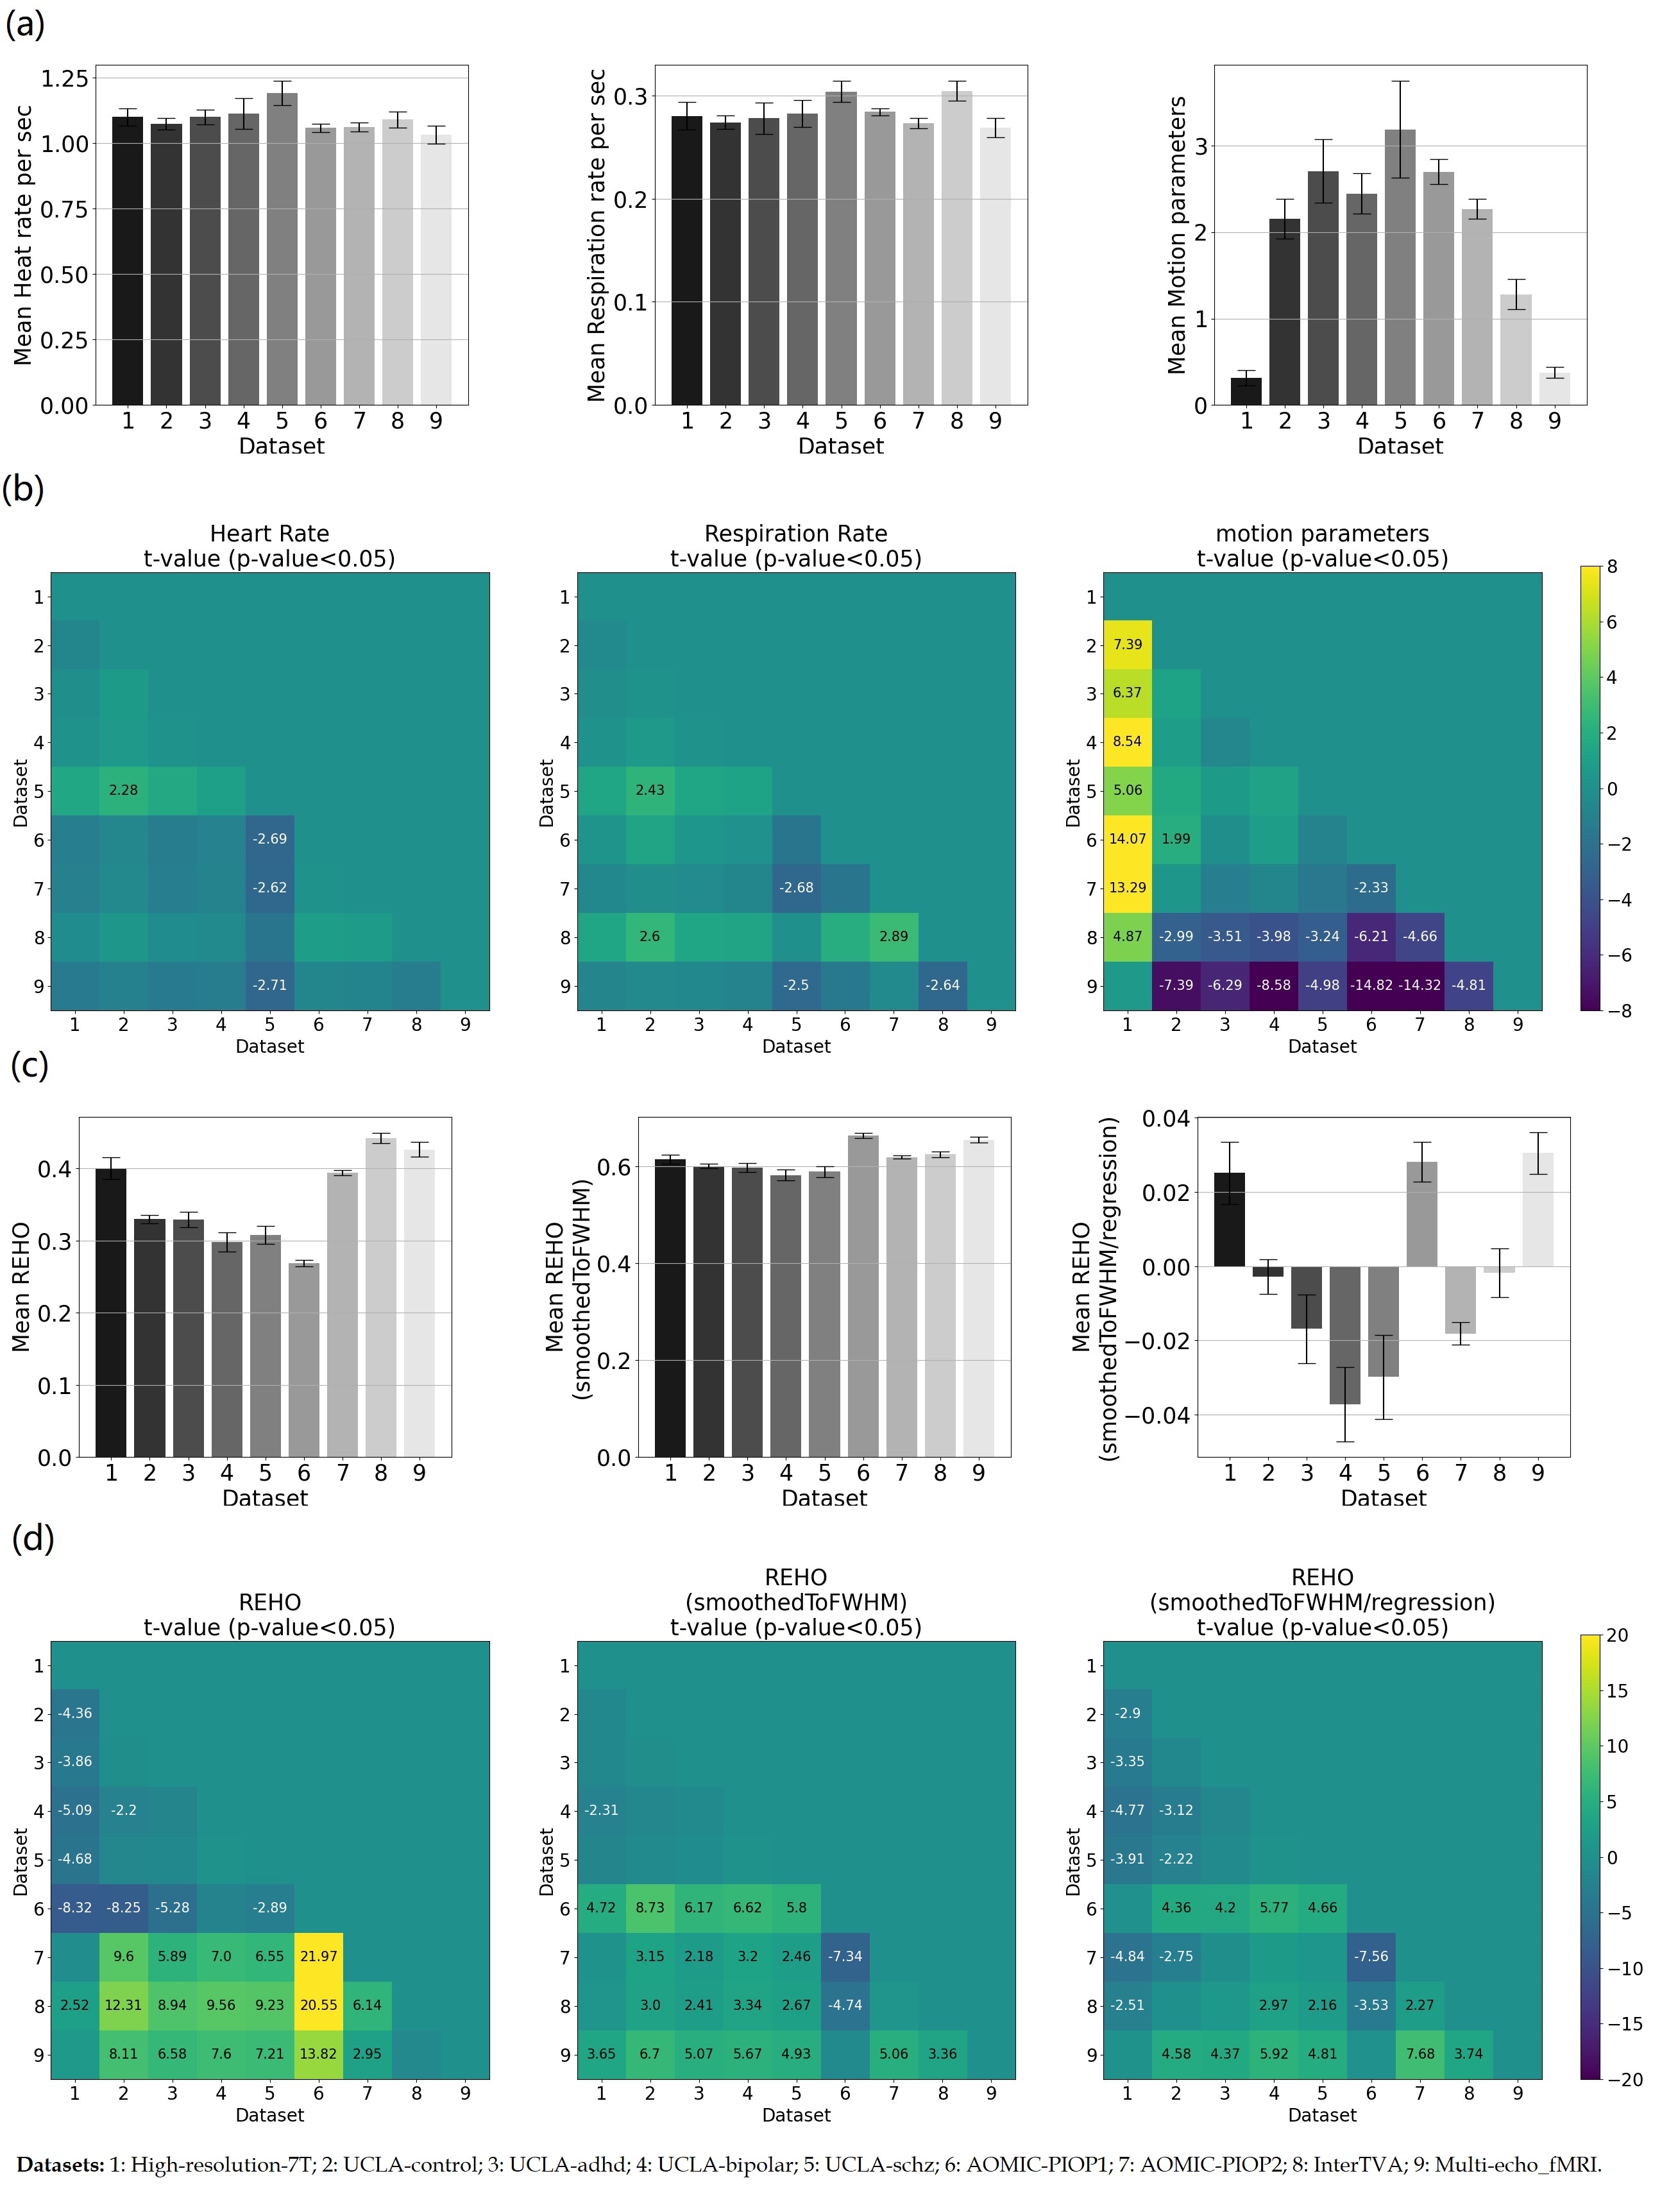
Figure 4a, c shows average differences in physiological parameters and REHO across groups. The difference of mean motion parameter among 9 datasets is more obvious than heartrate and respiration rate. After applying a ‘BlurToFWHM’, mean REHO values were increased across all datasets (Figure 4c center), and significant differences in REHO were reduced across datasets.
Figure 5a shows motion and FWHM were strongly associated to REHO at the group level. the entire brain shows high inverse relationship between REHO and motion (r>0.7) in Figure 5b. The REHO (after correcting the fMRI data using BlurToFWHM) vs heartrate shows strong inverse correlation in Figure 5c indicating that differences in raw data FWHM may obscure the heartrate vs REHO correlation, or that smoothing increases contribution of heartrate to REHO. After BlurToFWHM, the strong association between REHO and motion decreased. In Figure 5d significant negative correlation in heart rate vs mean REHO in frontal lobe and temporal lobe remains. High inverse relationship between mean full-brain REHO and motion remains high in frontal lobe. After regression, correlation of heartrate vs REHO was reduced but motion vs REHO shows an increasing inverse relationship.
Discussion
Heartrate: cardiac pulsatility generates small movements in brain tissue as well as inflow effects in and around vessels17. One should be cautious when claiming that increased or decreased REHO in temporal lobe (an area of dense vascularization) represents neurodegeneration or altered processing.Implications for dynamic functional connectivity: recently, dynamic functional connectivity has received increased attention. However, the inverse association between respiratory rate and REHO across time could confound studies of DFC, as removing effects of respiration from the BOLD signal is notoriously difficult.
Motion: motion artifacts have been recognized as potential confound for studies of RSFC for many years18, however we are not aware of any studies explicitly looking at effects of motion on REHO. By smoothing the data may help reduce effects of motion. Some evidence supports this19 showed smoothing all images to a uniform level across the sample, is an effective way to reduce motion-related confounds in functional connectivity studies.
We show that regressing out the effects of physiology and motion reduces the differences in REHO across datasets (Figure 4d), indicating that group difference in REHO are highly susceptible to differences in physiology/motion. We believe that many of the REHO effects reported in the literature are caused by group differences in physiology/motion, rather than intrinsic brain activity. We should also note that REHO differences between disease and control in dataset UCLA were weaker than that between UCLA control and other healthy groups, which indicates that it is probably meaningless to compare REHO across studies where the scanning environment and fMRI sequence parameters were not tightly controlled and uniform.
Acknowledgements
This research was supported by Natural Sciences and Engineering Research Council (NSERC)References
1. Zang Y, Jiang T, Lu Y, He Y, Tian L. Regional homogeneity approach to fMRI data analysis. Neuroimage. 2004;22(1):394-400. doi:10.1016/j.neuroimage.2003.12.030
2. Liu G, Lyu G, Yang N, et al. Abnormalities of diffusional kurtosis imaging and regional homogeneity in idiopathic generalized epilepsy with generalized tonic-clonic seizures. Exp Ther Med. 2019;17(1):603-612. doi:10.3892/etm.2018.7018
3. Shan X, Qiu Y, Pan P, et al. Disrupted Regional Homogeneity in Drug-Naive Patients With Bipolar Disorder. Front Psychiatry. 2020;11(August):1-10. doi:10.3389/fpsyt.2020.00825
4. Cheng J, Yang H, Zhang J. Donepezil’s effects on brain functions of patients with alzheimer disease: A regional homogeneity study based on resting-state functional magnetic resonance imaging. Clin Neuropharmacol. 2019;42(2):42-48. doi:10.1097/WNF.0000000000000324
5. Chang C, Cunningham JP, Glover GH. Influence of heart rate on the BOLD signal: The cardiac response function. Neuroimage. 2009;44(3):857-869. doi:10.1016/j.neuroimage.2008.09.029
6. Power JD, Cohen AL, Nelson SM, et al. Functional Network Organization of the Human Brain. Neuron. 2011;72(4):665-678. doi:10.1016/j.neuron.2011.09.006
7. Poldrack RA, Congdon E, Triplett W, et al. A phenome-wide examination of neural and cognitive function. Sci Data. 2016;3:1-12. doi:10.1038/sdata.2016.110
8. Bilder R, Poldrack R, Cannon T, et al. UCLA Consortium for Neuropsychiatric Phenomics LA5c Study.
9. Snoek L, Miesen M van der, Andries van der Leij, Tinka Beemsterboer, Annemarie Eigenhuis SS. AOMIC-PIOP1. Published online 2020. https://openneuro.org/datasets/ds002785/versions/2.0.0
10. Snoek L, van der Miesen M, Beemsterboer T, van der Leij A, Eigenhuis A, Scholte HS. The Amsterdam Open MRI Collection, a set of multimodal MRI datasets for individual difference analyses. Published online 2020:1-50. doi:10.1101/2020.06.16.155317
11. Snoek L, Maite van der M, Andries van der Leij, Tinka Beemsterboer, Annemarie Eigenhuis SS. AOMIC-PIOP2. Published 2020. https://openneuro.org/datasets/ds002790/versions/2.0.0
12. Gorgolewski KJ, Mendes N, Wilfling D, et al. A high resolution 7-Tesla resting-state fMRI test-retest dataset with cognitive and physiological measures. Sci Data. 2015;2:1-13. doi:10.1038/sdata.2014.54
13. Gorgolewski KJ, Mendes N, Wilfling D, Wladimirow E, Gauthier CJ, Bonnen T, Ruby FJM, Trampel R, Bazin PL, Cozatl R, Smallwood J MD. A high resolution 7-Tesla resting-state fMRI test-retest dataset with cognitive and physiological measures. Published 2019. https://openneuro.org/datasets/ds001168/versions/1.0.1
14. Aglieri V, Cagna B, Belin P, Takerkart S. InterTVA. A multimodal MRI dataset for the study of inter-individual differences in voice perception and identification. Published 2019. http://www.doi.org/10.18112/openneuro.ds001771.v1.0.2
15. DuPre E, Luh W-M, Spreng RN. Multi-echo fMRI replication sample of autobiographical memory, prospection and theory of mind reasoning tasks. Published 2018. https://openneuro.org/datasets/ds000210/versions/00002
16. Fellner MC, Volberg G, Mullinger KJ, et al. Spurious correlations in simultaneous EEG-fMRI driven by in-scanner movement. Neuroimage. 2016;133:354-366. doi:10.1016/j.neuroimage.2016.03.031
17. Dagli MS, Ingeholm JE, Haxby J V. Localization of cardiac-induced signal change in fMRI. Neuroimage. 1999;9(4):407-415. doi:10.1006/nimg.1998.0424
18. Power JD, Barnes KA, Snyder AZ, Schlaggar BL, Petersen SE. Spurious but systematic correlations in functional connectivity MRI networks arise from subject motion. Neuroimage. 2012;59(3):2142-2154. doi:10.1016/J.NEUROIMAGE.2011.10.018
19. Scheinost D, Papademetris X, Constable RT. The impact of image smoothness on intrinsic functional connectivity and head motion confounds. Neuroimage. 2014;95:13-21. doi:https://doi.org/10.1016/j.neuroimage.2014.03.035
Figures