3142
Individual-level parcellation of the human auditory cortex and comparison of their functional connectivity pattern1Department of Electrical and Computer Engineering, Sungkyunkwan University, Suwon, Korea, Republic of, 2Center for Neuroscience Imaging Research, Institute for Basic Science (IBS), Suwon, Korea, Republic of, 3Department of Neuroscience, Max Planck Institute for Empirical Aesthetics, Frankfurt am Main, Germany, 4School of Electronic and Electrical Engineering, Sungkyunkwan University, Suwon, Korea, Republic of
Synopsis
Determination of the exact location and extent of a brain area at an individual level is crucial but challenging in in-vivo neuroimaging studies. We developed an analysis pipeline to parcellate the primary auditory cortex and its vicinity at an individual level with diffusion tensor imaging. Resulting three clusters, the central cluster and the two other flanking clusters, exhibited distinct functional connectivity patterns with the rest of the whole brain indicating that these clusters contribute to different functional networks.
Purpose
Heschl's gyrus (HG) serves as an anatomical landmark for locating the human primary auditory cortex (PAC) [1]. Determination of the exact location and the extent of PAC at an individual level in vivo, however, has been challenging due to the great variance across individuals. In this study, we aimed 1) to develop a pipeline to parcellate the PAC and its vicinity at an individual level based on their structural connectivity (SC) patterns from diffusion tensor imaging and then 2) to characterize the distinct functional connectivity (FC) pattern of the parcellated clusters with resting-state functional magnetic resonance imaging (rs-MRI).Methods
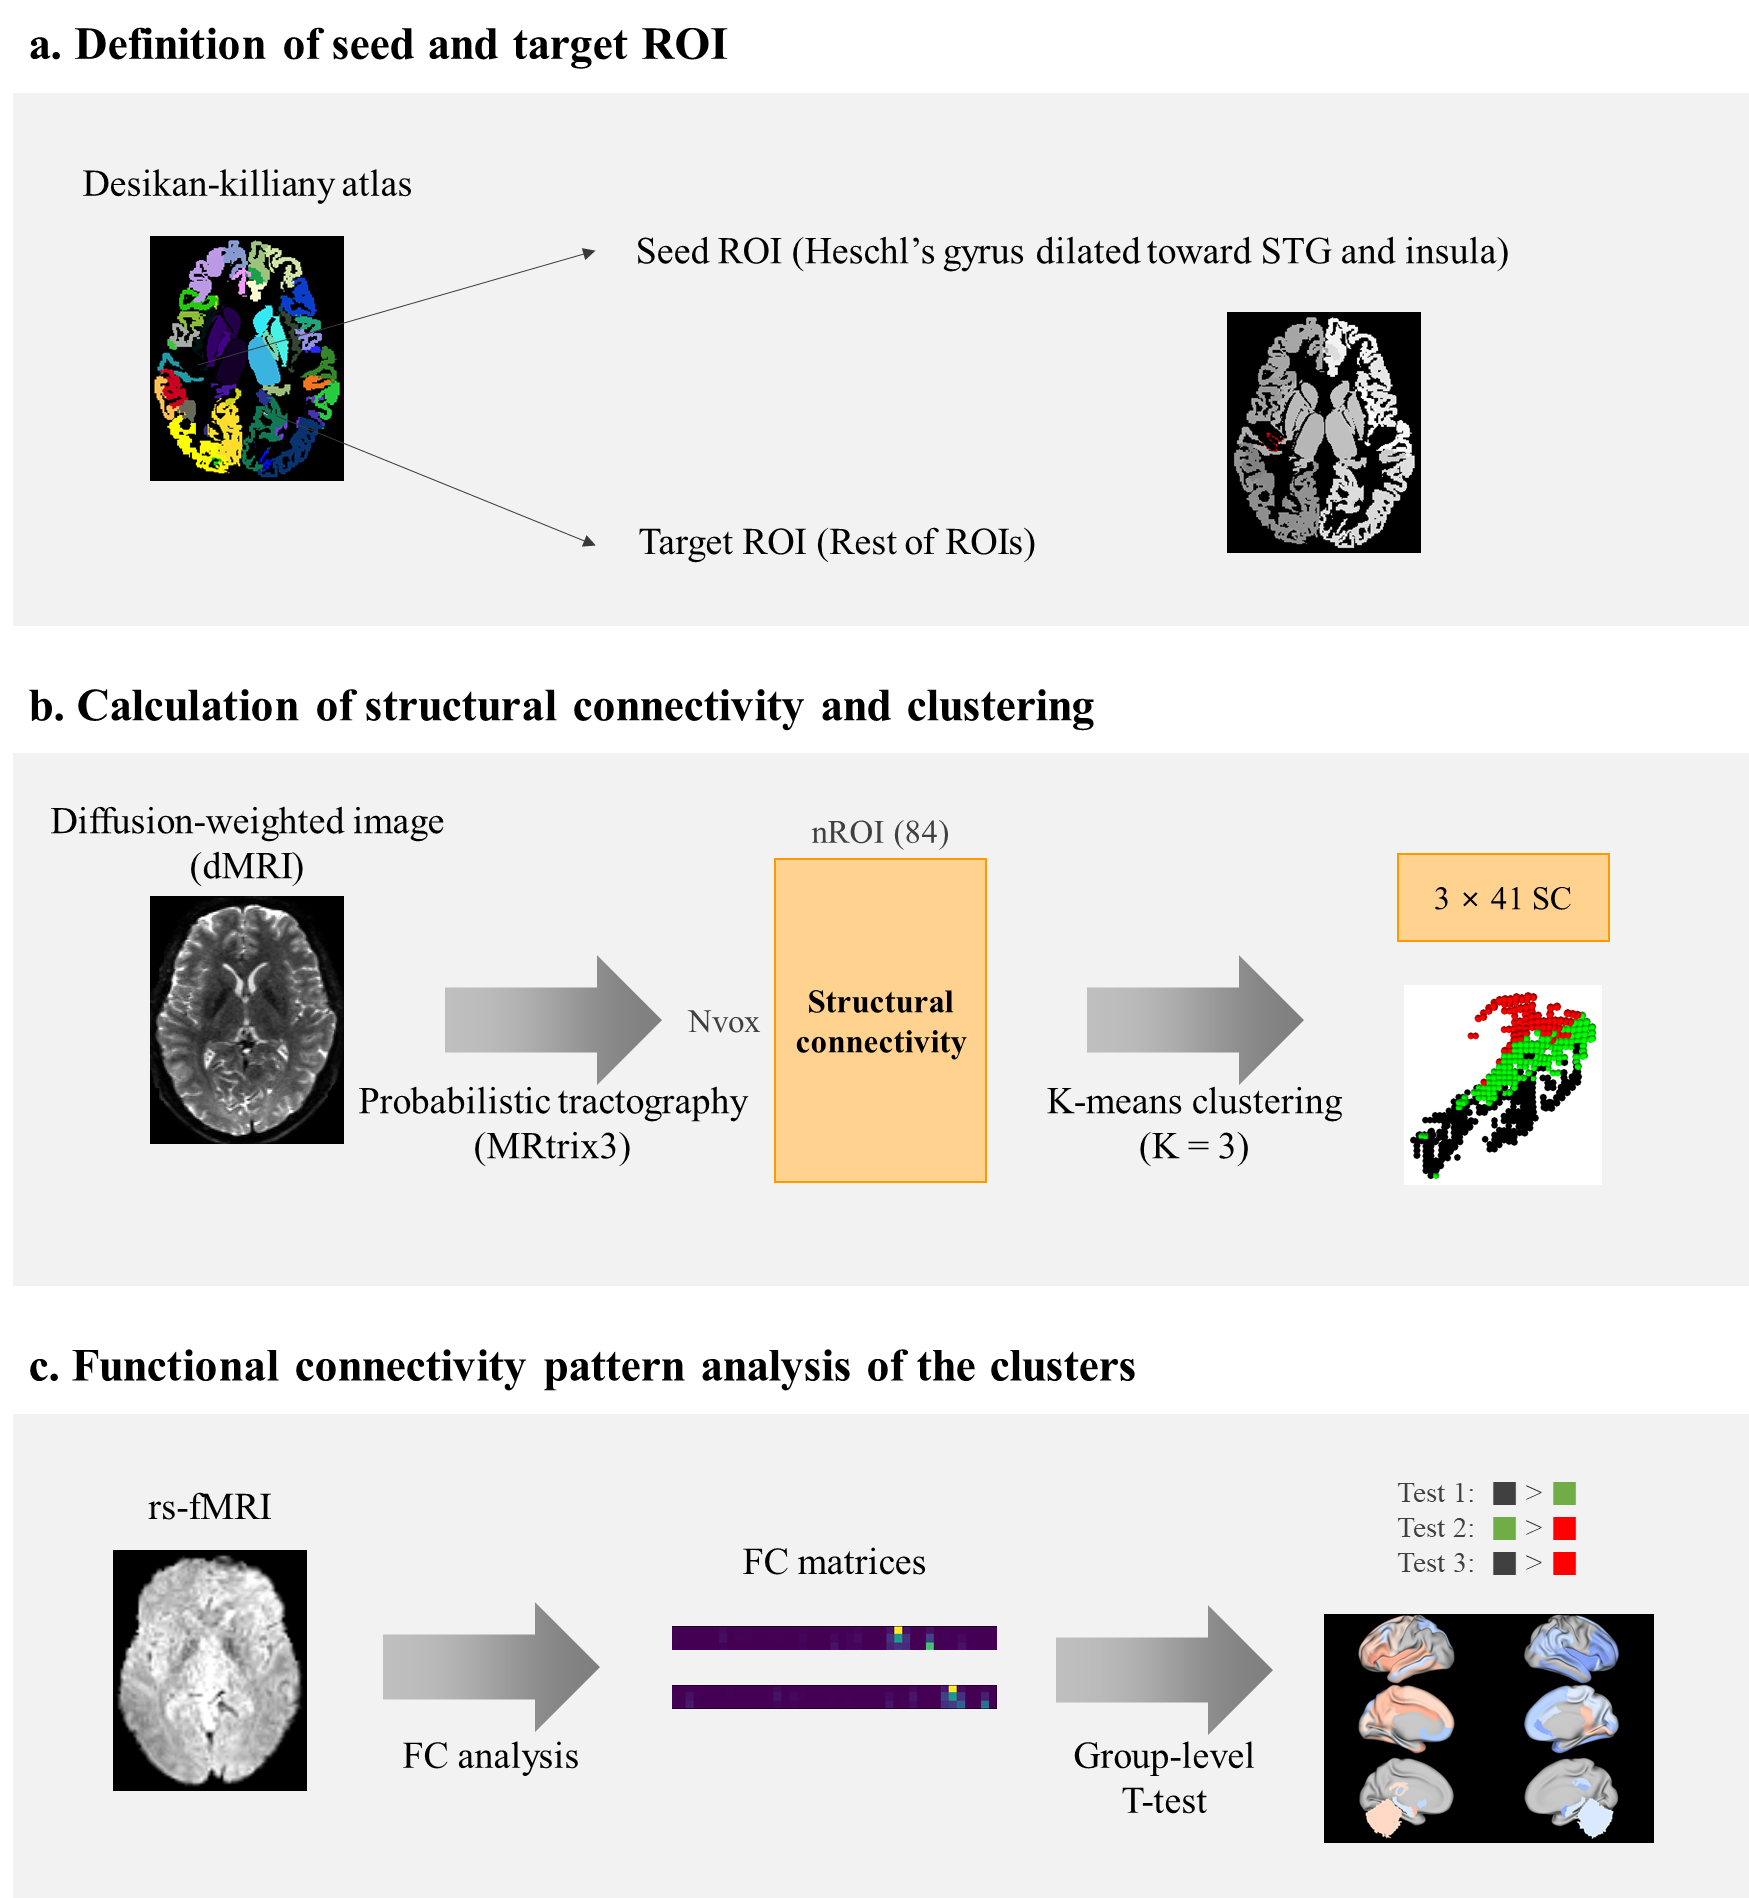
Data acquisition and processing:We adopted the diffusion-weighted imaging (DWI) and rs-fMRI data of 628 participants from the Human Connectome Project S1200 release [2]. We performed probabilistic tractography with DWI data using the MRtrix3 pipeline [3]. The initial seed was defined as HG from the Desikan-Killiany atlas, and it was dilated 2.1mm toward the superior temporal gyrus (STG) and insula. The target regions of interest (ROIs) were defined as the rest of ROIs in the same atlas. SC matrix was obtained as a result of the tractography, whose values indicate the number of streamlines between the seed and the target ROIs. The seeds were voxels in the initial seed region. The data processing pipeline is summarized in Figures 1a and b.
Clustering:
K-means clustering using SC as input was performed to parcellate the PAC and its vicinity. The target ROIs in the corresponding hemisphere were considered when clustering the initial seed ROI of a given hemisphere. Zero-valued connectivity between HG and ROIs were excluded from the input features. The elbow method was applied to inertia, the sum of squared distances of samples to their closest cluster center, to determine the optimal number of clusters. The number of clusters tested was from two to ten. The clustering process is shown in Figure 1b.
FC pattern analysis:
We also explored the FC pattern of those subregions to investigate if they subserve distinct functional networks. Preprocessed and registered rs-fMRI was used. The FC matrix between the seed voxels and the target ROIs was computed using Pearson’s correlation of mean blood-oxygen-level-dependent signal from rs-fMRI. Soft-thresholding and r-to-z transform were applied to ensure small-worldness topology [4]. The FC value was averaged for each cluster and the one-tailed t-test was applied to mean FC values for each ROI. There were six types of test initially: cluster 1 > cluster 2, cluster 2 > cluster 3, and cluster 1 > cluster 3 and vice versa for each case. For cluster comparisons, there were 82 tests, where 82 is the number of ROIs. For the final analysis, tests in between the flanking clusters (cluster 1 and cluster 3) were considered. The significantly different features were detected with level 0.05 (false discovery rate-corrected p-value / 2 > 0.05). The steps for FC pattern analysis are shown in Figure 1c.
Results and Discussion
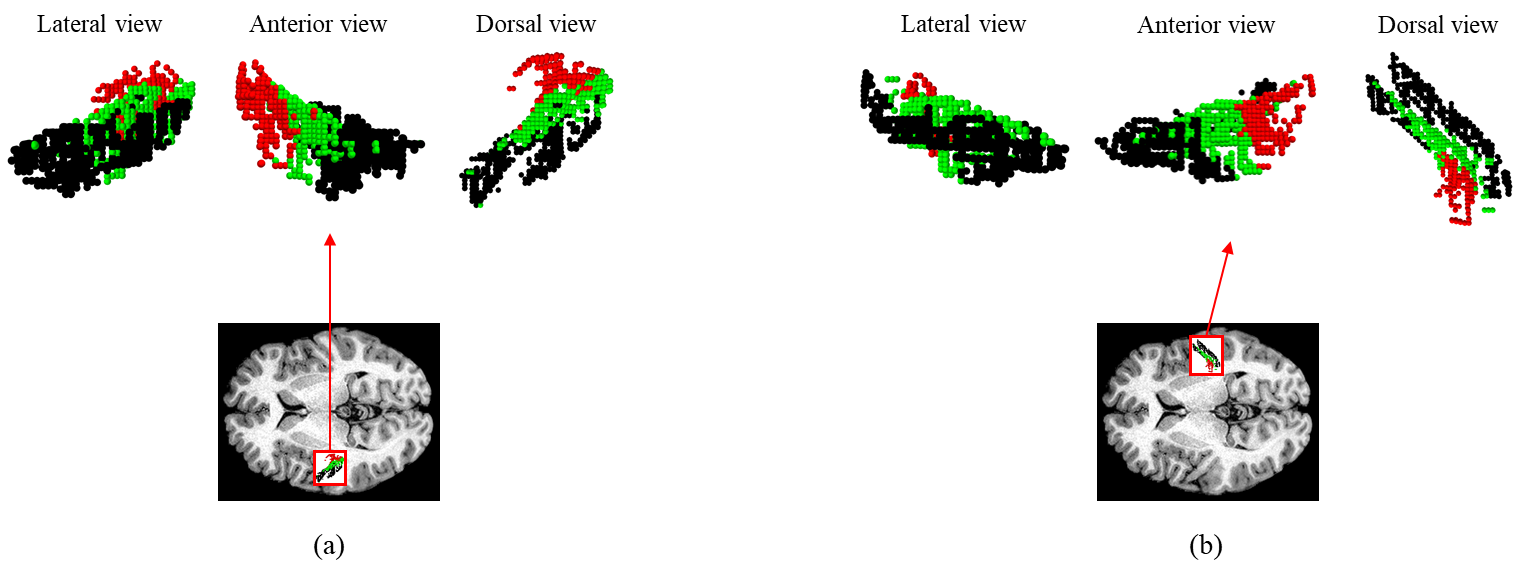
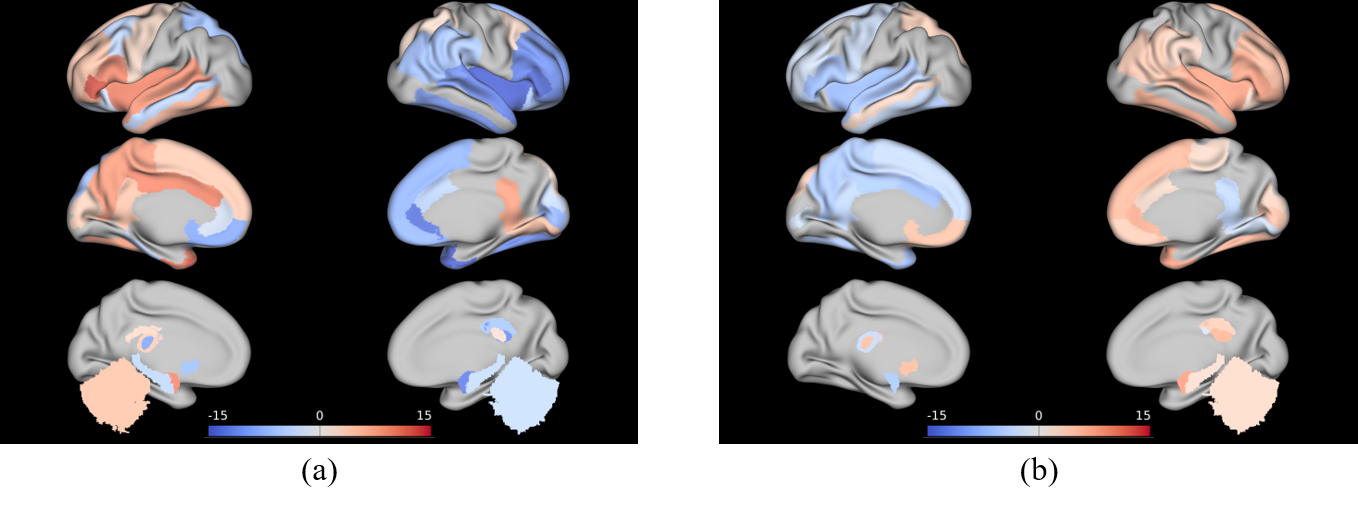
As a result of k-means clustering, the optimal number of the cluster was three for both hemispheres. Clustering divided the initial ROI into 1) the central part (cluster 2) that occupied the most of HG, which was flanked by 2) the anterior-lateral part (cluster 1), and 3) the posterior-medial part (cluster 3). Such parcellation scheme was consistent across subjects. Comparing to other literature, cluster 1 appeared comparable to the combination of Te1.1 and Te2, whereas cluster 3 appeared comparable to the combination of Te3 and TI1 [5]. Comparing to the monkey auditory cortex, the two flanking clusters resembled the belt area, the secondary auditory cortex surrounding the primary core area [6]. The exemplary clustering results are shown in Figure 2.As a result of the strength of the FC patterns, cluster 2 showed higher connections with local areas compared to other clusters. Cluster 1 in the left hemisphere showed significantly high connections with insula, STG, Brodmann area 44 and 45 in the ipsilateral hemisphere. Interestingly, these regions are known to be involved in dorsal and ventral pathways of the language network [7]. Cluster 3 in the left hemisphere showed significantly high connections with the regions mentioned above but in the contralateral hemisphere. The cluster 1 and cluster 3 in the right hemisphere, on the other hand, showed similar patterns but the lateralization in between the two clusters was much reduced. The results are shown in Figure 3.
Conclusion
We developed an in-vivo analysis pipeline for parcellation of the PAC by clustering SC information at an individual level. This putative PAC was flanked by two additional clusters, the anterior-lateral and the posterior-medial clusters. These two flanking clusters exhibited distinct FC patterns indicating that they contributed to different functional networks.Acknowledgements
This research was supported by National Research Foundation (NRF-2020M3E5D2A01084892), Institute for Basic Science (IBS-R015-D1), Ministry of Science and ICT (IITP-2020-2018-0-01798), IITP grant funded by the AI Graduate School Support Program (2019-0-00421), and ICT Creative Consilience program (IITP-2020-0-01821).References
1. Da Costa, Sandra, et al. "Human primary auditory cortex follows the shape of Heschl's gyrus." Journal of Neuroscience 31.40 (2011): 14067-14075.
2. Van Essen, David C., et al. "The WU-Minn human connectome project: an overview." Neuroimage 80 (2013): 62-79.
3. Tournier, J-Donald, et al. "MRtrix3: A fast, flexible and open software framework for medical image processing and visualisation." NeuroImage 202 (2019): 116137.
4. Bassett, Danielle Smith, and E. D. Bullmore. "Small-world brain networks." The neuroscientist 12.6 (2006): 512-523.
5. Morosan, Patricia, et al. "Human primary auditory cortex: cytoarchitectonic subdivisions and mapping into a spatial reference system." Neuroimage 13.4 (2001): 684-701.
6. Morel, Anne, and Jon H. Kaas. "Subdivisions and connections of auditory cortex in owl monkeys." Journal of Comparative Neurology 318.1 (1992): 27-63.
7. Friederici, Angela D., and Sarah ME Gierhan. "The language network." Current opinion in neurobiology 23.2 (2013): 250-254.
Figures