3138
Investigation of altered brain activation based on MultiBand fMRI: A Graph Theory study1LanZhou University Second Hospital, lanzhou, China, 2Philips Healthcare, Xi'an, China
Synopsis
To test the advantages of multiband (MB) over single band echo planar imaging (EPI) acquisition schemes from the whole brain network level by using graph theory. Our results demonstrated that MB resting-state functional MRI (MB rs-fMRI) may provide much more insightful information than conventional rs-fMRI.
Introduction
Rs-fMRI has become a valuable tool for investigating spontaneous brain activity without task execution. Graph theory has been proved as a reliable, consistent and powerful framework in examining the topological properties of individual brain networks. It was observed that reliability of rs-fMRI connectivity analysis can be augmented by increasing the number of time points and total scan duration. With recent advancement in EPI, MB allows simultaneous acquisition of multiple slices in brain in fMRI. This capability allows scanning at sub-second temporal resolution with better noise estimation and spatial de-aliasing[1]. Several studies have applied MB in tasks-fMRI and tested its ability in detecting BOLD response of specific ROIs[2, 3]. In order to estimate the advantages of MB acquisition over single band EPI acquisition schemes from whole brain networks level, we compared signal characteristics as well as brain network topological properties between conventional rs-fMRI and MB rs-fMRI.Methods
Thirty-one (10 males, 21 females) right-handed healthy volunteers (20.2±1.1 yrs; range 19-23 yrs) from Lanzhou University were recruited. All participants underwent conventional rs-fMRI and multiband rs-fMRI scanning on a 3T scanner (Ingenia CX, Philips Healthcare, the Netherlands) with a 32-channel head coil. The protocols of conventional rs-fMRI and MB rs-fMRI were same except TR = 2000 ms/TE = 20 ms for the former and TR = 980 ms/TE = 25 ms for the later. All functional data were pre-processed using SPM 12 (https://www.fil.ion.ucl.ac.uk/spm/software/spm12) and DPABI[4]. After obtained the mean and standard deviation of the rs-fMRI time series for both imaging sequences by fslmaths[5], we calculated temporal SNR (tSNR) separately. Then Small-world properties analyses were performed by Gretna[6]. Paired t-tests were performed between graph theory measurements with head motion parameters as covariates.Results
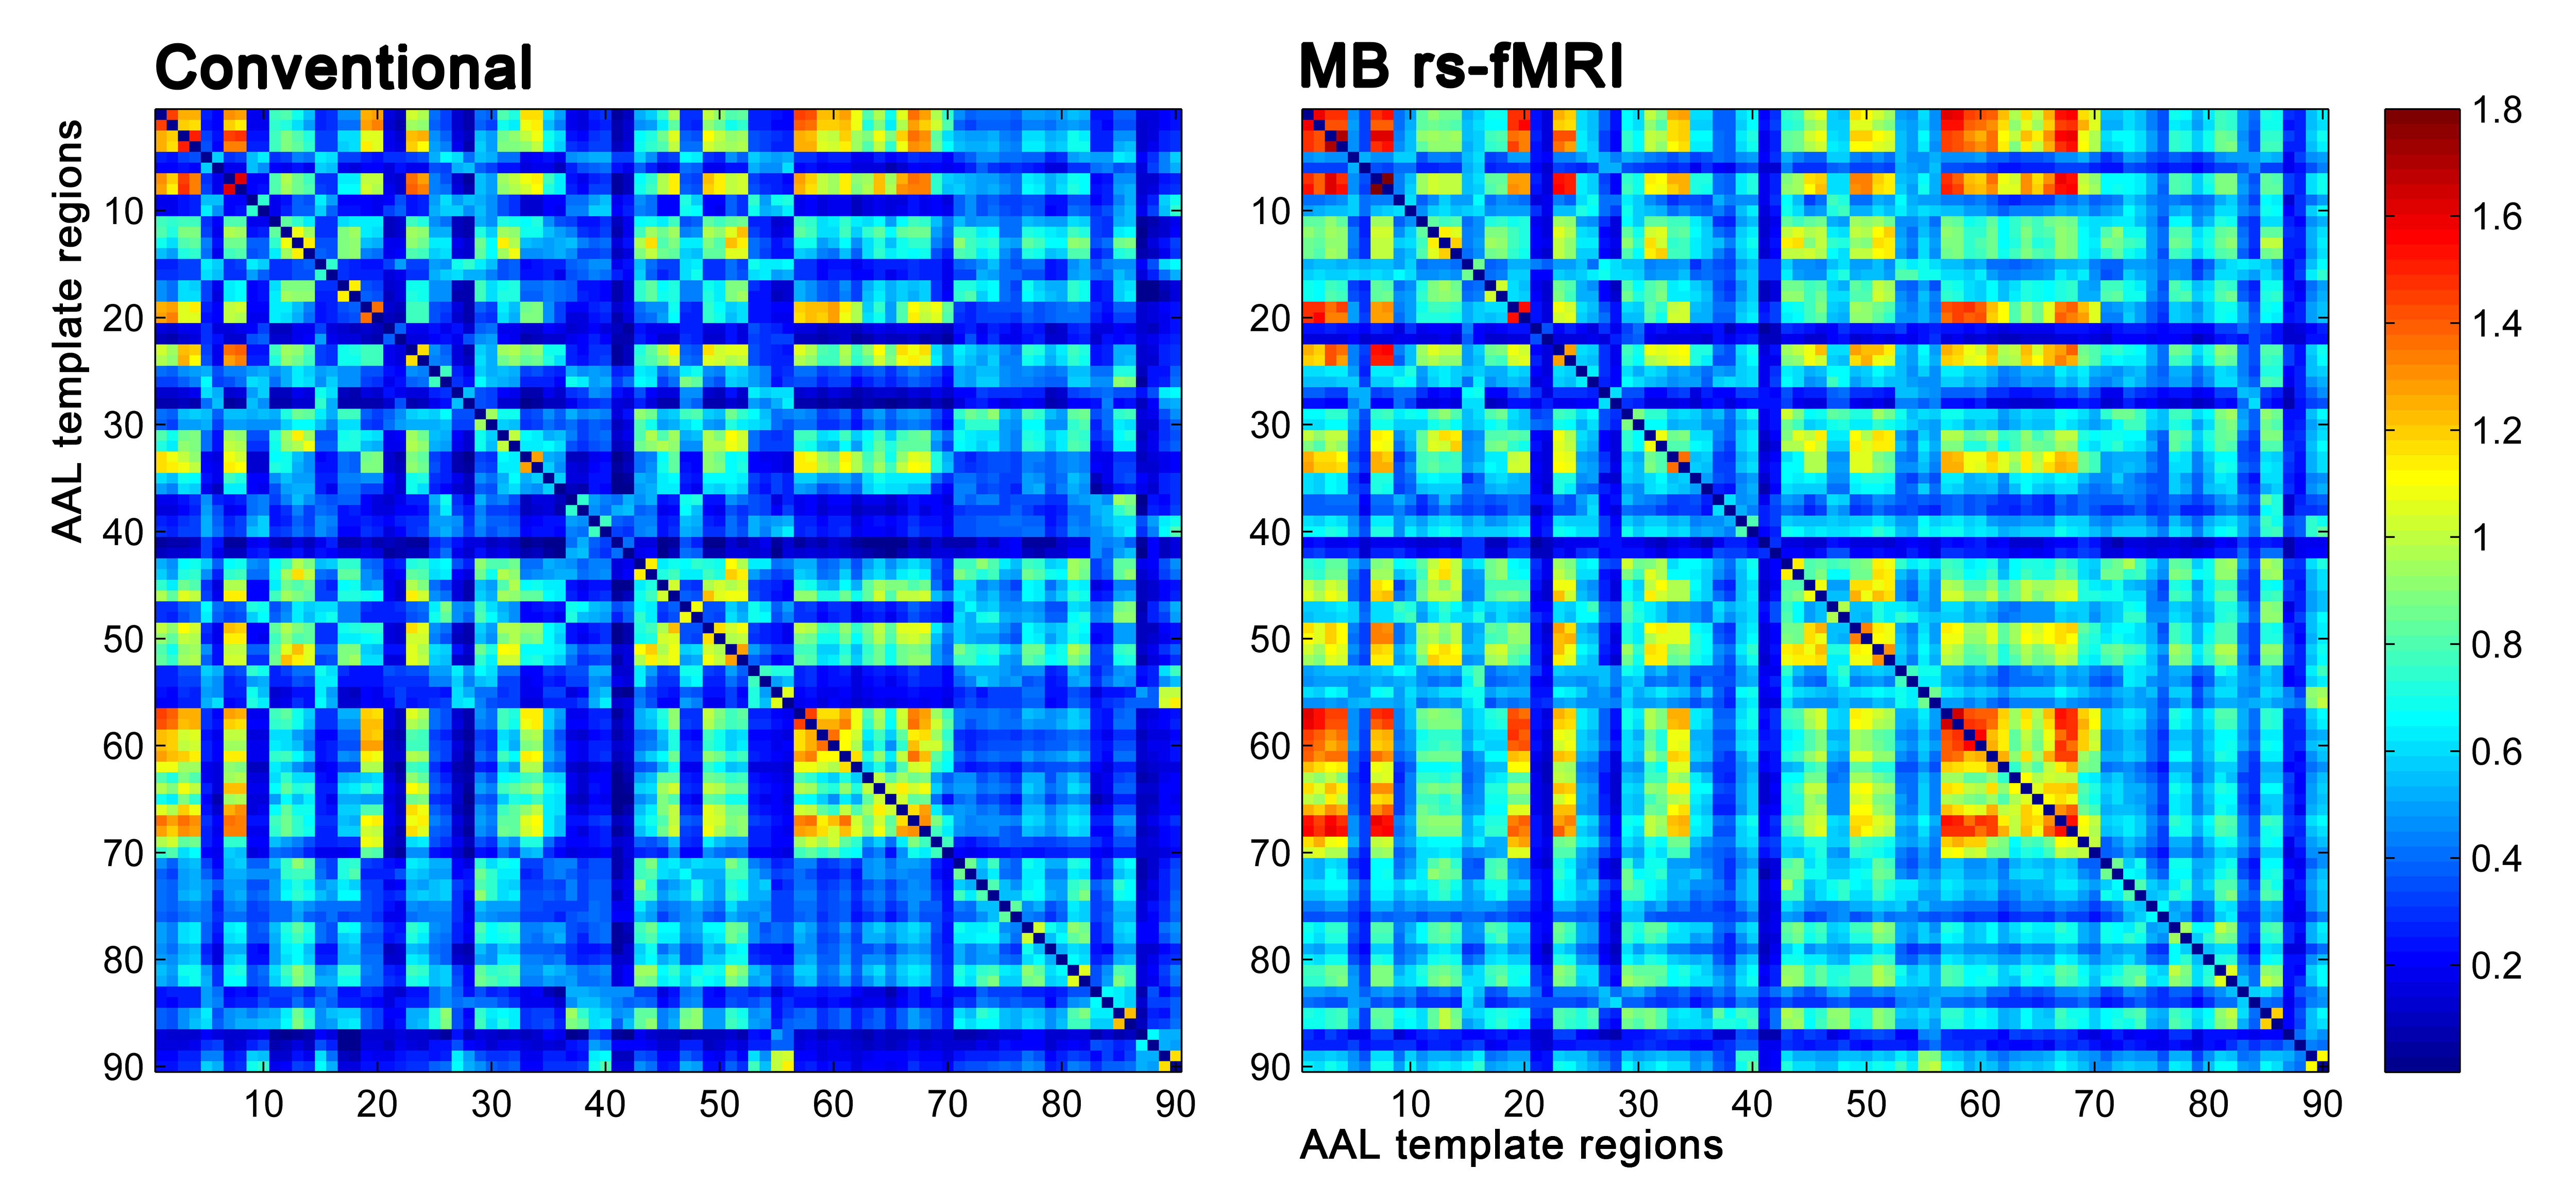
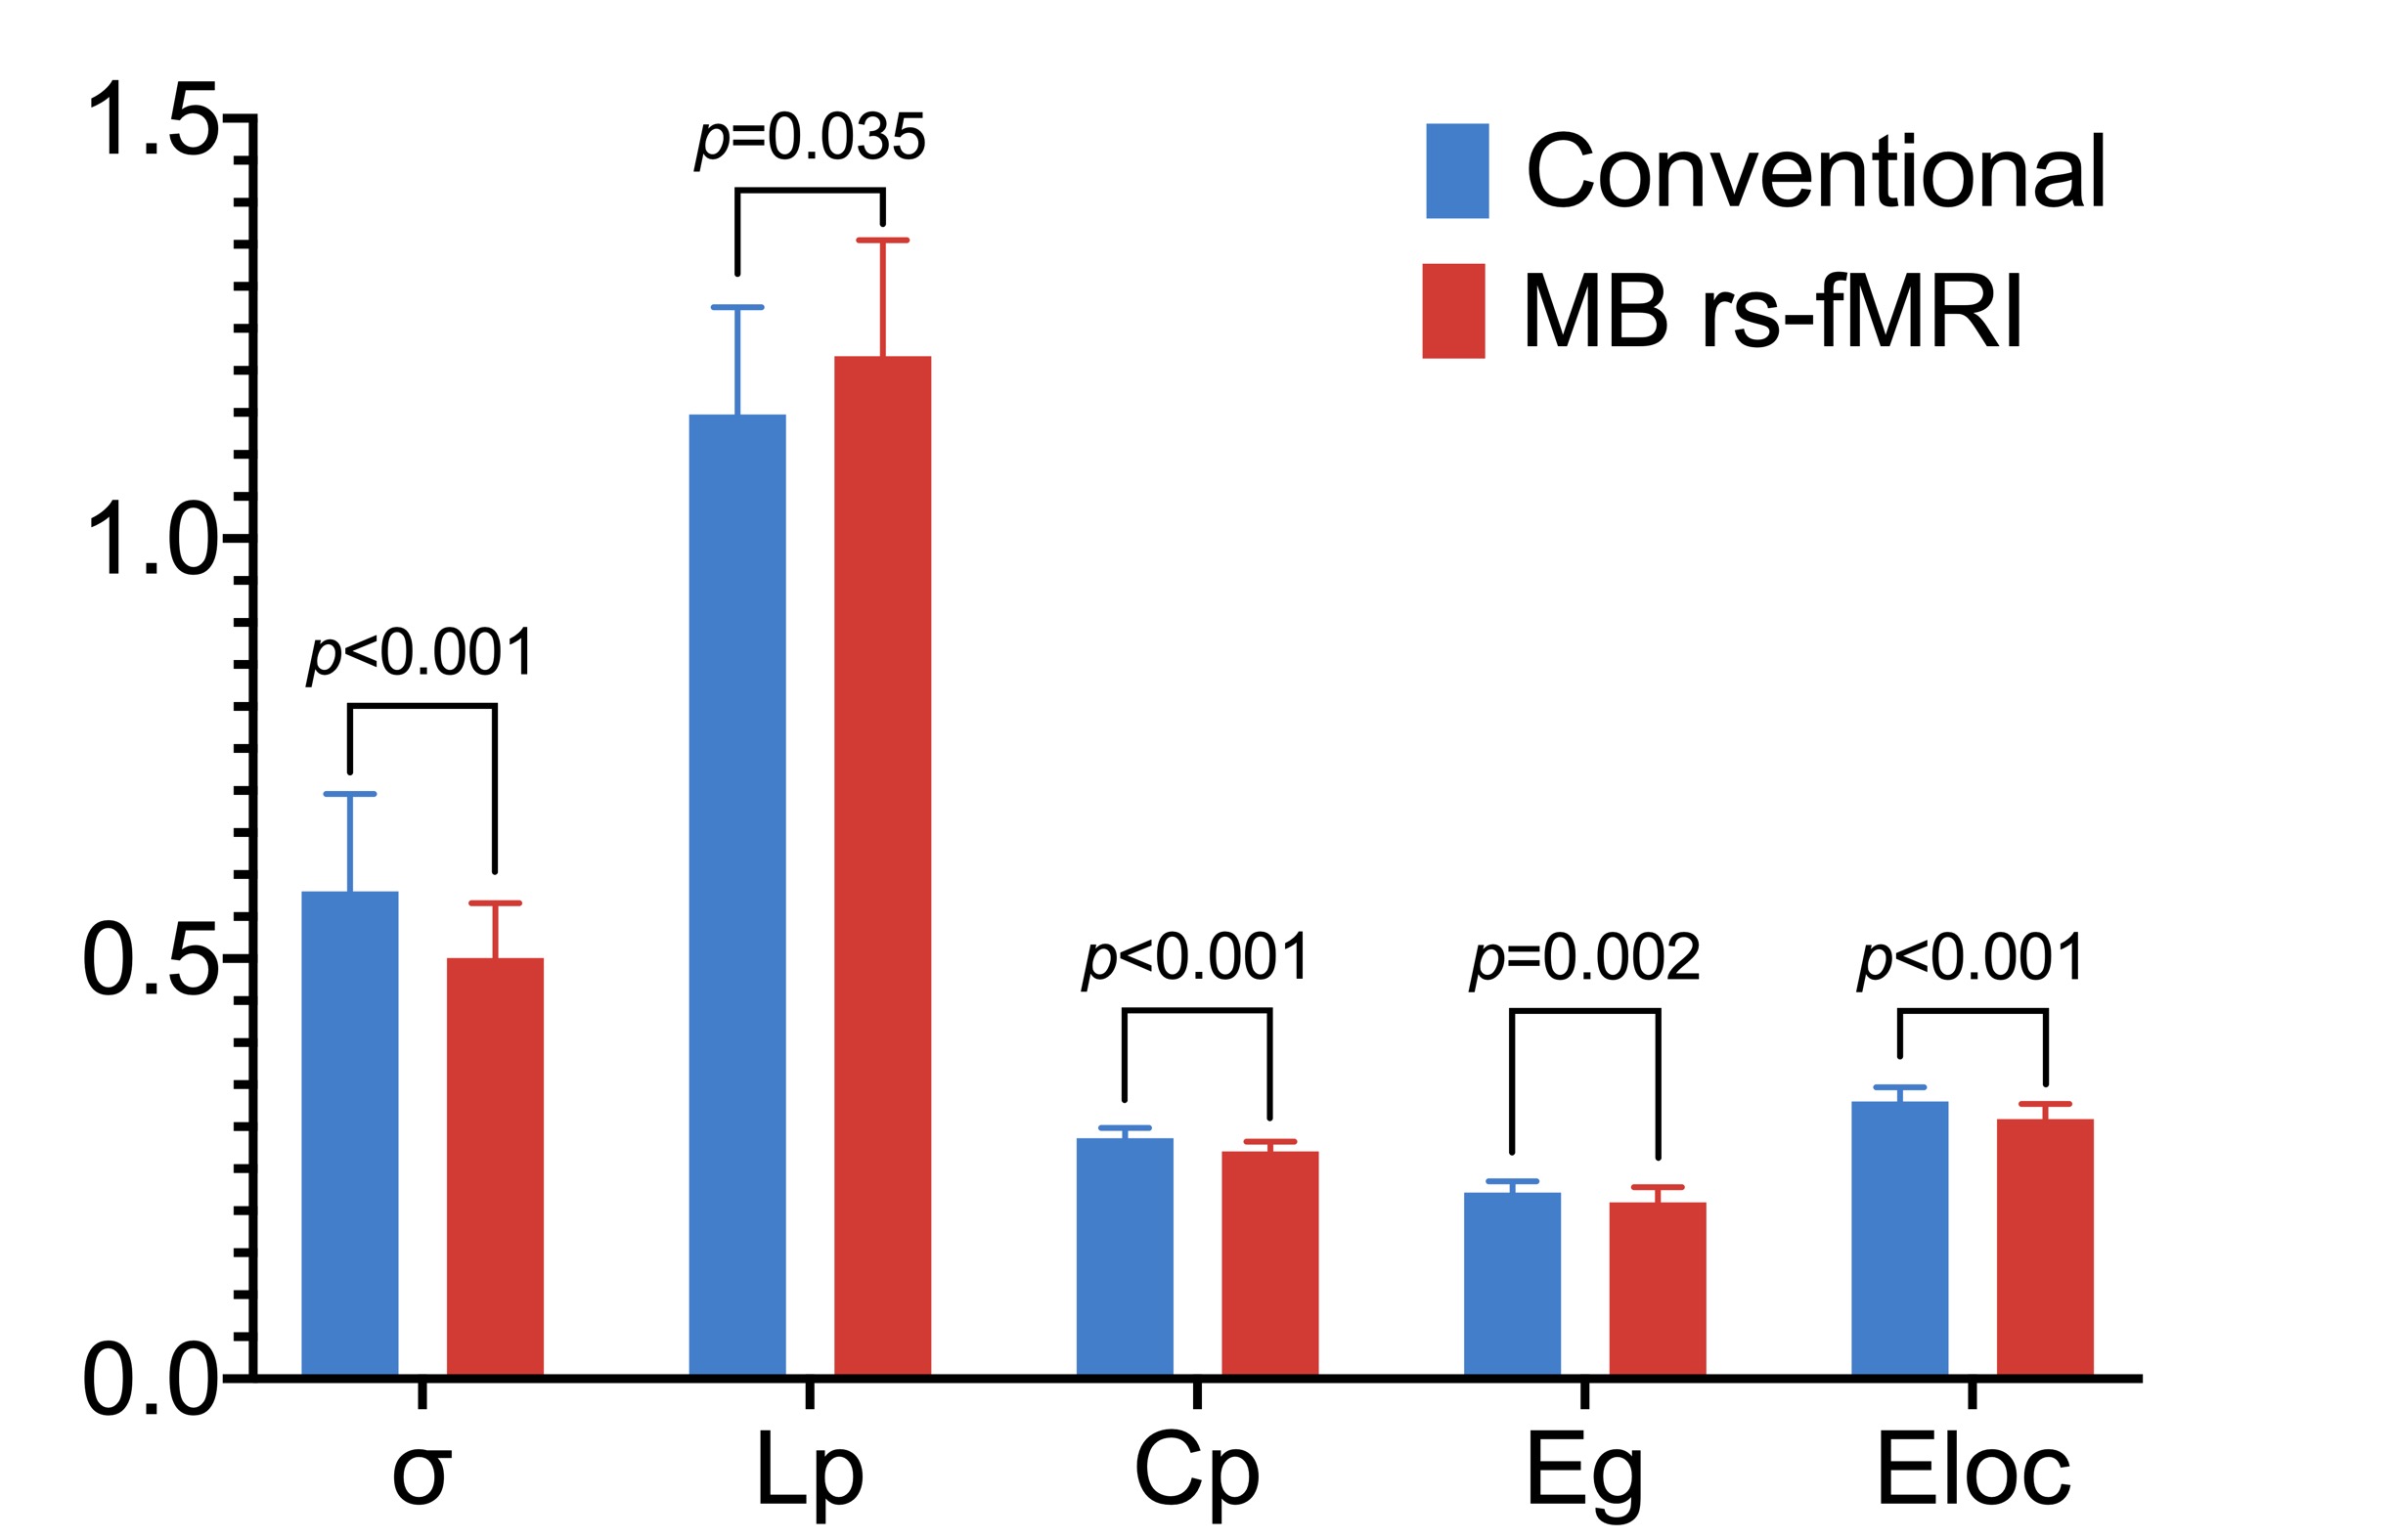
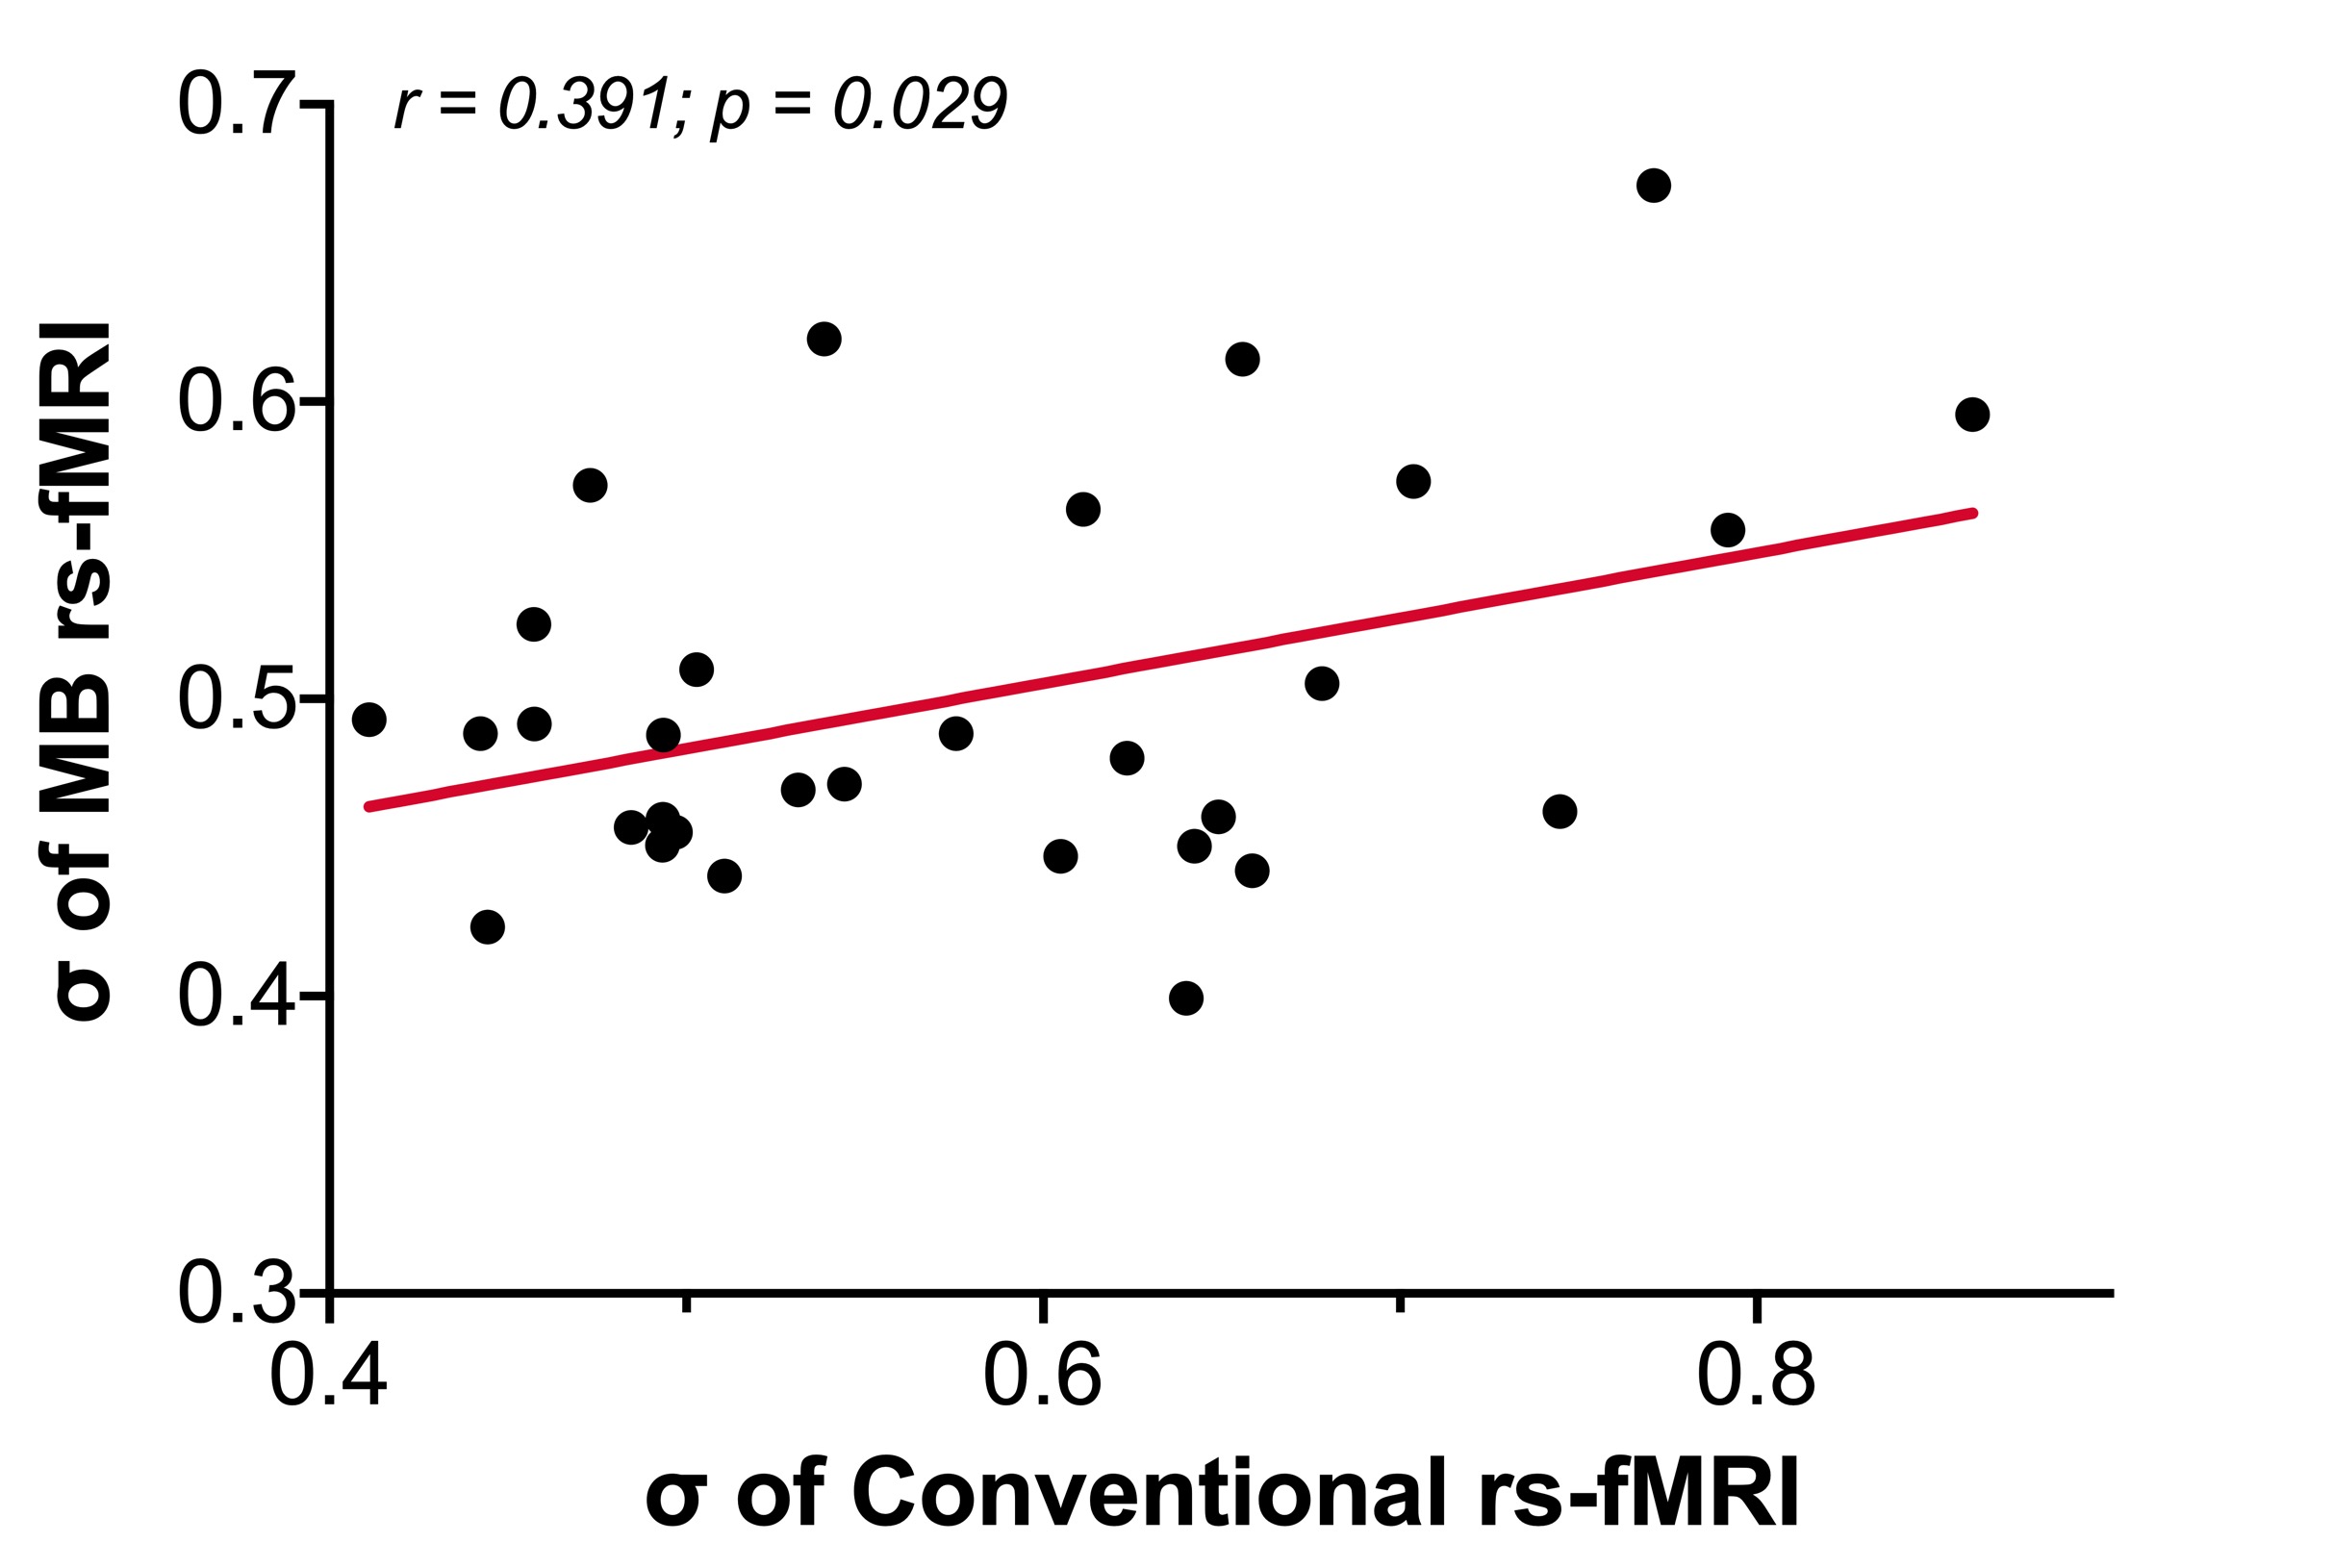
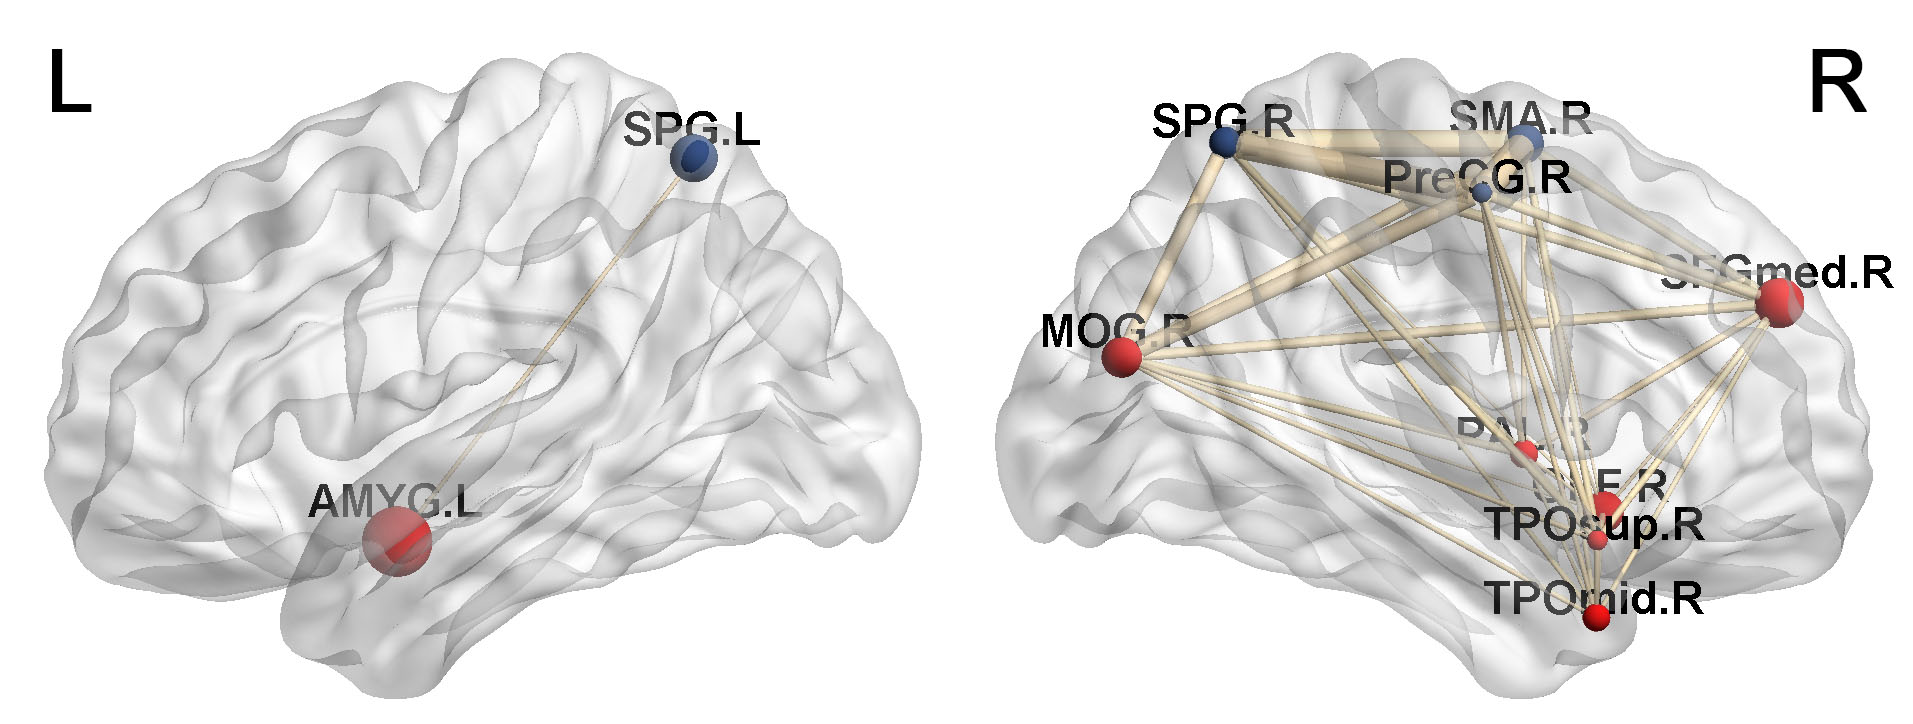
Compared with conventional rs-fMRI, MB rs-fMRI showed higher tSNR and stronger functional connectivity, see Fig 1. Although both groups met the criteria of the small-world organization, MB rs-fMRI had decreased σ, global efficiency (Eg) and local efficiency (Eloc), see Fig 2. Further correlation analysis between the mean graph metrics from the two acquisition sequences yielded a positive relationship (r=0.39, P<0.05), see Fig 3. Nodes with higher efficiency in MB rs-fMRI were also identified, which included the right olfactory cortex, the right superior frontal gyrus, the right middle occipital gyrus and the left amygdala. However, several regions emerged as nodes with low efficiency, which consisted of the right precentral gyrus, the right supplementary motor area and the bilateral superior parietal gyrus (P<0.05, False Discovery Rate corrected), see Fig 4.Discussion
Compared with conventional, MB acquisition enables brain fMRI scans at high speed with high tSNR, providing clinical research and application with the option to increase neuro-activation information without increasing scan time. Although our results showed differences in small world metrics, the positive correlation indicates the validity of MB rs-fMRI in identifying small worldness. Moreover, not only nodes with higher efficiency were found, but also some lower efficient nodes were detected by MB rs-fMRI. We suspect that the differences might mainly result from the superiority of MB rs-fMRI in temporal resolution. On the one hand, subtle fluctuations of BOLD signals can be acquired, and additional temporal information regarding the underlying neuronal processes might be revealed. On the other hand, the effects of undesirable high frequency noises, particularly the respiration signals (~0.3 Hz), might be better reduced via the temporal band-pass filter[7]. Further dynamic functional connectivity studies may better take advantage of MB rs-fMRI and bring more evidence[8]. In future investigations, MB rs-fMRI will be applied in much more subjects and with more comprehensive evaluation parameters to elucidate the physiological mechanism underlying cognitive and perceptual process.Conclusion
As an initial and exploratory study, our results demonstrated that MB rs-fMRI may exhibit much more useful information than conventional rs-fMRI which suggest that this method probably provide complementary information to standard neuroimaging biomarkers.Acknowledgements
This work was supported by the Natural Science Foundation of China (Grant No. 81960309).References
[1] BARTH M, BREUER F, KOOPMANS P J, et al. Simultaneous multislice (SMS) imaging techniques [J]. Magn Reson Med, 2016, 75(1): 63-81.
[2] BHANDARI R, KIRILINA E, CAAN M, et al. Does higher sampling rate (multiband + SENSE) improve group statistics - An example from social neuroscience block design at 3T [J]. Neuroimage, 2020, 213:116731.
[3] SMITHA K A, ARUN K M, RAJESH P G, et al. Multiband fMRI as a plausible, time-saving technique for resting-state data acquisition: Study on functional connectivity mapping using graph theoretical measures [J]. Magn Reson Imaging, 2018, 53:1-6.
[4] YAN C G, WANG X D, ZUO X N, et al. DPABI: Data Processing & Analysis for (Resting-State) Brain Imaging [J]. Neuroinformatics, 2016, 14(3): 339-51.
[5] JENKINSON M, BECKMANN C F, BEHRENS T E, et al. FSL [J]. Neuroimage, 2012, 62(2): 782-90.
[6] WANG J, WANG X, XIA M, et al. Corrigendum: GRETNA: a graph theoretical network analysis toolbox for imaging connectomics [J]. Front Hum Neurosci, 2015, 9:458.
[7] LIAO X H, XIA M R, XU T, et al. Functional brain hubs and their test-retest reliability: a multiband resting-state functional MRI study [J]. Neuroimage, 2013, 83:969-82.
[8] LIAO X, YUAN L, ZHAO T, et al. Spontaneous functional network dynamics and associated structural substrates in the human brain [J]. Front Hum Neurosci, 2015, 9:478.
Figures