3136
Testing for regional anatomical and physiological biases in fMRI signal fluctuations using surface-based deep learning1Massachusetts General Hospital, Harvard Medical School, Charlestown, MA, United States, 2Division of Health Sciences and Technology, Massachusetts Institute of Technology, Cambridge, MA, United States
Synopsis
We provide a proof of concept that surface-based CNNs can predict anatomical and physiological data from fMRI signals. Specifically, we trained CNNs to predict local cortical thickness, cortical orientation to the B0-field and MR angiography data to demonstrate that this information exists in the resting-state timeseries and can be extracted and possibly used for variance and bias reduction. Our results suggest that deep learning is able to identify non-linear relationships between the fMRI data and these anatomical and physiological biases.
Introduction
Human functional MRI (fMRI) aims to infer neuronal activity from haemodynamic signals and map this activity across the brain. However, the measured fMRI signals contain non-neuronal signal biases imposed by the local vasculature, anatomy and other physiology. A prominent anatomical bias are regionally varying partial volume effects that induce fMRI signal differences that covary with cortical thickness changes1,2. Another perhaps surprising bias are cortical orientation effects, under which fMRI fluctuation amplitudes vary by up to 70% between cortical locations that are parallel versus perpendicular to the B0-direction3. Those influences on the fMRI fluctuations are challenging to model directly due to the nonlinear nature of their relationships, precluding straightforward quantification and removal4.Deep learning has been applied to fMRI pattern classification5 and recent applications include relating functional and anatomical patterns over the folded cortex6,7. In this work we apply deep learning to test for the existence and regional variation of anatomical and physiological biases in fMRI data. Specifically, we employ convolutional neural networks (CNNs) and surface-based projections of three anatomical/physiological features—cortical thickness, cortical orientation, and vasculature—to test for their influence on the fMRI temporal features using a publicly available dataset.
Methods
Data: We used the "Midnight Scan Club”8 dataset that comprises 10 subjects, with 10 sessions of 30-minute resting-state fMRI per subject, and additional anatomical data (T1w) and MR angiography (MRA), acquired on a 3T MRI scanner (TIMTrio, Siemens Healthineers,Germany).T1w: standard sagittal MPRAGE (0.8mm isotropic resolution, see8 for details).
MRA: Each subject had 4 sagittal (0.8×0.8×2mm) and 4 coronal (0.7×0.7×2.5mm) 2D-stacked Time-of-Flights without saturation pulses (so arteries and veins are detected, see8 for details).
fMRI: gradient-echo EPI (4×4×4mm,TR=2.2 s,TE=27ms,FA=90°,36 slices).
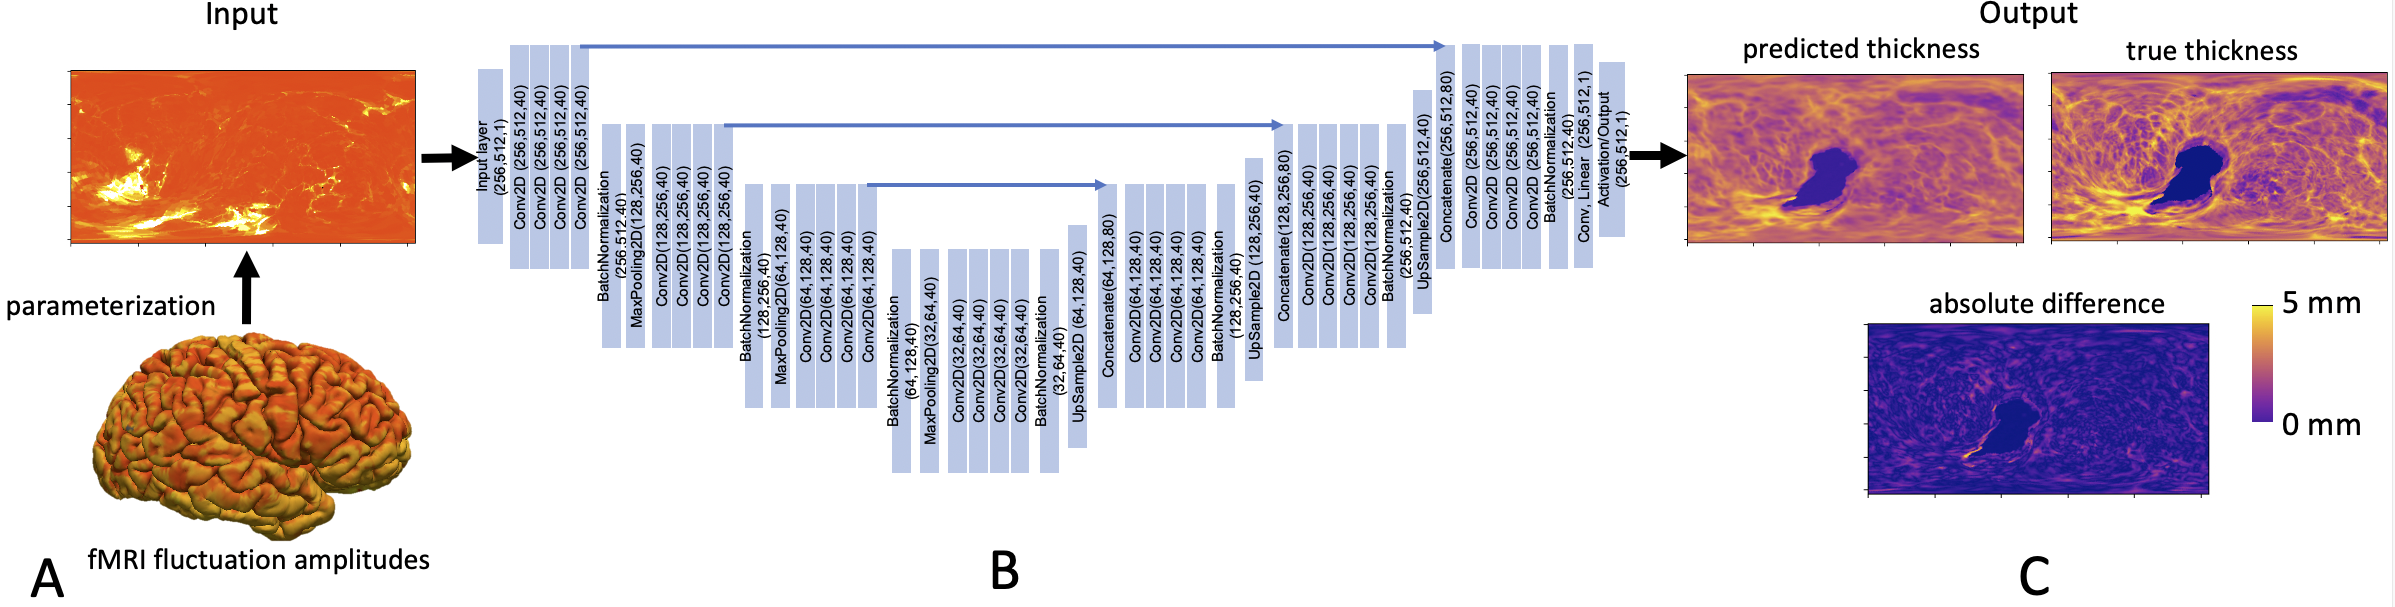
Data processing: We processed the T1w scans with FreeSurfer to reconstruct cortical surfaces and calculate cortical thickness. We rigidly transformed surfaces into the subject's head position during each fMRI scan and calculated surface orientation angles relative to the B0-axis3. We rigidly registered all eight MRAs to the T1w, intensity normalised them by the mean signal from a white matter mask (to remove signal variations across subjects) and projected this data onto the exterior "pial" surface representing the gray/CSF border. Finally, we averaged all MRA projections to generate a single vasculature feature map, referred to as “MRA intensity”, see Fig.2. We distortion9 and motion corrected the fMRI data and applied boundary-based registration to the T1w10. We calculated the coefficient of variation σ/μ, i.e. the timeseries' temporal standard deviation over the mean, as the normalised fMRI fluctuation amplitude. We projected this data onto the surface at the middle cortical depth.
The CNN requires 2D images as in- and outputs, so we mapped all feature surface projections into a spherical coordinate system, i.e. a global 2D parameterization of the surface data11, see Fig.1.
CNN architecture: We employed a U-net-like architecture12 with 3 downsampling levels of 4 convolutional layers each; the convolutional kernel size was 3×3 with 40 features per layer, and a linear final activation, see Fig.1. The network was implemented using the Neurite package13,14, Keras15 and a Tensorflow16 backend.
Training and testing: We trained the network to predict either cortical thickness, orientation or MRA intensity from the fMRI input. For each feature we trained ten times on nine of the ten subjects (circularly hold-one-out). We treated left and right hemispheres as independent maps which yielded 180 datasets for training of which we used 162 as nine runs had poor registrations. We applied the trained networks to a randomly selected run of the held-out subject for testing.
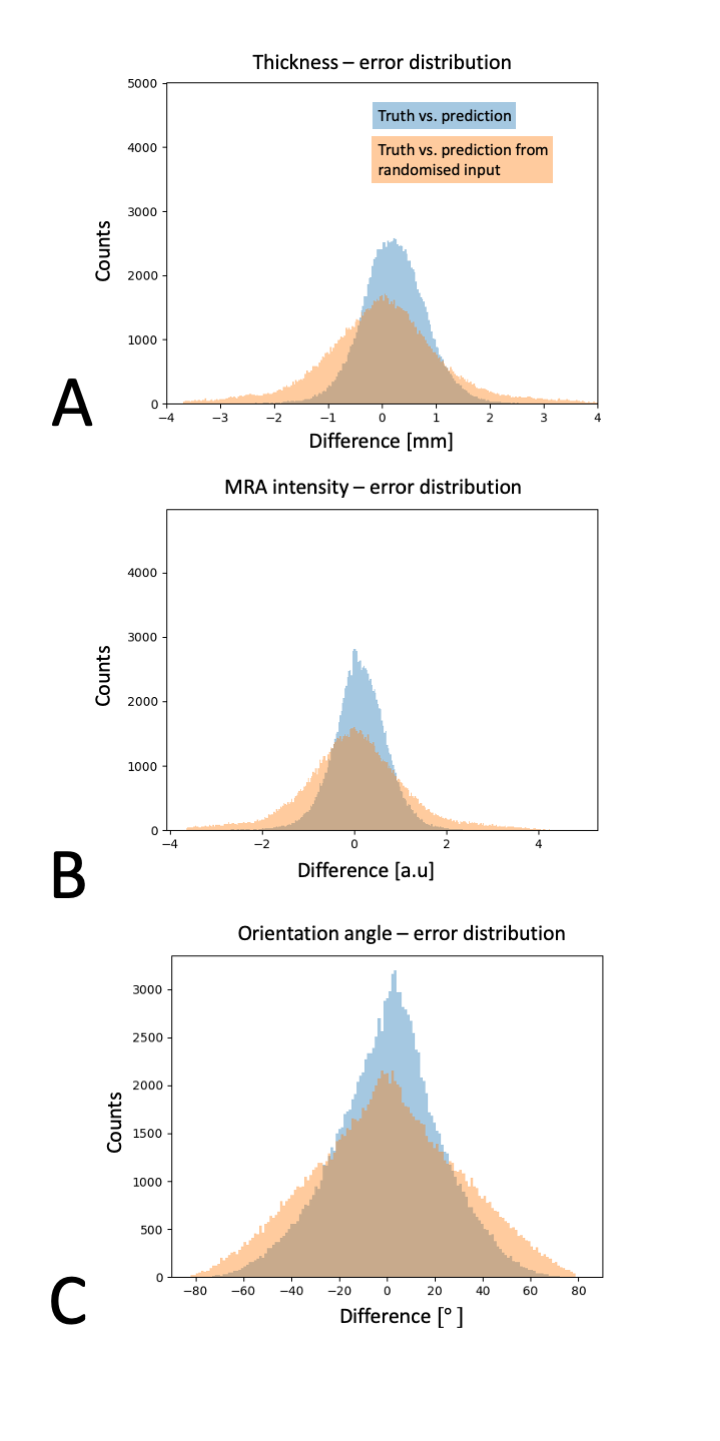
Evaluation: We used resampling statistics to evaluate the predictive power of the fMRI fluctuations for each feature. We compared three absolute errors between: the truth and the prediction; the truth and a prediction from a spatially randomised fMRI input; and the truth and a spatially randomised truth.
Results
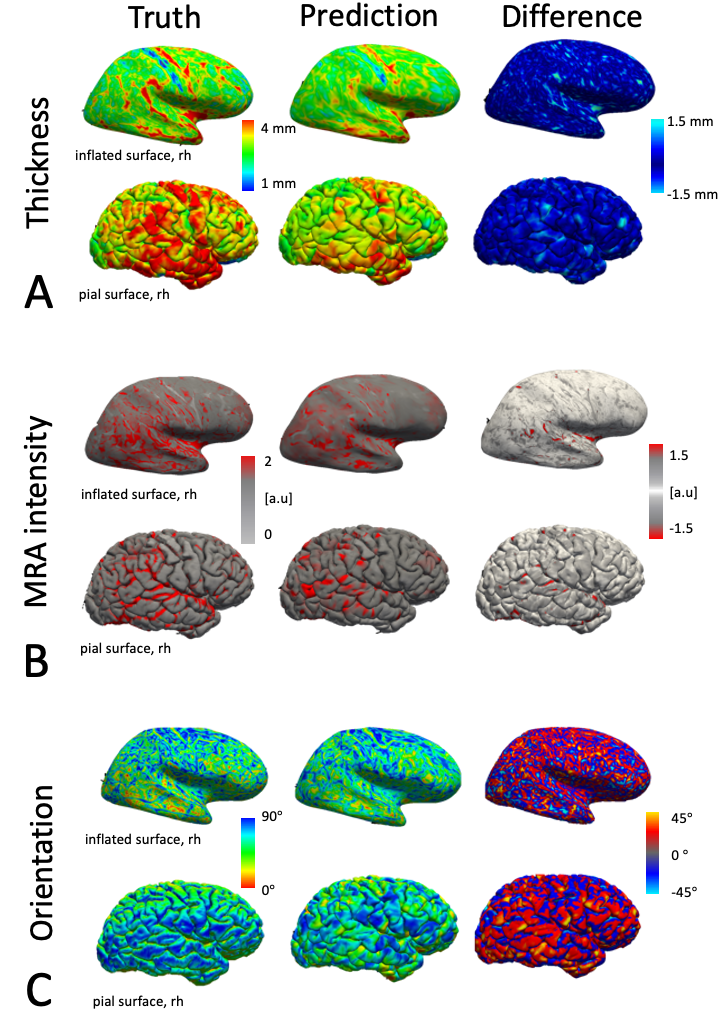
Figure 2 shows a test subject's predictions of cortical thickness, cortical orientation and MRA intensities from the fMRI data. The prediction accuracy was highest for cortical thickness with an absolute error of 0.46±0.02mm (average±std. deviation over all trained networks), compared to the random resampling errors of 0.81±0.03mm and 0.79±0.08mm. MRA intensities had second best prediction accuracy with an error of 0.17±0.02 compared to random resampling errors of 0.26±0.03 and 0.21±0.02. The cortical orientation predictability was lowest with errors of 17.8±0.3° compared to random resampling with 24.3±0.2° and 20.9±0.5°. The networks did not clearly over- or underestimate any feature as seen in the error distributions in Fig.3. All predictions appear smoother than the truth (particularly evident in Fig.1C), perhaps due to the large fMRI voxel size (4×4×4mm) of this dataset. Similarly, the large voxel size may explain the high predictability of cortical thickness due to pronounced partial volume effects.Discussion
The results suggest that deep learning can identify non-linear relationships between fMRI and anatomical and physiological MR data. The proposed framework may serve as a means to map and compare the impact of bias factors on the fMRI signals even when direct modelling is infeasible.Spatial distortion from the surface parameterization to the sphere likely biases training coverage/density. Further the network assumes that in- and output relationships are consistent across the brain, and regional variability may in part reflect functional-anatomical coupling variability.
Acknowledgements
The data for this work was obtained from the OpenNeuro database (accession number ds000224).
We would like to thank Andrew Hoopes for technical support.
This work was supported in part by the NIH NIBIB (grants P41-EB030006 and R01-EB019437), by the BRAIN Initiative (NIH NIMH grant R01-MH111419), and by the MGH/HST Athinoula A. Martinos Center for Biomedical Imaging. Support for this research was provided in part by the BRAINInitiative Cell Census Network grant U01MH117023, the NationalInstitute for Biomedical Imaging and Bioengineering (P41EB015896, 1R01EB023281,R01EB006758, R21EB018907, R01EB019956), the National Institute on Aging (1R56AG064027, 1R01AG064027, 5R01AG008122, R01AG016495), the NationalInstitute of Mental Health, the National Institute of Diabetes andDigestive and Kidney Diseases (1-R21-DK-108277-01), the NationalInstitute for Neurological Disorders and Stroke (R01NS0525851, R21NS072652,R01NS070963, R01NS083534, 5U01NS086625, 5U24NS10059103, R01NS105820),and was made possible by the resources provided by SharedInstrumentation Grants 1S10RR023401, 1S10RR019307, and 1S10RR023043. Additional support was provided by the NIH Blueprint forNeuroscience Research (5U01-MH093765), part of the multi-institutionalHuman Connectome Project. In addition, BF has a financial interest in CorticoMetrics, a company whose medical pursuits focus on brain imaging and measurement technologies. BF's interests were reviewed and are managed by Massachusetts General Hospital and PartnersHealthCare in accordance with their conflict of interest policies.
References
[1] Polimeni et al. Laminar analysis of 7T BOLD using an imposed spatial activation pattern in human V1. Neuroimage 2010. 52(4):1334-1346
[2] Pur et al. Moderating Effect of Cortical Thickness on BOLD Signal Variability Age-Related Changes. Frontiers in Aging Neuroscience, 2019. 11:1-9
[3] Viessmann et al. Dependence of resting-state fMRI fluctuation amplitudes on cerebral cortical orientation relative to the direction of B0 and anatomical axes. NeuroImage 2019. 196:337—350
[4] Gagnon et al. Quantifying the Microvascular Origin of BOLD-fMRI from First Principles with Two-Photon Microscopy and an Oxygen-Sensitive Nanoprobe. Journal of Neuroscience 2015. 35(8):3663—3675
[5] Riaz et al. Deep fMRI: An end-to-end deep network for classification of fMRI data. IEEE 15th International Symposium on Biomedical Imaging, 2018. 1419-1422
[6] Ribeiro et al. Predicting brain function from anatomy using geometric deep learning. BioRxiv preprint June 2020
[7] Zhang et al. Deep Learning Models Unveiled Functional Difference Between Cortical Gyri and Sulci. IEEE Transactions on Biomedical Engineering, 2019. 66(5):1297-1308
[8] Gordon et al. Precision Functional Mapping of Individual Human Brains. Neuron, 2017. 95:791–807
[9] FSL FUGUE. https://fsl.fmrib.ox.ac.uk/fsl/fslwiki/FUGUE
[10] Greve and Fischl. Accurate and robust brain image alignment using boundary-based registration. NeuroImage, 2009. 48(1):63—72
[11] Fischl et al., Cortical Surface-Based Analysis. NeuroImage, 1999. 9:195–207
[12] Ronneberger et al. U-net: Convolutional networks for biomedical image segmentation. In International Conference on Medical Image Computing and Computer-Assisted Intervention, 2015. pages 234–241. Springer
[13] Dalca. Neurite. https://github.com/adalca/neurite
[14] Dalca et al. Anatomical Priors in Convolutional Networks for Unsupervised Biomedical Segmentation. CVPR 2018
[15] Chollet. Keras. https://github.com/fchollet/keras
[16] Abadi et al. Tensorflow: Large-scale machine learning on heterogeneous distributed systems. arXiv preprint arXiv:1603.04467, 2016
Figures