3135
The effect of common resting-state fMRI preprocessing steps on the signal power spectrum1Rotman Research Institute, Baycrest, Toronto, ON, Canada, 2Medical Biophysics, University of Toronto, Toronto, ON, Canada
Synopsis
In resting-state functional MRI (rs-fMRI), the outcome measures, such as the amplitude of low-frequency fluctuation and functional connectivity, depend on the preprocessing steps applied. The mechanisms by which these steps modulate rs-fMRI outcomes are unclear, although it has long been established that the frequency composition of the rs-fMRI signal influences functional connectivity and related measures. In this work, we demonstrate the effect of commonly used preprocessing steps on rs-fMRI spectra, showing the potential interactions between these steps and cardiac/respiratory frequencies.
Introduction
It is increasingly recognized that in resting-state functional MRI (rs-fMRI), the outcome measures, such as the amplitude of low-frequency fluctuation (ALFF) and functional connectivity, depend on the preprocessing steps applied, including slice-timing correction, motion correction, spatial smoothing, and motion regression. 1,2 Specifically, spatial smoothing has been found to reduce the ALFF 1, while motion correction interacts with the efficacy of methods for removing cardiac and respiratory noise 3, and high-pass filtering interacts with motion correction efficacy 4.In practice, preprocessing steps are typically applied without much consideration of ordering or their effect on subsequent physiological denoising. Also, the mechanisms by which these steps modulate rs-fMRI outcomes are unclear. It has long been established that the frequency composition of the rs-fMRI signal influences functional connectivity and related measures 5, and one of the simpler ways to assess the physiological-noise contribution to rs-fMRI metrics is to examine the power spectrum. Thus, in this work, we demonstrate the effect of commonly used preprocessing steps on rs-fMRI spectra. We use ultra-fast acquisitions to permit visualization of cardiac and respiratory frequencies.
Methods
Acquisition: We imaged 13 healthy volunteers (4 male, ages 22-47 years) using a TIM Trio 3T Siemens scanner. All participants were instructed to close their eyes but remain awake. EPI images were acquired using a simultaneous multi-slice gradient-echo (GE) EPI: TR = 380 ms, TE = 30 ms, flip angle = 40°, 3.44 mm × 3.44 mm × 4.6 mm, 1900 time points. In addition, T1-weighted MPRAGE images at 1mm isotropic resolution were acquired for anatomical registration.Preprocessing: This was performed using FSL 5.0 6,7 and AFNI (Version 2011) 8. Steps include: motion correction (FSL) 9, brain extraction (AFNI), spatial smoothing (FWHM=5mm) (AFNI), high-pass filtering (>0.01Hz) (AFNI) and motion regression (AFNI). As slice-timing correction for the simultaneous multi-slice acquisitions is still debated, it was not implemented here.
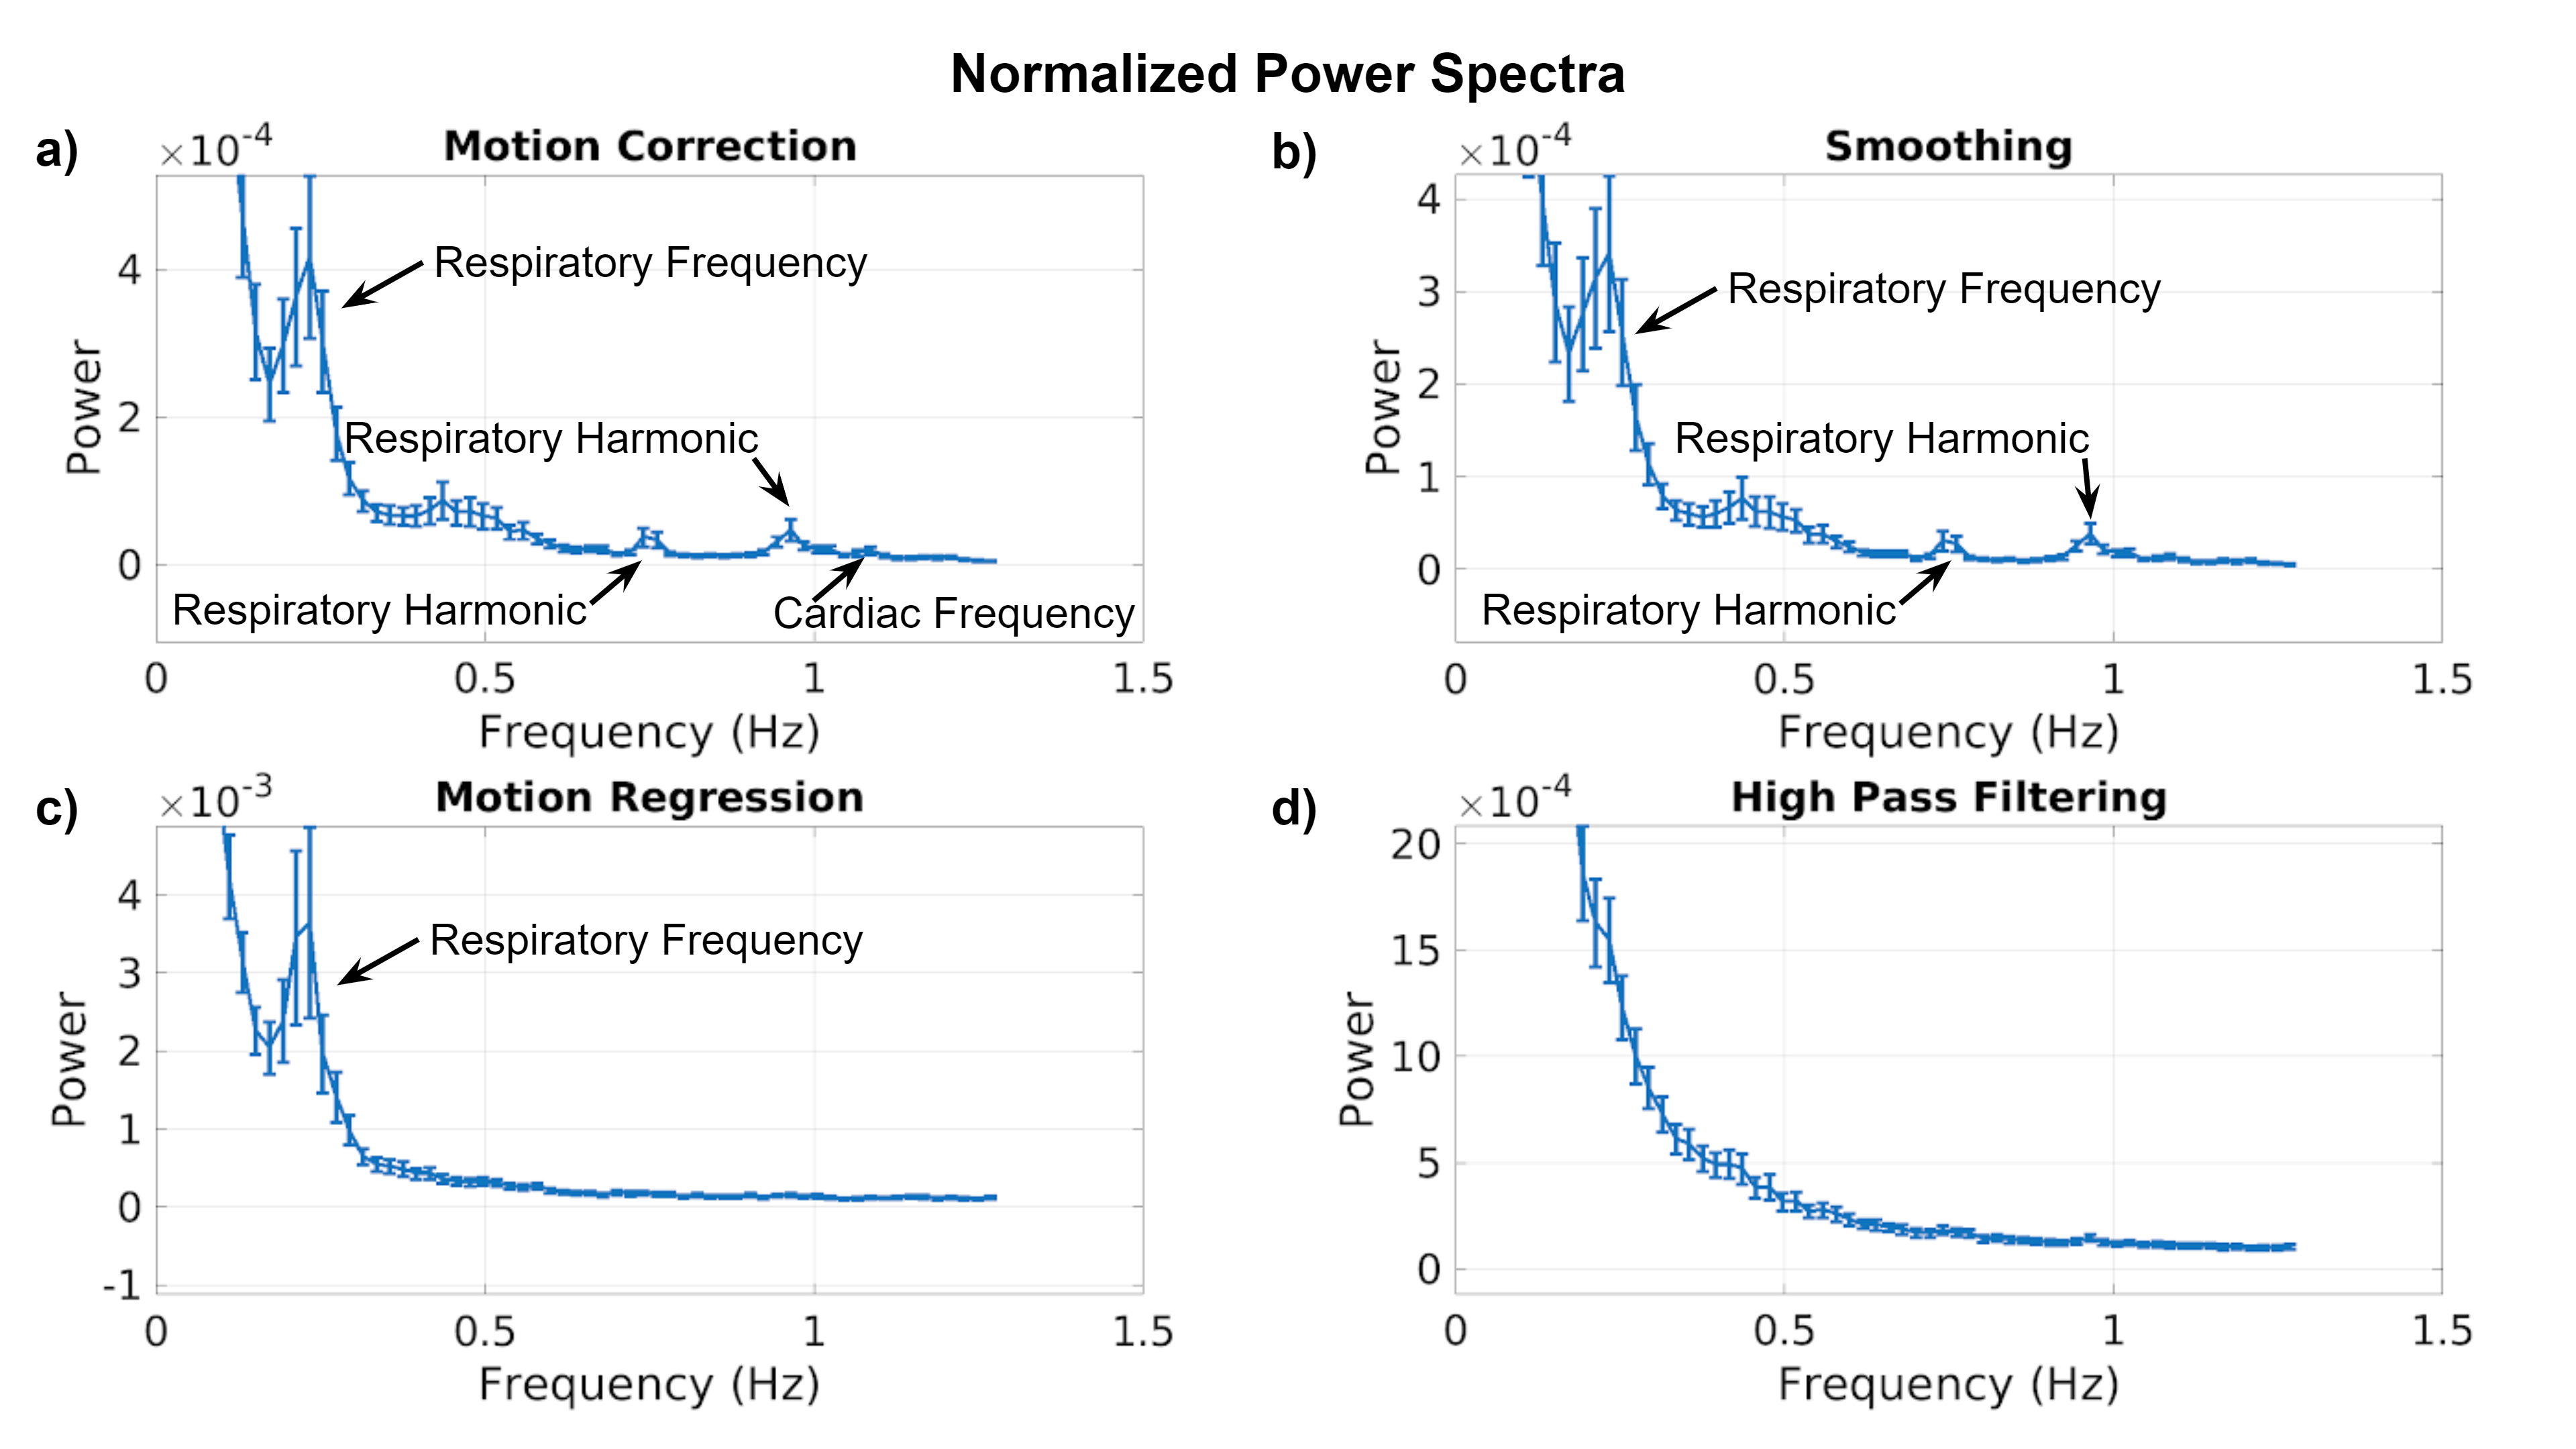
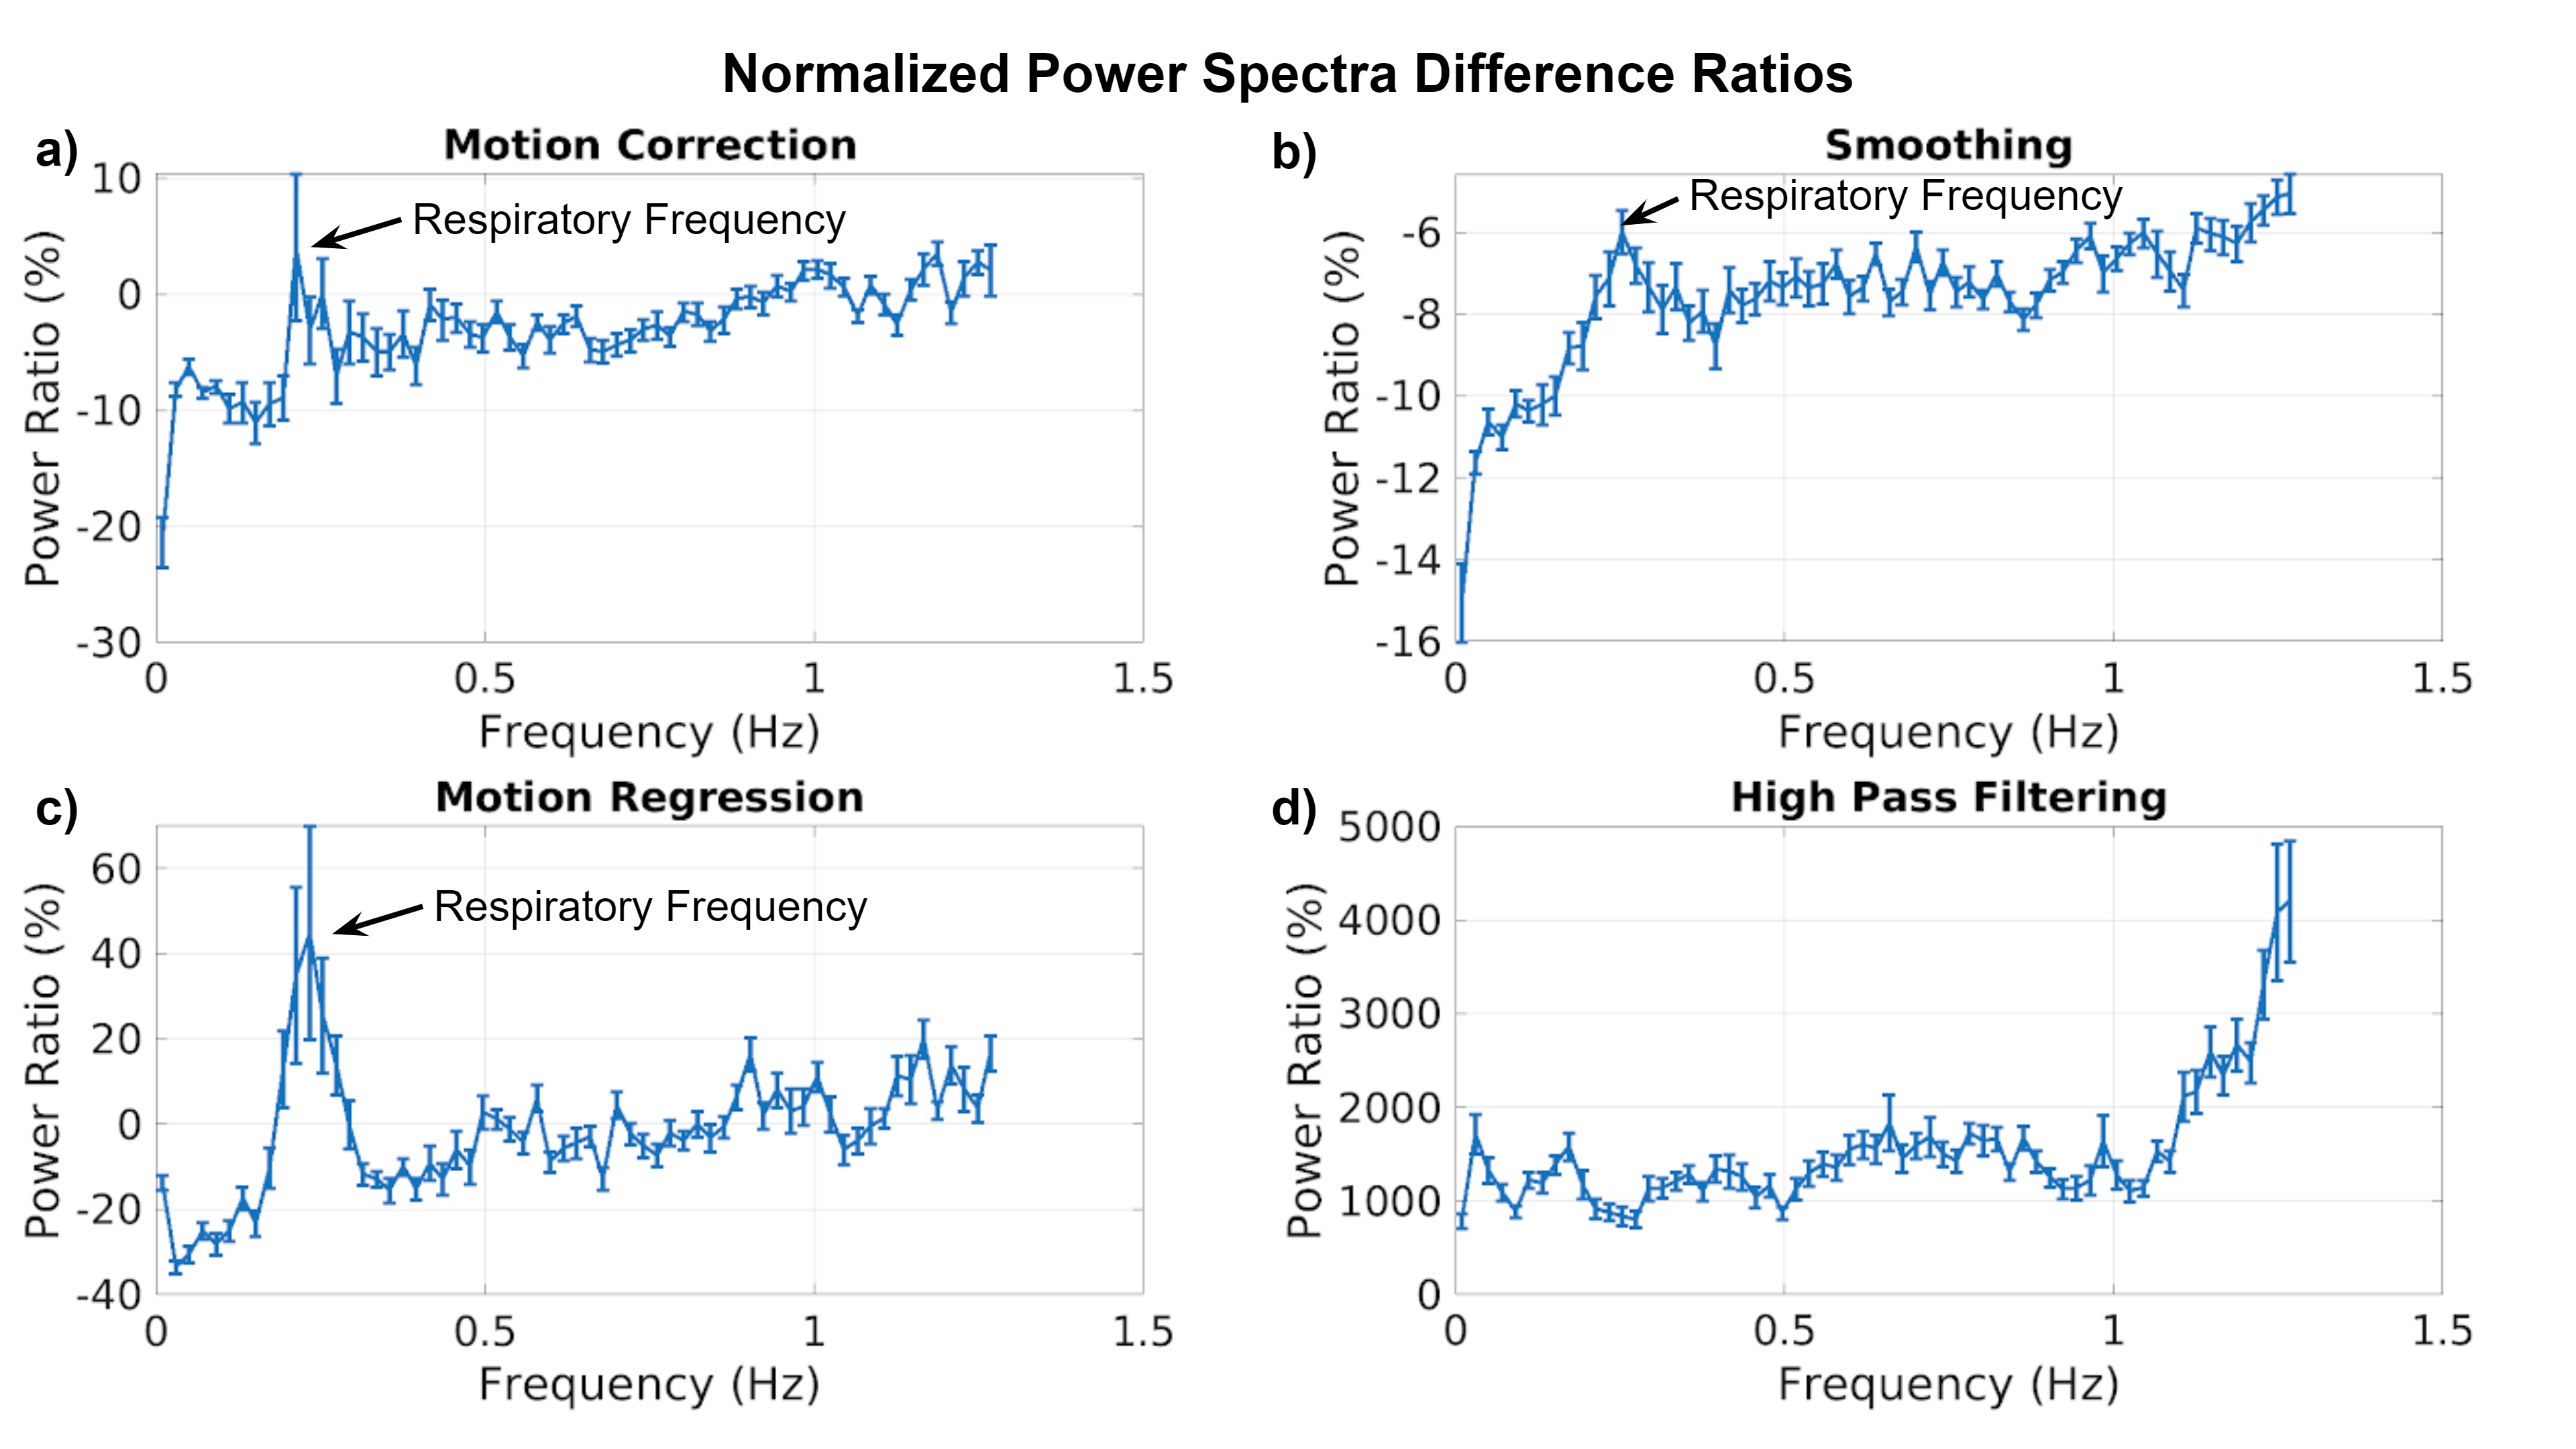
Analysis: At each preprocessing step, the Fourier power spectrum is obtained from the resultant signal averaged across the whole brain (grey matter, white matter and cerebrospinal fluid), normalized by the total power of the raw data prior to preprocessing, and a difference is obtained by subtracting the power spectrum from the preceding step. This difference is divided by the power spectrum produced by the preceding step to obtain difference power ratios.
Results
The group-average Fourier power spectra of the outputs of each of the preprocessing steps are shown in Fig. 1. Correspondingly, the group-average power-spectral difference ratios for individual preprocessing steps are plotted with the standard error shown as error bars. A power difference ratio of >0 implies power has been added by a given step, and vice versa. Motion correction (Fig. 2a) sharply reduces low-frequency signal power (<0.05Hz) and reduces power up to >~1Hz without reducing power around the respiratory frequency (~0.25Hz). Spatial smoothing (Fig. 2b) sharply reduces low-frequency signal power (<0.05 Hz) as well as reducing power at all other frequencies, although notably less around the respiratory frequency (~0.25Hz). Motion regression (Fig. 2c) reduces low-frequency signal power (<0.05Hz) similar to motion correction, but adds power at the respiratory frequency (~0.25Hz). Lastly, high-pass filtering (>0.01Hz) using FSL (Fig. 2d) reduces very-low-frequency signal below the filter cutoff (<0.01Hz), and increases signal power in all other frequencies (>0.01Hz), peaking at the maximum sampled frequency.Discussion
In this work, we demonstrate that common preprocessing steps implemented using FSL and AFNI each have a distinct frequency signature. Due to our high sampling rate, we are able to discern the cardiac and respiratory frequencies, which are reduced by spatial smoothing, and increased by motion correction as well as motion regression These findings illustrate a potential interaction between these steps and physiological-correction methods such as RETROICOR 3. Moreover, motion regression has a different frequency signature than motion correction, with the latter adding signal from the respiratory frequency; the outcome of their combined use is still unclear. Lastly, AFNI’s high-pass filtering does not solely suppress frequencies below the 0.01 Hz cutoff, but appears to evenly add power to all frequencies up to ~1Hz, adding even more power above ~1Hz, peaking at the maximum sampled frequency. It is unclear how these steps alter the phase of physiological signal contributions, but the frequency-specific power changes almost certainly affect functional-connectivity measures. This work is a first step in investigating the interaction between preprocessing steps and the efficacy of various physiological-denoising methods.Acknowledgements
We thank the Canadian Institutes for Health Research (CIHR) and the Natural Sciences and Engineering Research Council of Canada (NSERC) for financial support.References
1. Wu, C. W. et al. Empirical Evaluations of Slice-Timing, Smoothing, and Normalization Effects in Seed-Based, Resting-State Functional Magnetic Resonance Imaging Analyses. Brain Connectivity vol. 1 401–410 (2011).
2. Gargouri, F. et al. The Influence of Preprocessing Steps on Graph Theory Measures Derived from Resting State fMRI. Front. Comput. Neurosci. 12, 8 (2018).
3. Jones, T. B., Bandettini, P. A. & Birn, R. M. Integration of motion correction and physiological noise regression in fMRI. Neuroimage 42, 582–590 (2008).
4. Gratton, C. et al. Removal of high frequency contamination from motion estimates in single-band fMRI saves data without biasing functional connectivity. Neuroimage 217, 116866 (2020).
5. Cordes, D. et al. Frequencies contributing to functional connectivity in the cerebral cortex in ‘resting-state’ data. AJNR Am. J. Neuroradiol. 22, 1326–1333 (2001).
6. Jenkinson, M., Beckmann, C. F., Behrens, T. E. J., Woolrich, M. W. & Smith, S. M. FSL. Neuroimage 62, 782–790 (2012).
7. Smith, S. M. et al. Advances in functional and structural MR image analysis and implementation as FSL. Neuroimage 23 Suppl 1, S208–19 (2004).
8. Cox, R. W. AFNI: software for analysis and visualization of functional magnetic resonance neuroimages. Comput. Biomed. Res. 29, 162–173 (1996).
9. Jenkinson, M., Bannister, P., Brady, M. & Smith, S. Improved optimization for the robust and accurate linear registration and motion correction of brain images. Neuroimage 17, 825–841 (2002).
Figures