3133
Reproducibility Test of Global Functional Connectivity1Radiology, Cleveland Clinic, Cleveland, OH, United States
Synopsis
We evaluated the reproducibility of resting
state global functional connectivity in scan to re-scan.
INTRODUCTION
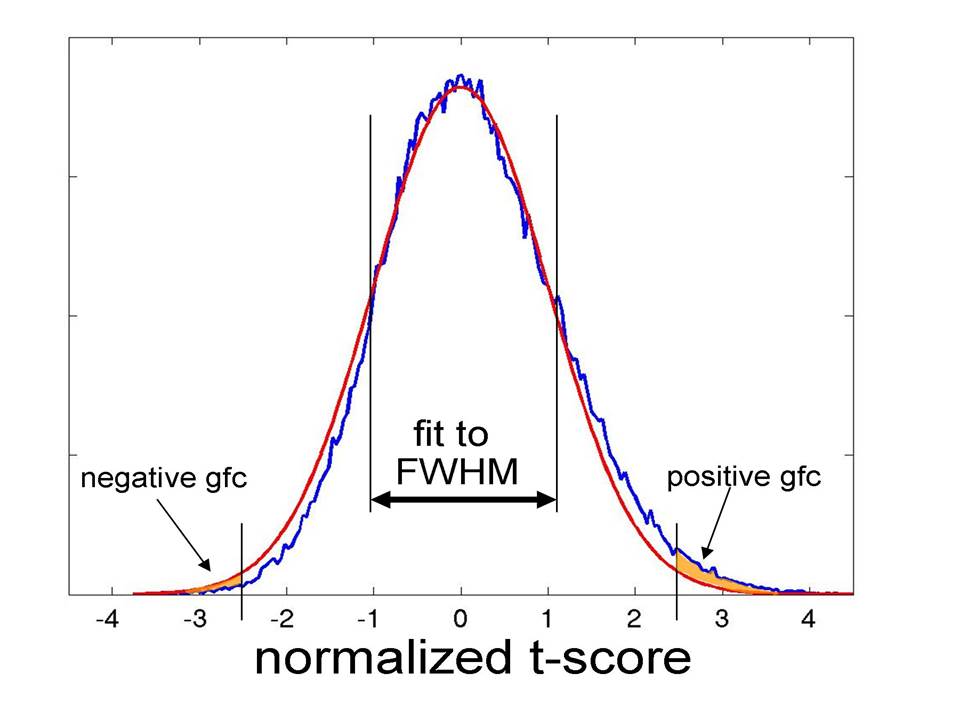
Resting state fMRI (rsfMRI) is a widely used method in functional neuroimaging to measure the state of brain network connectivity. There are several common methods used, including seed-based connectivity, network analysis methods such as graph theory, and data-driven methods such as Independent Components Analysis. Global connectivity is a concept that was introduced several years ago to assess the functional connectivity of a local brain region to the rest of the brain1-4. We have previously introduced a simple global connectivity metric4 (see Figure1). Here we present a study of the reproducibility of this metric across brain regions in the mesial temporal lobe and the frontal lobe. These regions are commonly indicated in medically intractable epilepsy and have intrinsic interest with regard to their global functional inter-connectedness.METHODS
Data Collection:Nine healthy controls were scanned under an IRB-approved protocol on a 3 T scanner (Siemens Healthineers, Erlangen Germany). For each subject, anatomical T1W images were acquired (3D MPRAGE) and , two eye closed rs-fMRI scans using 2D GRE EPI (FOV=256x256 mm2, 4mm thickness, 31 slices, voxel size=2x2mm², TE/TR=29ms/2.8s, 137 volumes). A bite-bar was used for all scans to reduce head motion artifact.
Data processing:
Physiologic noise was removed using PESTICA5, and slicewise head motion and its residual artifact were removed using SLOMOCO6. EPI data were spatially filtered to 4mm FWHM using a Hamming filter7. Whole brain gfc map were calculated4:
1) lowpass temporal filtering (<0.1Hz)
2) Pearson cross-correlation to every other voxel in brain tissue. Cross-correlation is converted to a Student's t8
3) Gaussian fit to full-width at half-maximum of frequency distribution of Student's t
4) Difference in area between the fit distribution and the observed distribution above a threshold (t>2.5) is taken to be GFC for that voxel. (see Figure1)
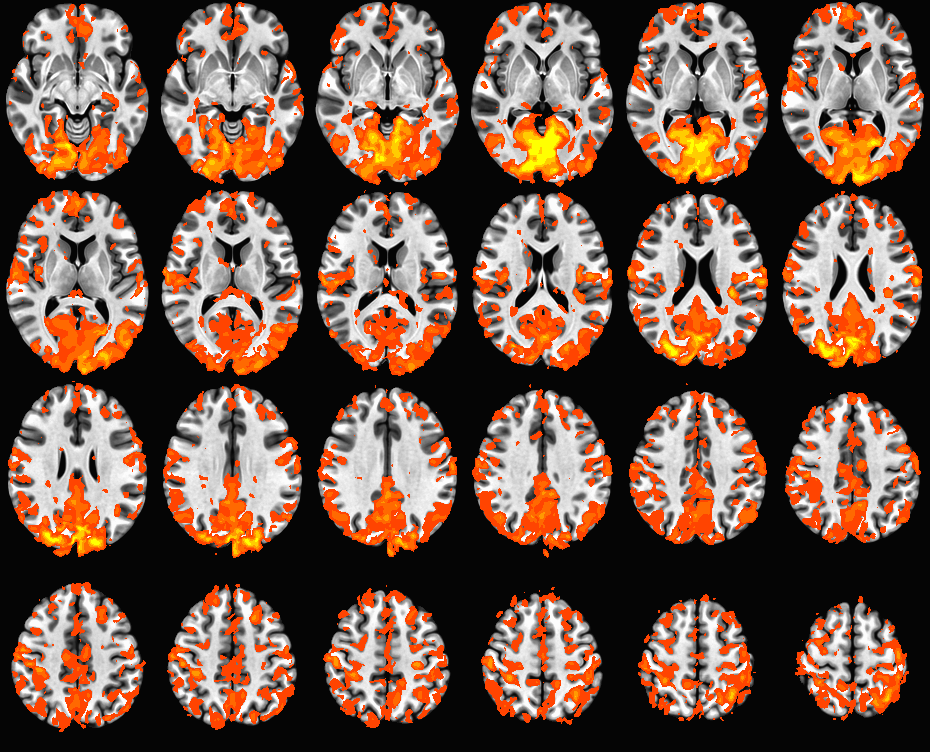
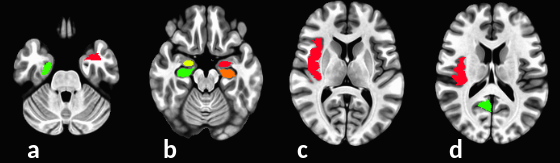
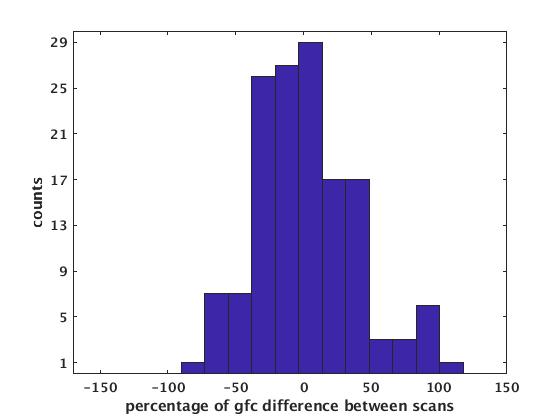
All scan and rescan gfc maps were aligned to MNI space using linear/nonlinear image co-registration method ANTs9. Sixteen ROI’s across the mesial and frontal lobes were drawn in MNI space. Figure2 shows examples of ROIs in MNI space. 16 ROIs were assigned to each of 9 subjects to define same regions of interest on them. For each subject, gfc mean values were calculated from each ROI on scan and rescan respectively. To present variation of gfc between two scans, the percentage of gfc difference, divided by mean (=200x(scan-rescan)/(scan+rescan)) was calculated for all ROIs of all subjects, Histogram of percentage of gfc difference between scan and rescan for all ROIs was also calculated.
We also use the Intra-class correlation coefficient (ICC), a classic statistic that is typically used to assess the reliability of intra-subject measures. We produce the ICC across subjects for the gfc measures between scan and re-scan10 ,
$$ICC = \frac{\sigma_{ROIs X subjects}^2}{\sigma_{ROIs X subjects}^2 + \sigma_{scantoscan}^2} $$
, indicating the ratio of the variation of 144 (=16 ROIs x 9 subjects) gfc values to total variation including scan to scan variation. ICC is scaled from 0 (no reliability) to 1 (high reliability).
RESULTS
Figure 2 shows an example of gfc map in MNI space. Figure 3 shows examples of defined ROIs. Figure 4 shows the histogram of percentage of gfc difference between scan and rescan across all ROIs. This distribution shows that 70% of measurements have less than a 40% variation in GFC in repeat measurements. In addition, across the group, the ICC value was calculated to be 0.64 between scan and rescans. Although this indicates that GFC scan to scan reproducibility has moderately high reliability (0.5 < ICC < 0.75)11, this compares well to prior studies of scan-rescan reproducibility measures in rsfMRI12.DISCUSSION and conclusion
We previously presented a simple measure of global functional connectivity that can be used to assess the functional connectivity of local regions to the entire brain. The metric shows promise as a measure of abnormal connectivity relevant to, for example, identification of epileptogenic foci (see abstract by this group), as well as other conditions that have been shown to affect whole brain connectivity such as depression13 and concussion14. In this study, we show that a local metric of global connectivity has a robustness that is reasonable within the context of rsfMRI studies. Future work will incorporate a more comprehensive assessment of regional brain gfc, extending the current work to the entire brain.Acknowledgements
This work was supported by National Multiple Sclerosis Society grant RG4931A1/1References
1. Cole MW, Pathak S, Schneider W. Identifying the brain's most globally connected regions. NeuroImage. 2010;49(4):3132-48. Epub 2009/11/17. doi:10.1016/j.neuroimage.2009.11.001. PubMed PMID: 19909818.
2. Scheinost, D et al, NeuroImage 62 (2012) 1510-1519.
3. Martuzzi R, Ramani R, Qiu M, Shen X, Papademetris X, Constable RT. A whole-brain voxel based measure of intrinsic connectivity contrast reveals localchanges in tissue connectivity with anesthetic without a priori assumptions on thresholds or regions of interest. NeuroImage. 2011;58(4):1044-50. Epub2011/07/19. doi: 10.1016/j.neuroimage.2011.06.075. PubMed PMID: 21763437; PMCID: PMC3183817.
4. Beall E, Lowe MJ, Li M. A new model-based intrinsic connectivity measure: global functional connectivity. Proc 23rd ISMRM. 2014; #3046.
5. Beall EB, Lowe MJ. Isolating physiologic noise sources with independently determined spatial measures. Neuroimage. 2007 Oct 1;37(4):1286-300. Epub 2007 Jul 13.
6. Beall EB, Lowe MJ. SimPACE: generating simulated motion corrupted BOLD data with synthetic-navigated acquisition for the development and evaluation of SLOMOCO: a new, highly effective slicewise motion correction. Neuroimage. 2014 Nov 1;101:21-34. doi: 10.1016/j.neuroimage.2014.06.038. Epub 2014 Jun 24.
7. Lowe MJ, Sorenson JA. Spatially filtering functional magnetic resonance imaging data. Magn Res Med. 1997;37(5):723-9.
8. Press W, Flannery BP, Teukolsky SA, Vetterling WT. Numerical Recipes: The Art of Scientic Computing. First ed. Cambridge: Cambridge UniversityPress; 1986.
9. Avants BB, Tustison NJ, Song G, Cook PA, Klein A, Gee JC. A reproducible evaluation of ANTs similarity metric performance in brain image registration. Neuroimage. 2011 Feb 1;54(3):2033-44. doi: 10.1016/j.neuroimage.2010.09.025.
10. McGraw KO, Wong SP. Forming inferences about some intraclass correlation coefficients. Psychol Methods. 1996;1:30–46.
11. Koo TK, Li MY. A Guideline of Selecting and Reporting Intraclass Correlation Coefficients for Reliability Research [published correction appears in J Chiropr Med. 2017 Dec;16(4):346]. J Chiropr Med. 2016;15(2):155-163. doi:10.1016/j.jcm.2016.02.012
12. Noble S, Scheinost D, Finn ES, Shen X, Papademetris X, McEwen SC, Bearden CE, Addington J, Goodyear B, Cadenhead KS, Mirzakhanian H, Cornblatt BA, Olvet DM, Mathalon DH, McGlashan TH, Perkins DO, Belger A, Seidman LJ, Thermenos H, Tsuang MT, van Erp TGM, Walker EF, Hamann S, Woods SW, Cannon TD, Constable RT. Multisite reliability of MR-based functional connectivity. Neuroimage. 2017;146:959-70. Epub 2016/11/05. doi: 10.1016/j.neuroimage.2016.10.020. PubMed PMID: 27746386; PMCID: PMC5322153
13. Schultz DH, Ito T, Solomyak LI, Chen RH, Mill RD, Anticevic A, Cole MW. Global connectivity of the fronto-parietal cognitive control network is related to depression symptoms in the general population. Network neuroscience (Cambridge, Mass). 2019;3(1):107-23. Epub 2019/02/23. doi: 10.1162/netn_a_00056. PubMed PMID: 30793076; PMCID: PMC6326740.
14. Kaushal M, España LY, Nencka AS, Wang Y, Nelson LD, McCrea MA, Meier TB. Resting-state functional connectivity after concussion is associated with clinical recovery. Hum Brain Mapp. 2019;40(4):1211-20. Epub 2018/11/20. doi: 10.1002/hbm.24440. PubMed PMID: 30451340; PMCID: PMC6365215.
Figures