3132
Cerebellum integration in motor network improves Dynamic Causal Modeling performance1Department of Brain and Behavioral Sciences, University of Pavia, Pavia, Italy, 2Azienda Socio Sanitaria Territoriale (ASST) di Pavia, Pavia, Italy, 3Department of Diagnostic Radiology, College of Applied medical sciences, King Abdulaziz University, Jeddah, Saudi Arabia, 4NMR Research Unit, Queen Square MS Centre, Department of Neuroinflammation, UCL Queen Square Institute of Neurology, Faculty of Brain Sciences, University College London (UCL), London, United Kingdom, 5Brain Connectivity Centre Research Department, IRCCS Mondino Foundation, Pavia, Italy
Synopsis
Dynamic Causal Modelling (DCM) is a framework enabling to quantify the causal relationship between functionally connected regions of the brain. Here we investigate cerebellum role in motion generation by adding a cerebellar node to an already validated motor network. We assessed how this operation improved DCM fMRI prediction. First- and second-level analyses were performed and the network including the cerebellum predicted the observed data with higher efficiency at single subject and group level. This network is important to study people with motor impairment where one could compare DCM predictions in heathy subjects and patients.
Introduction
Dynamic Causal Modeling (DCM) is a framework that enables to establish causal relationships between interconnected regions1. Thus, it is widely used in functional MRI (fMRI) clinical and research studies. DCM relies on bayesian inference that estimates the connectivity parameters combining priors with observed fMRI data2–4. It allows to evaluate the “effective connectivity” between brain regions, which corresponds to quantifying the effect of one brain region onto another, establishing directed causal influences between the same. This framework has already been used to investigate how cerebral motor connectivity is modulated by grip force during an event-related fMRI visuo-motor task2,5. The network that better explained the functional hierarchy of involved brain included Primary Motor Cortex(M1), Pre-Motor Cortex(PMC) and Supplementary Motor Area(SMA) with the squeezing-ball task execution driving the input into M1 and SMA, with force being the modulatory input. It is known that the cerebellum is structurally connected with the contralateral cerebral motor cortex, thus, we expand the previous validated network2,5 by adding a node in the cerebellar motor area. Here, we aim at investigating the cerebro-cerebellar motor cortex effective connectivity and whether the inclusion of a cerebellar node in the motor loop improves DCM prediction6,7.Methods
Subjects: 5 right-handed healthy volunteers were included (mean age±SD=25±1.4; 3/5 males).MRI protocol: A 3 T Philips Achieva MR scanner (Philips Healthcare, Best, The Netherlands) with a 32-channel head coil was used to perform a 3DT1 anatomical scan (Inversion prepared gradient-echo sequence with TR/TE/TI=6.9/3.1/824 ms, flip angle=8°,1mm3 isotropic resolution) and 3 T2*-weighted EPI fMRI series (TR/TE=2500/35ms, 3x3x3mm3 isotropic resolution, FV=192×192mm2, SENSE factor=2, flip angle=90°, 200 volumes).
Task: Subjects performed a dynamic power grip task with their right hand, using a squeeze-ball. An event-related visually guided paradigm was used, comprising of 75 active trials divided equally among 5 grip forces (GF: 20%, 30%, 40%, 50%, 60%) of each subject's maximum voluntary contraction, interleaved with 75 rest trials.
Pre-processing: Using SPM12, standard fMRI pre-processing steps were applied, including slice timing, realignment, normalization and smoothing.
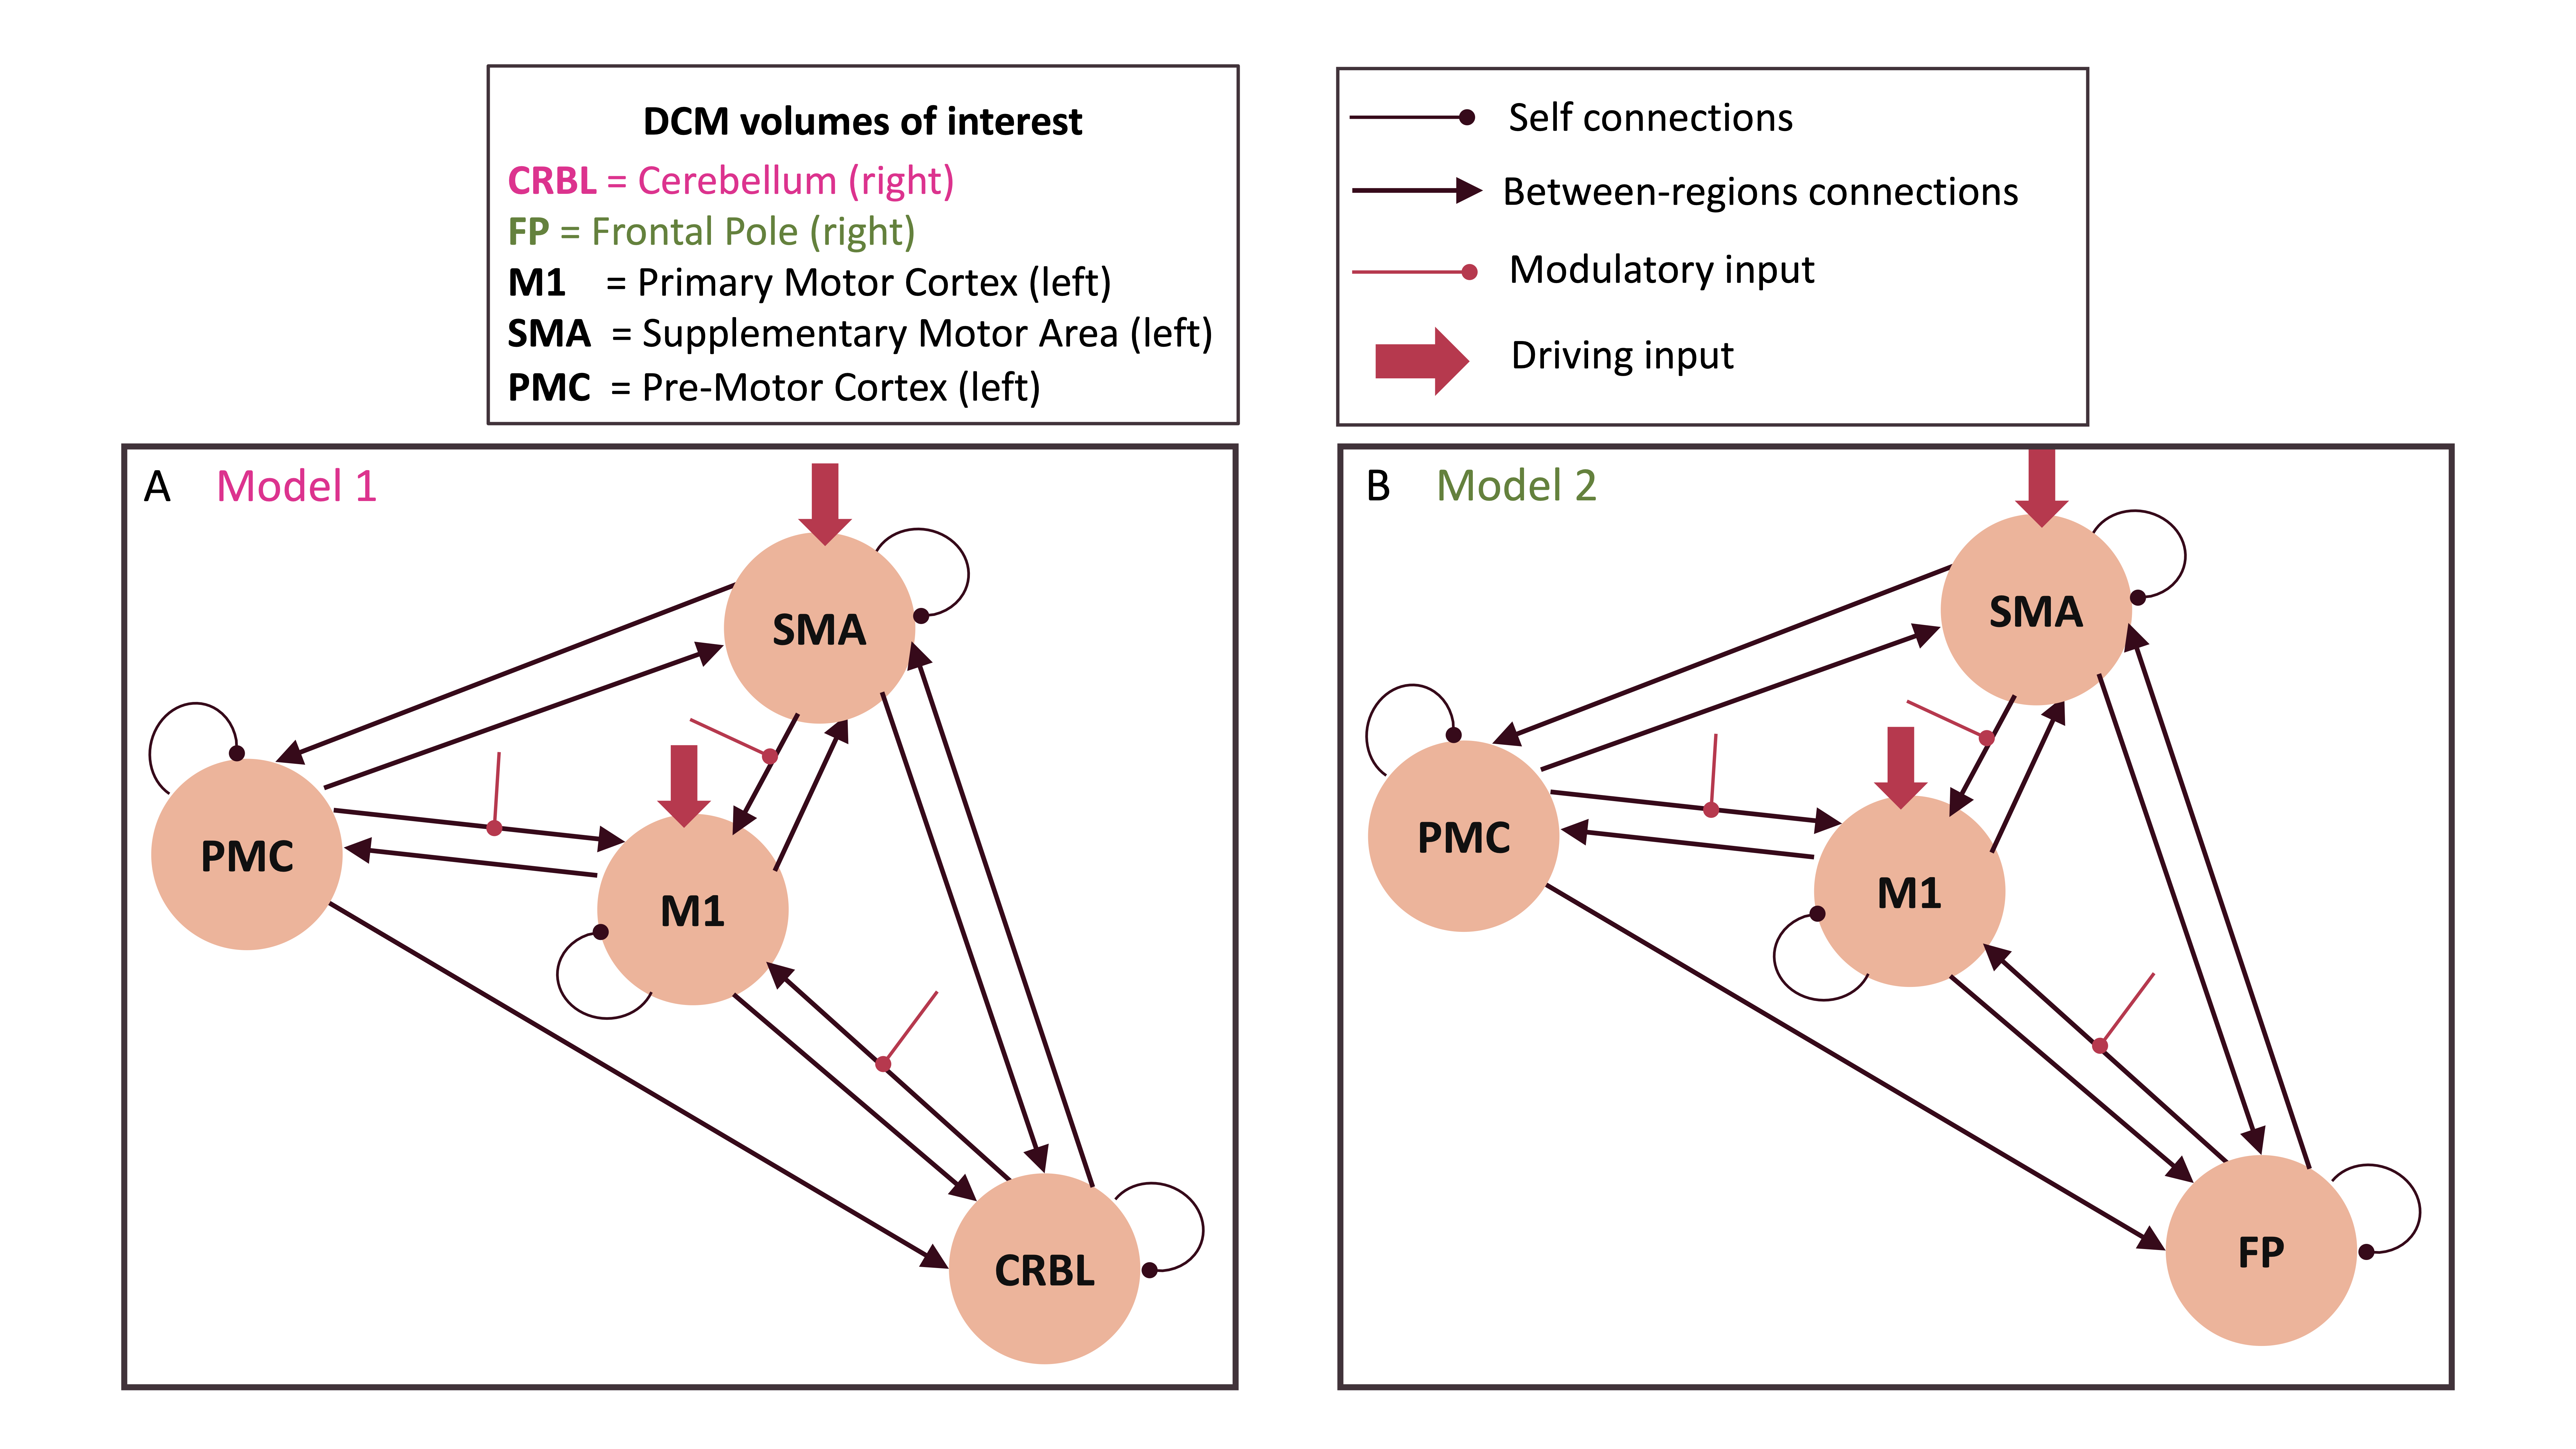
Models: For each subject, two different DCM models were specified (see Figure1), in order to investigate the role of cerebro-cerebellar connectivity in motor function. In the first (Figure1A), included volumes of Interest (VOIs) were left M1, left PMC, left SMA and right cerebellum (CRBL). In the second (Figure1B), CRBL was replaced with the right Frontal Pole (FP). This was done to test the cerebellar role in motor generation against the role of a region (FP) involved in motor coordination rather than motor execution. Action execution (AE) was set as the external driving input for M1 and SMA, and GF strength as modulatory input to all M1 input connections.
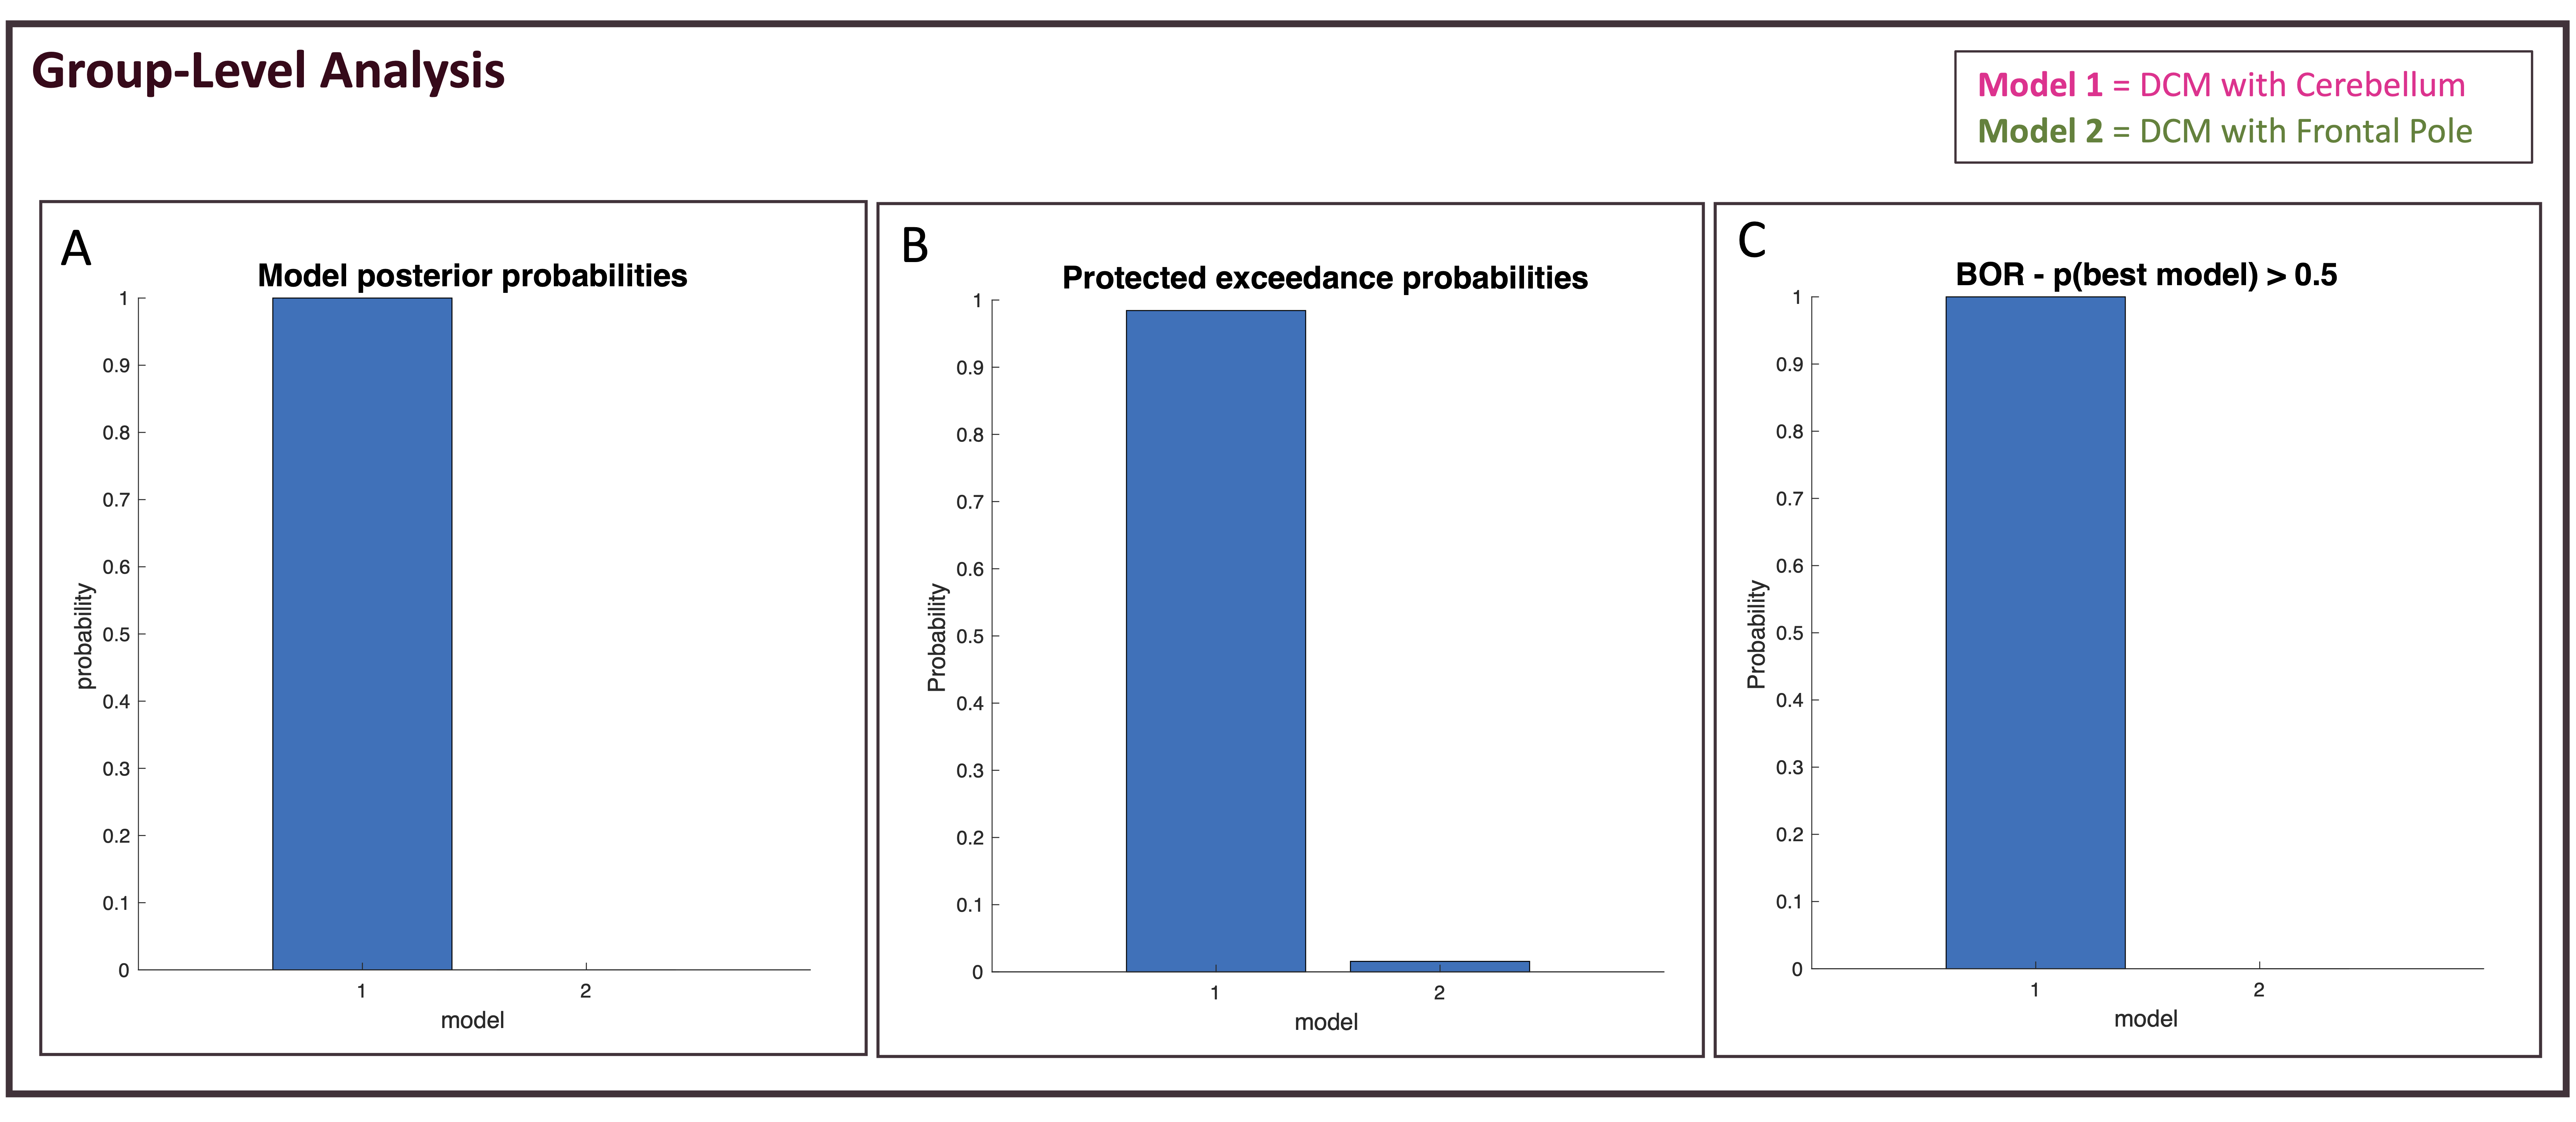
DCM analysis: The same analysis was repeated for both DCM models. For each VOI, time-series were extracted. Each DCM model was estimated and first-level analysis was performed for each subject. Between-regions connectivity parameters posterior probability was estimated through bayesian model inversion and variational free energy (F), which assesses model efficiency, was used as best-model selection criteria8. Bayesian Model Selection (BMS) was performed at group-level too, comparing F obtained from the two models between subjects7. Scores computed were: model posterior probability and protected exceedance probability, defined as the probability that each model is the most likely model across all subjects, considering the null hypothesis that model evidence differences are due to chance. Bayesian Omnibus Risk (BOR) was also reported as a measure of the statistical risk that BMS outcome is due to chance9.
Results
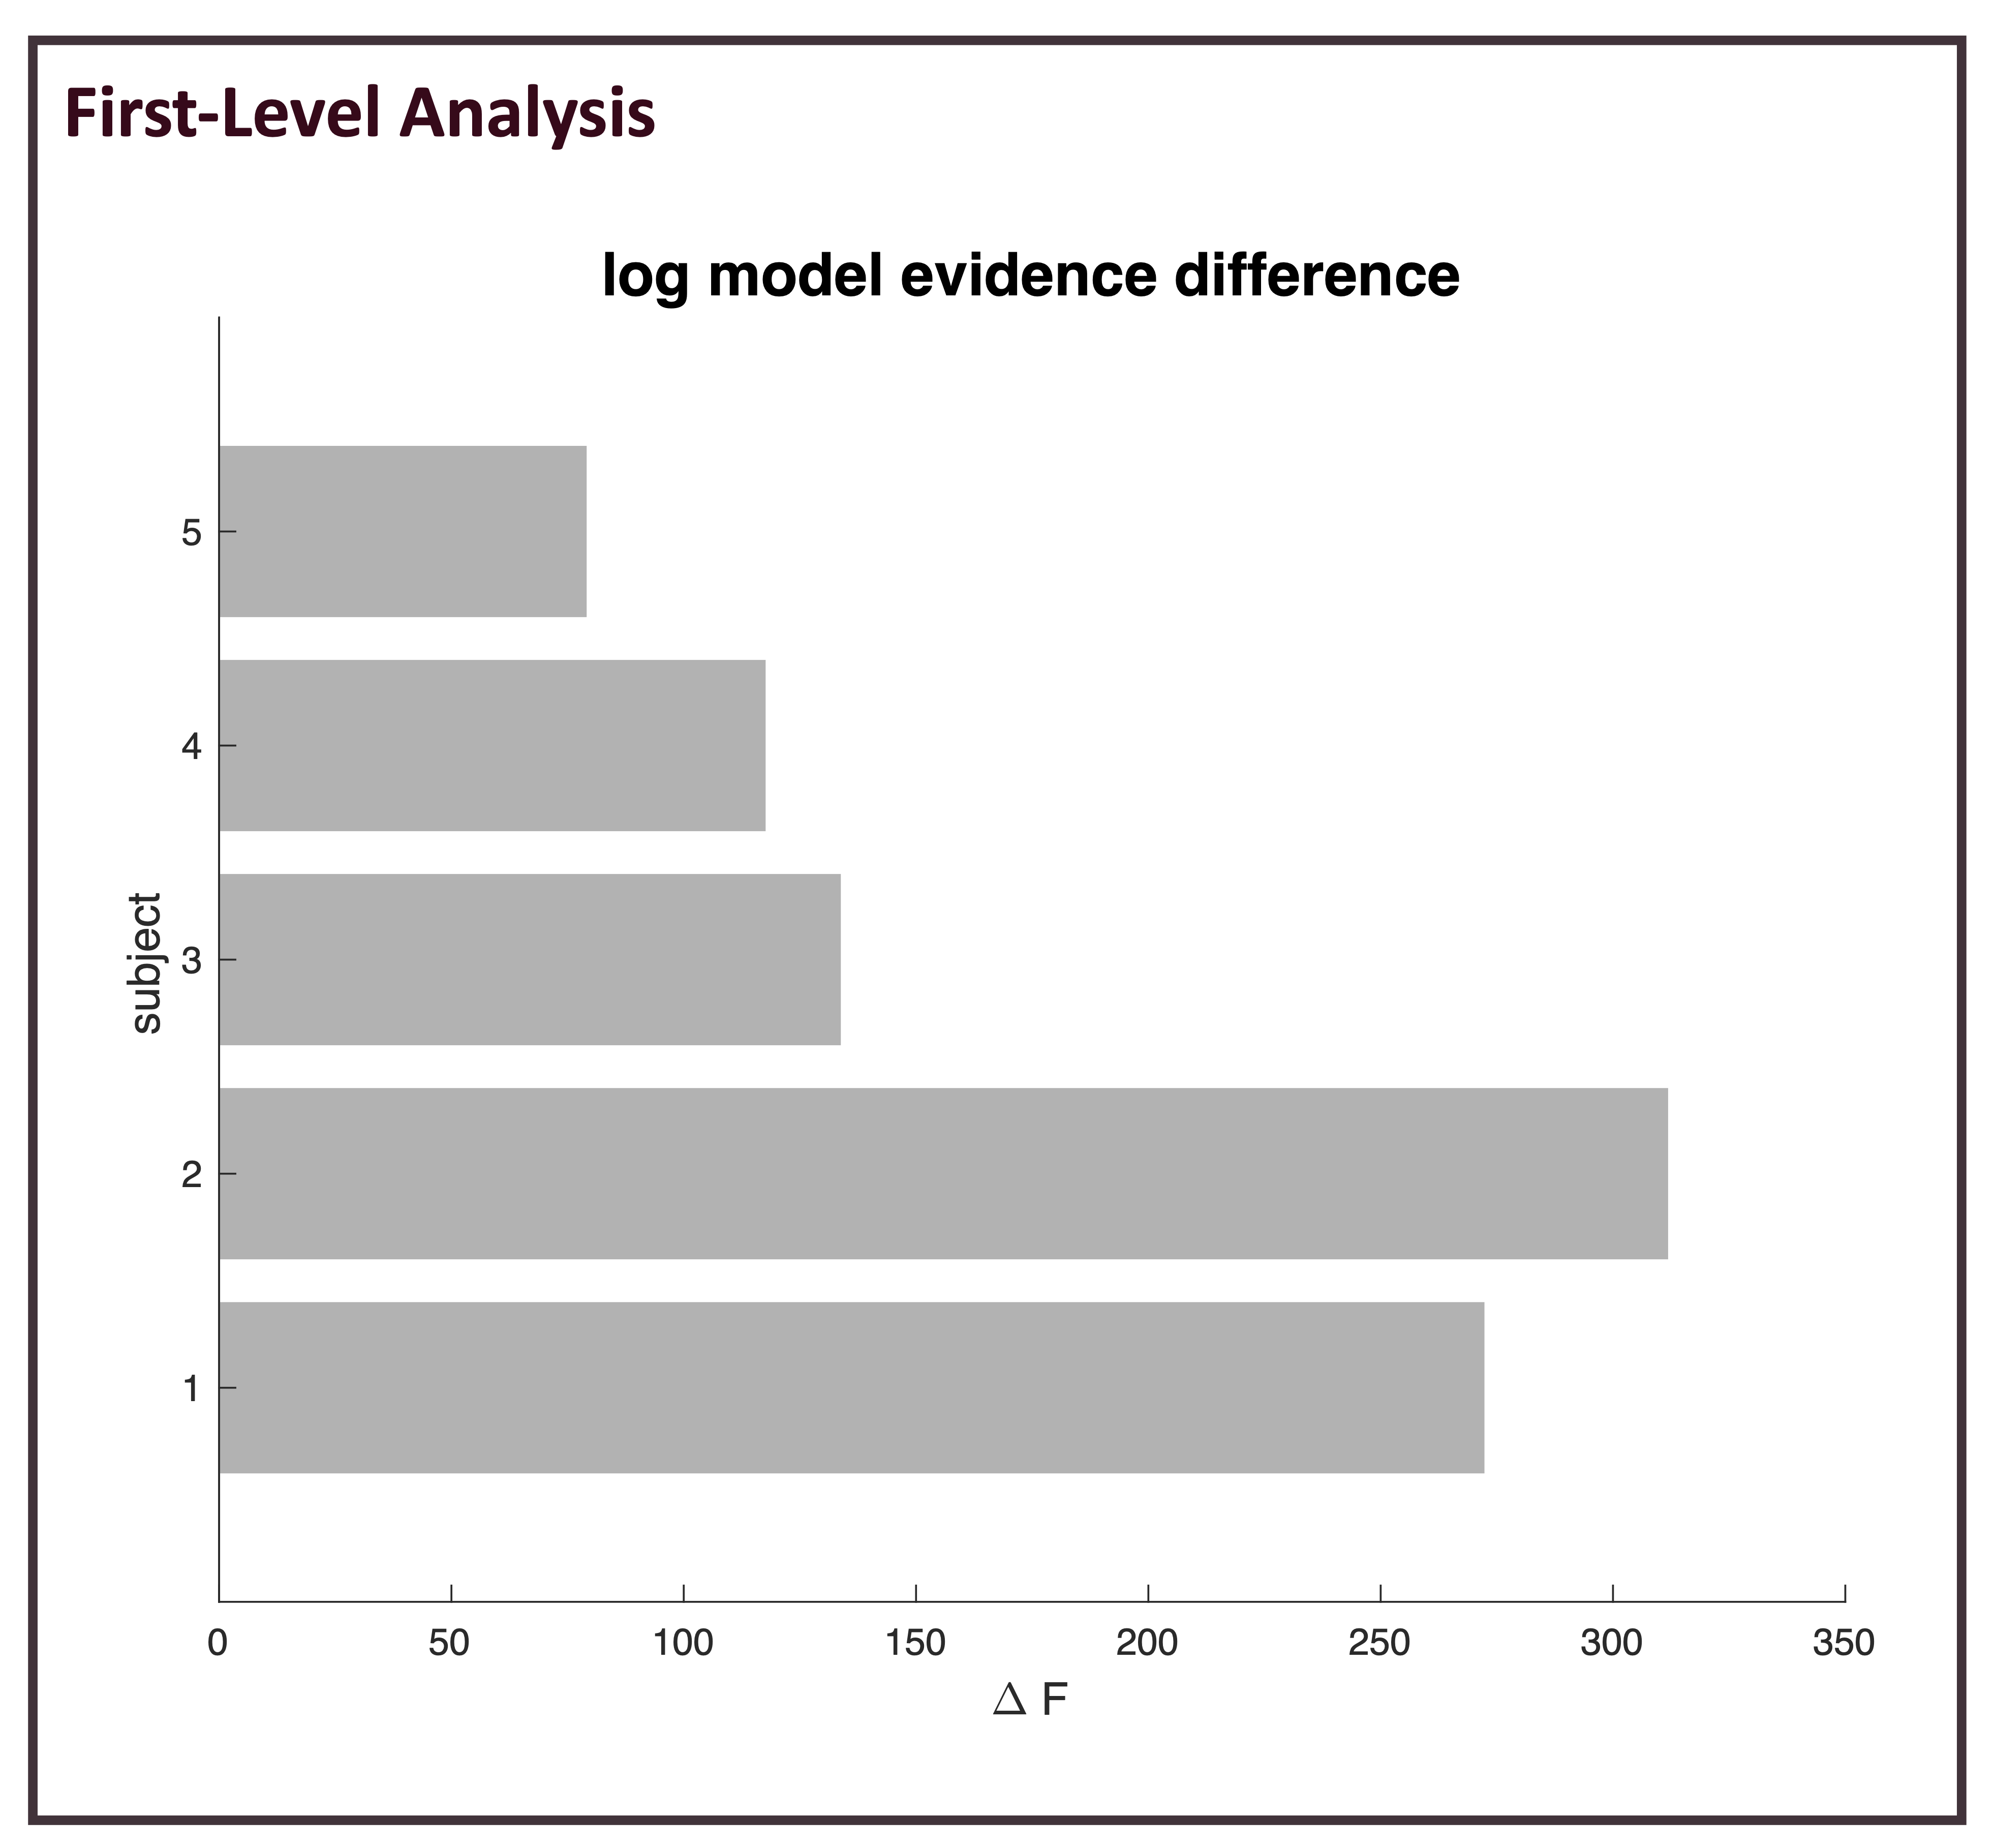
For all subjects, intra-subject model comparison, through the F score, shows that model prediction is higher for the model including CRBL than that using FP (Figure2). In line with first-level results, Figure3 shows that all parameters calculated for BMS are higher for the model including the cerebellum.Discussion and Conclusion
Our results show the relevance of including the cerebellum in a model of effective connectivity of the motor loop. The network that includes the cerebellum models the observed data with higher accuracy both at single-subject and group-level. Future work is needed to validate our results in a larger cohort of subjects, also investigating whether inter-subject variability could affect outcomes. To further investigate the cerebellum involvement in motion execution and to get a more realistic motor network, we plan to include also the thalamus as VOI because it is deeply connected with the cerebellum, and its inclusion would increase the accuracy of the model prediction. Furthermore, it would be very interesting to apply the same analysis to action observation, and assess whether the modulatory effect happens on the same connections when executing and observing actions. Needless to say that effective connectivity alterations of the motor circuit including the cerebellar node could be assessed to understand motor impairment in neurological diseases. It is to note that the DCM framework has recently been updated to include regions-specific neural models as generative models for a more physiological reliable BOLD signal simulations10-12. We are currently implementing a biologically realistic model of the cerebellum13, and once validated, we aim to performing simulations with the same motor network, replacing standard DCM equations with cerebellar specific ones.Acknowledgements
CGWK receives funding from the UK MS Society (#77), Wings for Life (#169111), Horizon2020 (CDS-QUAMRI, #634541), BRC (#BRC704/CAP/CGW). This research received funding by H2020 Research and Innovation Action Grants Human Brain Project 785907 and 945539 (SGA2 and SGA3) and by the MNL Project “Local Neuronal Microcircuits” of the Centro Fermi (Rome, Italy) to ED and FP.References
1. Friston KJ, Harrison L, Penny W. Dynamic causal modelling. Neuroimage 2003; 19(4):1273–1302. DOI: 10.1016/s1053-8119(03)00202-7
2. Alahmadi AAS, Samson RS, Gasston D, et al. Complex motor task associated with non-linear BOLD responses in cerebro-cortical areas and cerebellum. Brain Struct. Funct. 2016;221(5):2443–2458. DOI: 10.1007/s00429-015-1048-1
3. Friston KJ, Kahan J, Biswal B, Razi A. A DCM for resting state fMRI. Neuroimage 2014; 94:396–407. Available from: http://dx.doi.org/10.1016/j.neuroimage.2013.12.009
4. Havlicek M, Roebroeck A, Friston KJ, et al. On the importance of modeling fMRI transients when estimating effective connectivity: A dynamic causal modeling study using ASL data. Neuroimage 2017; 155(March):217–233. Available from: http://dx.doi.org/10.1016/j.neuroimage.2017.03.017.
5. Casiraghi L, Alahmadi AAS, Monteverdi A, et al. I See Your Effort: Force-Related BOLD Effects in an Extended Action Execution–Observation Network Involving the Cerebellum. Cereb. Cortex 2019; 29(3):1351–1368. DOI: 10.1093/cercor/bhy322
6. Zeidman P, Jafarian A, Corbin N, et al. A guide to group effective connectivity analysis, part 1: First level analysis with DCM for fMRI. Neuroimage 2019; 200(June):174–190. DOI: 10.1016/j.neuroimage.2019.06.031
7. Zeidman P, Jafarian A, Seghier ML, et al. A guide to group effective connectivity analysis, part 2: Second level analysis with PEB. Neuroimage 2019; 200(March):12–25. Available from: https://doi.org/10.1016/j.neuroimage.2019.06.032.
8. Friston K, Mattout J, Trujillo-Barreto N, et al. Variational free energy and the Laplace approximation. Neuroimage 2007; 34(1):220–234. DOI: 10.1016/j.neuroimage.2006.08.035
9. Rigoux L, Stephan KE, Friston KJ, Daunizeau J. Bayesian model selection for group studies - Revisited. Neuroimage 2014;84:971–985. Available from: http://dx.doi.org/10.1016/j.neuroimage.2013.08.065
10. Friston KJ, Preller KH, Mathys C, et al. Dynamic causal modelling revisited. Neuroimage 2019; 199(February):730–744. Available from: https://doi.org/10.1016/j.neuroimage.2017.02.045.
11. Pinotsis DA, Moran RJ, Friston KJ. Dynamic causal modeling with neural fields. Neuroimage 2012; 59(2):1261–1274. Available from: http://dx.doi.org/10.1016/j.neuroimage.2011.08.020.
12. van Wijk BCM, Cagnan H, Litvak V, et al. Generic dynamic causal modelling: An illustrative application to Parkinson’s disease. Neuroimage 2018;181(January):818–830. Available from: https://doi.org/10.1016/j.neuroimage.2018.08.039
13. Lorenzi RM, Geminiani A, Gandini Wheeler-Kingshott A.M. Biologically-driven cerebellar neural mass model for improving BOLD signal simulations. Submitted for ISMRM 2021.
Figures