3129
Detection of High-Frequency Resting-State Connectivity using Spectrally and Temporally Segmented Regression of High-Speed fMRI Data1Nuclear Engineering, U New Mexico, Albuquerque, NM, United States, 2Neurology, U New Mexico, Albuquerque, NM, United States, 3Physics and Astronomy, U New Mexico, Albuquerque, NM, United States
Synopsis
This study investigates resting-state signal fluctuations at high-frequencies (>0.3Hz) using a novel regression method for high-speed fMRI data. Respiration and cardiac related signal changes and motion parameters were regressed using a spectral and temporal segmentation approach. This novel approach was shown to substantially remove physiological noise and motion effects. It reduces artificial high-frequency correlations compared with a recently developed sliding window regression approach. High frequency connectivity maps showed comparable localization to low frequency connectivity maps.
INTRODUCTION
Previous studies, using high speed fMRI, have shown resting-state signal fluctuations at frequencies as high as 5Hz2. However, respiration and cardiac related signal fluctuations and their harmonics as well as head movement may occupy wide frequency bands that are not stationary during the scan. Frequency filtering of physiological signal fluctuations decreases the spectral range available for statistical analysis, resulting in loss of sensitivity and specificity. Conventional whole-bandwidth linear regression of physiological signal fluctuations and motion parameters can result in the introduction of artifactual high frequency connectivity of rapidly sampled fMRI data1,2. We have developed a spectrally and temporally segmented regression for high-speed resting-state fMRI data3.This study investigates the feasibility of mapping high frequency resting-state signal fluctuations in high-speed fMRI using this novel regression approach. A comparison with the recently proposed model-based physiological noise removal approach (HRAN)4 was performed.
METHODS
Resting-state fMRI data (eyes open) during normocapnic state (pETCO2: 40+/-2mmHg) was acquired in 3 male subjects (2 healthy controls, 1 brain tumor patient) on a 3T scanner using a 32-channel array coil. The pulse sequence used for the healthy subjects was multi-slab echo-volumar-imaging (MS-EVI) (TR/TE: 246/30 ms, slice partial Fourier: 6/8, no. slabs/slices: 4/29, voxel size: 4mm isotropic, scan time: 4min35s). Multi-band EPI (TR/TE:205/30ms, multi-band acceleration factor: 8, no. slices 24, voxel size: 4mm isotropic, scan time: 10min21s) was used for the patient.Preprocessing was performed using a custom MATLAB tool (TurboFilt). Regression vectors from temporal and spectral segmentation of motion parameters were constructed3. Physiological noise in each time segment was labeled in the frequency domain and detected within spatial masks based on a power-spectral integral threshold relative to a labeled non-physiological noise frequency range3. Regression vectors within discrete frequency bands were constructed from signals averaged within the masks3. The HRAN regression, which assumes a single-frequency confound, was performed for comparison using a 30 second sliding window with 50% overlap and regression vectors based on the frequency bands of respiratory and cardiac pulsation by inspection of the spectral domain. Resting-state seed-based connectivity analysis was performed using TurboFIRE5,6. For the high-frequency data the following parameters were used: spatial smoothing using a 5mm isotropic Gaussian Filter and an 8 seconds sliding-window with meta-statistics. Unilateral seeds were selected in auditory (AUD) and sensorimotor (SMN) cortices. Bilateral seeds were selected in visual cortex (VSN) and in the default mode network (DMN), as well as white matter (WM) and CSF. For the low-frequency analysis, a 4 seconds moving average filter with 100% hamming window and CSF and WM signal regression was additionally applied.
RESULTS AND DISCUSSION
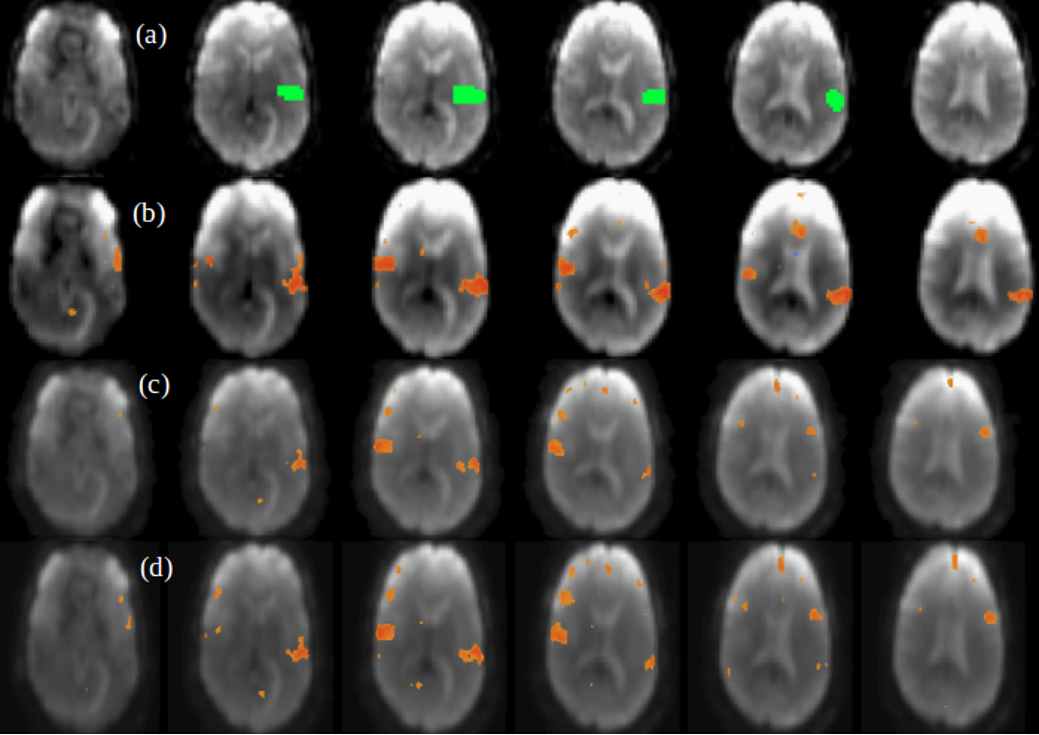
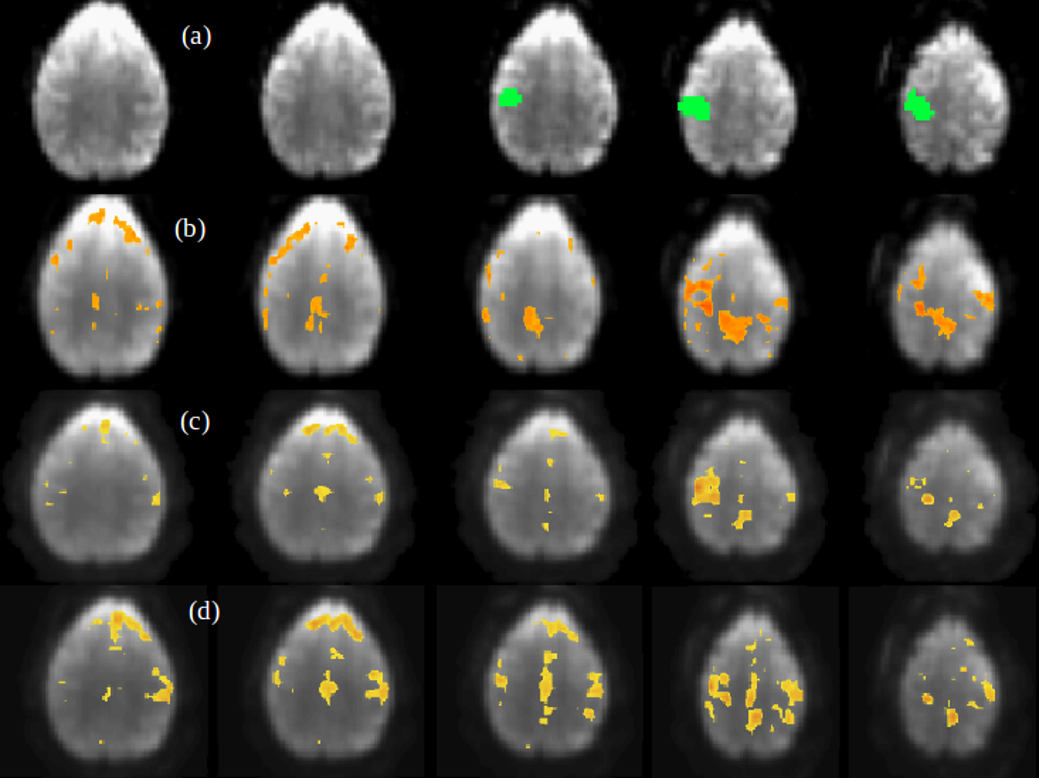
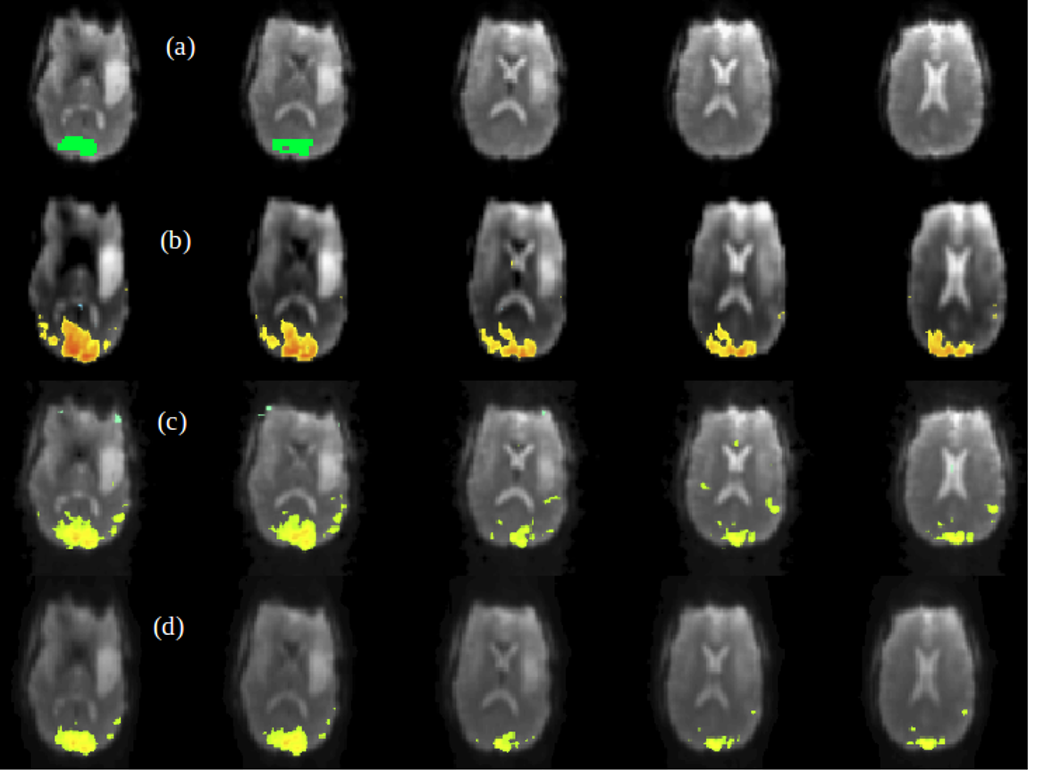
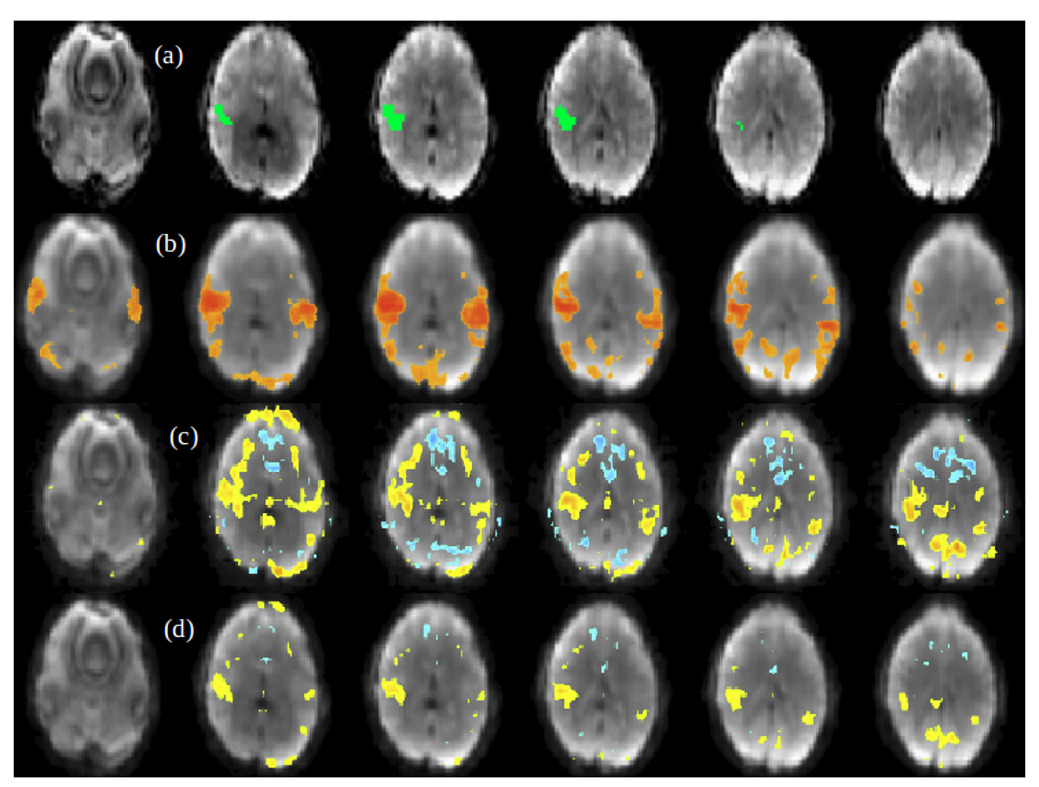
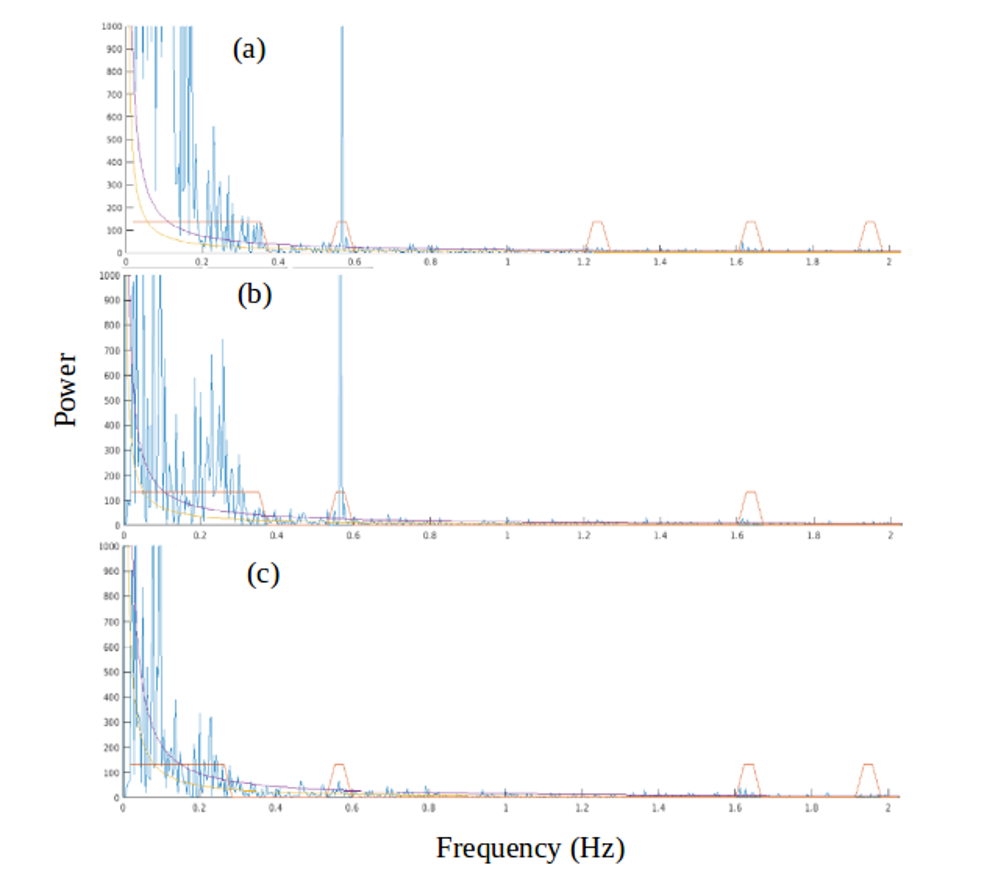
A comparison between the low-frequency, spectral and temporally regressed high-frequency and HRAN regressed high-frequency connectivity maps is displayed in Figures 1-4. It shows similar spatial localization of low-frequency and high-frequency resting-state networks. The novel regression approach substantially removes physiological noise present at high frequencies. Compared to HRAN, the spectrally and temporally regressed approach provides increased sensitivity in the first healthy subject (Figures 1 and 2), reduction of false positive connectivity in the case of the brain tumor patient (Figure 3) and a substantial reduction of artifactual connectivity in the second healthy subject where respiratory noise covered a wider range of frequencies than in the other subjects (Figure 4). The increased suppression of respiratory noise in the frequency band up to 0.4 Hz using the spectrally and temporally regressed approach compared with HRAN regression is shown in the spectra in Figure 5.CONCLUSIONS
This study demonstrates the feasibility of performing a spectrally and temporally segmented regression as a preprocessing step to denoise the higher frequencies of high-speed fMRI datasets. Results shows the presence of resting-state high-frequency correlations and reduction of artificial correlations compared with a recently developed sliding window regression approach.Acknowledgements
Supported by 1R21EB022803-01. We gratefully acknowledge Essa Yacoub, Sudhir Ramanna and Steen Moeller for their contributions to the development of multi-slab echo-volumar imaging.References
1. S. Posse, E. Ackley, R. Mutihac, J. Rick, M. Shane, C. Murray-Krezan, M. Zaitsev, and O. Speck, "Enhancement of temporal resolution and BOLD sensitivity in real-time fMRI using multi-slab echo-volumar imaging," Neuroimage, vol. 61, pp. 115-130, May 15 2012, 3342442.
2. C. Trapp, K. Vakamudi, and P. S, "On the detection of high frequency correlations in resting state fMRI," NeuroImage, 2017.
3. K. Talaat, B. Guimaraes, S. Posse “Spectrally Segmented Regression of Physiological Noise and Motion in High-Bandwidth Resting-State fMRI”, Abstract submitted to ISMRM2021
4. Agrawal U, Brown EN, Lewis LD. Model-based physiological noise removal in fast fMRI. Neuroimage. 2020 Jan 15;205:116231. doi: 10.1016/j.neuroimage.2019.116231. Epub 2019 Oct 4. PMID: 31589991; PMCID: PMC6911832.
5. S. Posse, F. Binkofski, F. Schneider, D. Gembris, W. Frings, U. Habel, J. B. Salloum, K. Mathiak, S. Wiese, V. Kiselev, T. Graf, B. Elghahwagi, M. L. Grosse-Ruyken, and T. Eickermann, "A new approach to measure single-event related brain activity using real-time fMRI: Feasibility of sensory, motor, and higher cognitive tasks," Human Brain Mapping, vol. 12, pp. 25-41, Jan 2001.
6. S. Posse, E. Ackley, R. Mutihac, T. Zhang, R. Hummatov, M. Akhtari, M. Chohan, B. Fisch, and H. Yonas, "High-speed real-time resting-state FMRI using multi-slab echo-volumar imaging," Front Hum Neurosci, vol. 7, p. 479, 2013, 3752525.
Figures