3125
Investigating the relationship between temporal SNR and resting-state networks to evaluate the feasibility of fMRI at a low field MR scanner1xMR Labs, Physics and Astronomy, Western University, London, ON, Canada, 2Medical Biophysics, Western University, London, ON, Canada, 3Donders Institute, Radbound University, Nijmegen, Netherlands
Synopsis
This preliminary investigation evaluates the feasibility of resting-state BOLD fMRI at a 0.5T MR scanner equipped with a high-performance gradient coil. Here, we evaluated the decrement in the number of extracted resting-state networks as tSNR decreased with reduced scanner field strength. The results from this study suggest a positive linear relationship between the calculated correlation coefficients for different resting-state networks and tSNR within a 95% confidence interval. A lower limit on the tSNR at which the networks are detectable can be calculated from this analysis and will be used in experimental studies with the 0.5T scanner.
Introduction
Blood Oxygen Level Dependent (BOLD) functional magnetic resonance imaging (fMRI) studies have not been performed using low-field scanners due to low magnetic susceptibility contrast and inadequate gradient performance. However, with recent introduction of relatively easy to site and comparatively cheap high-performance low-field scanners, it is timely to re-evaluate the feasibility of low-field fMRI1. The availability of this technique at a low-field setting would allow the use of such scanners for specific applications such as for intraoperative purposes, providing surgeons with better visualization of tumor location and improved tissue preservation in nearby healthy regions. Specifically, this re-evaluation is intended to test the feasibility of a superconducting, head-only 0.5T system, which while being at a lower field strength, is equipped with a high-performance gradient coil. Previous diffusion weighted imaging (DWI) studies performed on a similar scanner suggest the expected image signal to noise ratio (SNR) efficiency to be only 6 % different from a 1.5T system2. For fMRI studies, operational field strength of a scanner will have an impact on the SNR of the BOLD signal which will in turn determine the networks or regions that are activated during task-based or resting-state studies. Therefore, in this abstract we will investigate the relationship between the signal to noise ratio and the regions detected using a range of artificially created noisy resting-state functional data aimed to mimic behaviour seen at lower field strengths.Method
For the purpose of this abstract, resting-state data were collected using a 3T scanner involving 4 healthy volunteers. The aim of any fMRI study is to detect small fluctuations in the signal over a period of time, which is why signal to noise ratio of the time series (tSNR) is an important metric and it will also have an impact on functional activation. Therefore, in this study SNR was determined independently for each voxel over the time course of the data and not based on the SNR from a single static image3. The previously collected data were manipulated by introducing additional Rician noise of varying scale parameters to the time series signal for each voxel. Both collected and modified data sets were passed on to GraphICA, a functional connectivity analysis platform developed by Brainet – Brain Imaging Solutions Inc., which performs independent component analysis (ICA) based on dual regression implemented in FSL. GraphICA uses a gradient-weighted Markov Random Field (gwMRF) parcellation technique4 along with a mixture model approach5 for thresholding. In GraphICA, the resting-state networks from the original and modified range of data for each volunteer were compared statistically to a normative database of 570 cases with 206 females and 364 males.Results
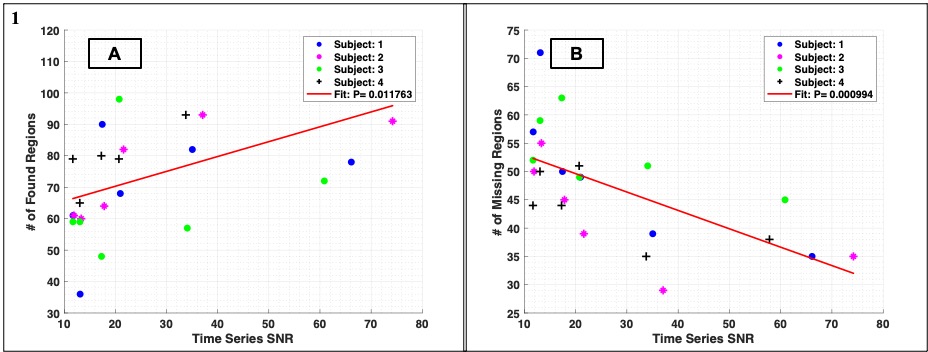
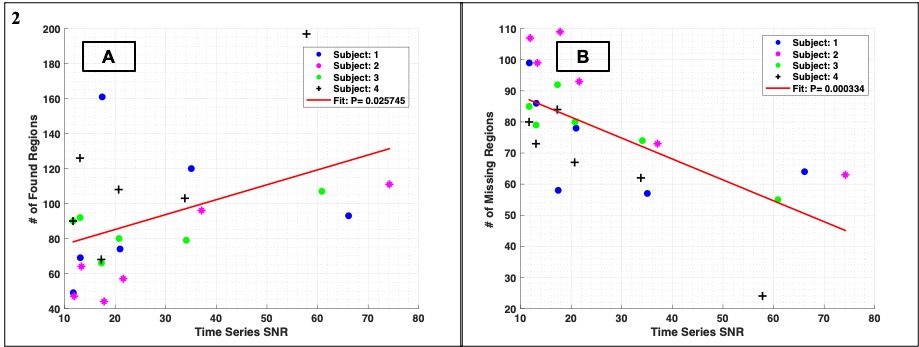
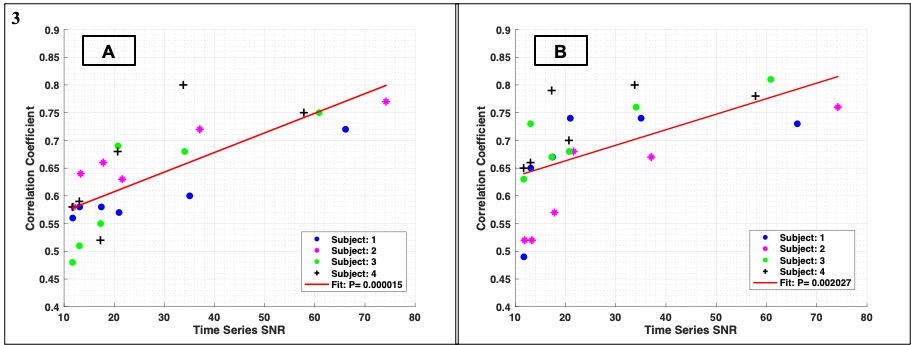
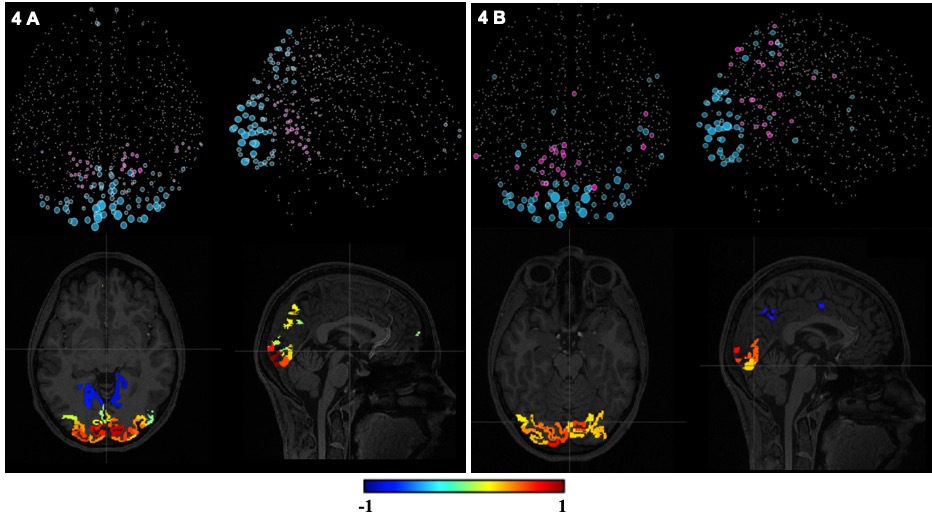
Figures 1. and 2. show the number of found and missing regions identified within the Auditory and Default Mode Network (DMN) over a range of tSNR respectively. Figure 3. shows the positive linear relationship between the correlation coefficient and tSNR for Auditory and DMN respectively. Figure 4. shows the Visual Occipital region for a specific healthy volunteer, with 4a. referring to originally collected data with the average tSNR of 74.2, and 4b. referring to modified data with the average tSNR of 17.8.Discussion
Figures 1a. and 2a. suggest a linear increase in the number of found regions within the Auditory and DMN for each subject as tSNR increases. Figures 1b. and 2b. suggest a linear decrease in the number of missing regions within the Auditory and DMN for each subject as tSNR increases. The results from both of these figures indicate that as field strength of the scanner is decreased, the number of found regions within a specific network decreases, whereas the number of missing regions within a specific network increases. Similar behaviour was observed for all other resting-state networks. As expected, Figure 3. suggests a positive linear increase in the correlation coefficient as tSNR increases for 2 different networks. Figures 4a. and 4b. show the visual occipital region detected from 2 different datasets implying that behaviour observed is mimicking the results from 2 different operational field strengths. Figure 4b. shows the existence of other pathologies that were not detected in 4a. suggesting the results seen in 4b. are skewed, indicating the effects of added noise.Conclusion
The overall behaviour shows that there is a positive correlation between tSNR, and regions detected. The tSNR on the other hand is dependent on the operational field strength of the scanner. This analysis will provide a lower limit on tSNR at which the networks or regions of interest are still detectable, which will be used in future experimental studies with the 0.5T scanner.Acknowledgements
The authors would like to thank the research and financial supports received from Natural Sciences and Engineering Research Council (NSERC) of Canada and Ontario Research Fund (ORF).References
1. Wang, Y.et al. (2020). Transition-Band SSFP and EPI Functional MRI on a High-Performance 0.55 T Scanner. ISMRM.
2. Stainsby, Jeff.et al. (2020). High-Performance Diffusion Imaging on a 0.5 T system. ISMRM.
3. Parrish, T. B. et al. (2000). Impact of Signal-to-Noise on Functional MRI. MRM.
4. Schaefer, A. at al. (2018). Local-Global Parcellation of the Human Cerebral Cortex from Intrinsic Functional Connectivity MRI. Cerebral Cortex.
5. Bielczyk, N. Z. et al. (2018). Thresholding functional connectomes by means of mixture modeling. NeuroImage.
Figures