3124
A phantom system for evaluating the effect of lipid and iron composition on qMRI parameters1The Edmond and Lily Safra Center for Brain Science, The Hebrew University of Jerusalem, Jerusalem, Israel, Jerusalem, Israel
Synopsis
Neurodegenerative diseases such as Alzheimer, Parkinson, and Multiple sclerosis are often linked to abnormal changes in lipids and iron. Lipids are the main components of any membrane, including myelin, and iron is an essential brain’s trophic. The interaction of lipids and iron with water protons is considered to be a major contributor to the brain’s MRI signals. Here we examine the combined effects of the iron and lipid compositions on quantitative MRI parameters using a novel phantom system. We quantitatively characterize the R2* dependence on lipid and iron concentrations.
Introduction
Lipids are the building blocks of all cell membranes, such as the myelin sheath1. They comprise about half of the human brain’s dry weight2,3 and are involved in many metabolic processes and cellular functions4. Changes in lipid composition were linked to neurogenerative diseases such as Alzheimer, Parkinson, and Multiple sclerosis5,6.The human brain requires iron to perform many vital physiological functions7–12. For example, iron is required for myelin formation and maintenance13. Abnormalities in iron concentrations are associated with a number of neurogenerative diseases9,12,14–16.
Both lipid and iron contents have been shown to have a strong effect on magnetic resonance imaging (MRI) signal17,18. Quantitative MRI (qMRI) with physical units allows to reliably compare healthy and pathological tissue using parameters such as relaxation rates17,18,20–23. Nevertheless, it’s still a major challenge to identify and quantify the contributions of specific molecular compounds to the MRI signal. Specifically, it is hard to distinguish whether changes in qMRI measurements result from changes in iron paramagnetic properties or alterations in the lipid content8,18,23. The ability to quantify the separate contributions of iron and lipids in the brain would be beneficial for clinical diagnostics and hopefully would contribute to understating the pathogenesis of the diseases9.
We developed a phantom system composed of different types of lipids and iron at different concentrations. This is an extension of our previous phantom system based on lipids only17,18. This phantom system demonstrates that qMRI parameters of relaxation time and magnetization transfer can be estimated with high reproducibility17. In the human brain, where iron and lipid content changes are correlated8, it may be rather difficult to distinguish between the contribution of each component separately. However, with our phantom system, we will be able to identify their specific contribution.
Our present phantom system is designed to evaluate the contribution of lipids and iron to qMRI parameters such as R2*.
Methods
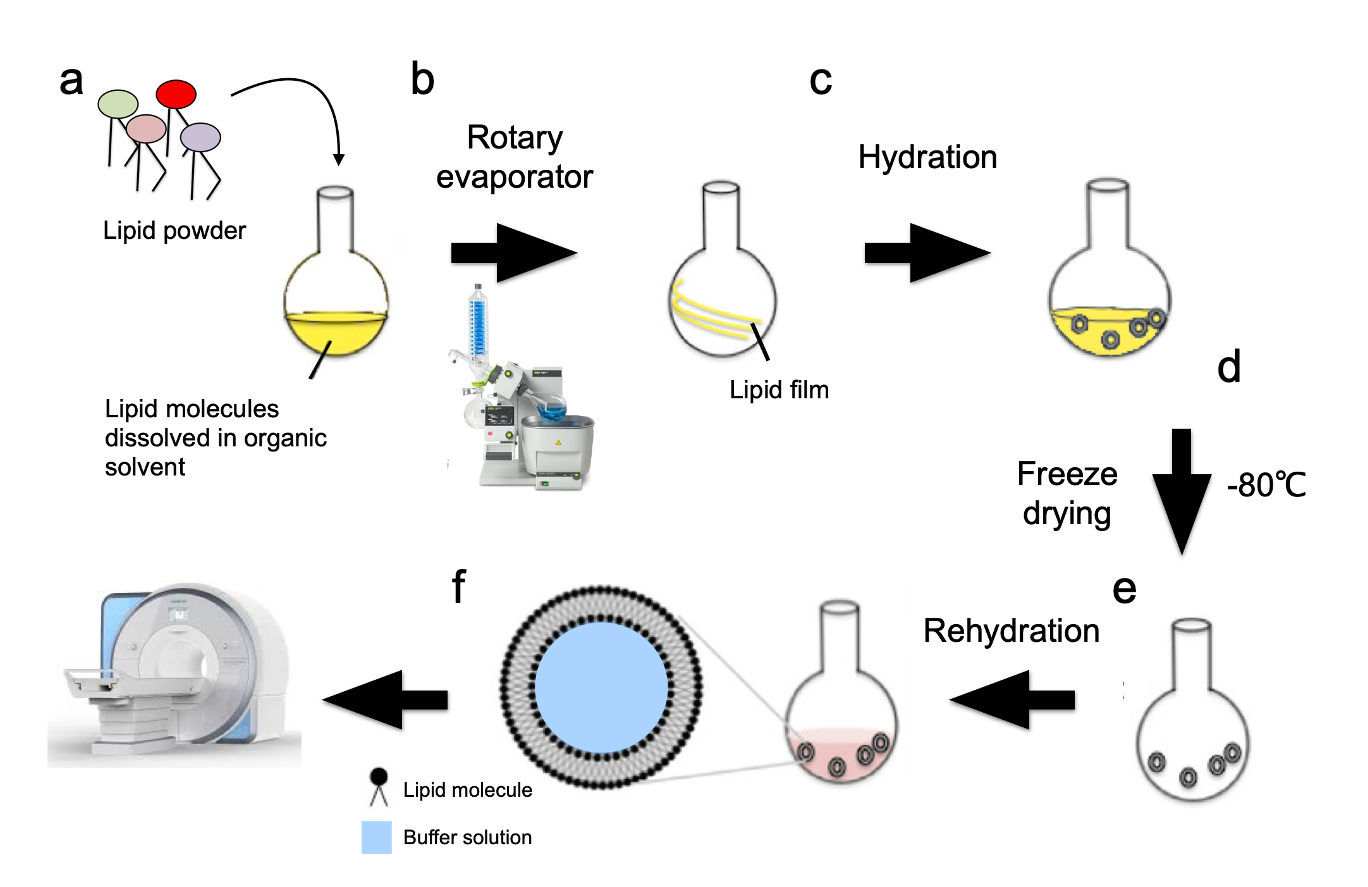
The phantom system is designed as a multilamellar vesicle (MLV) encapsulating water and iron ions in-between its membrane bilayers. We used soy phosphatidylcholine (PC) and a mixture of PC with cholesterol or egg sphingomyelin (SM) at different water fractions (WF). The MLV samples were mixed in chloroform at desired mole ratios and evaporated under reduced pressure in a rotary evaporator vacuum system. The resulting lipid film was resuspended in a 10 mM ammonium bicarbonate solution, lyophilized, and subsequently hydrated in the reassembly buffer containing different concentrations of iron and deionized water (Fig. 1).The phantoms were scanned in a Skyra 3T MRI Siemens scanner with a 32 channel receive head-coil with scan protocol for estimating different qMRI parameters such as R1, R2, R2*, MTsat, and MTV (macromolecular and lipid tissue volume)17,18,23,25,26.
Results
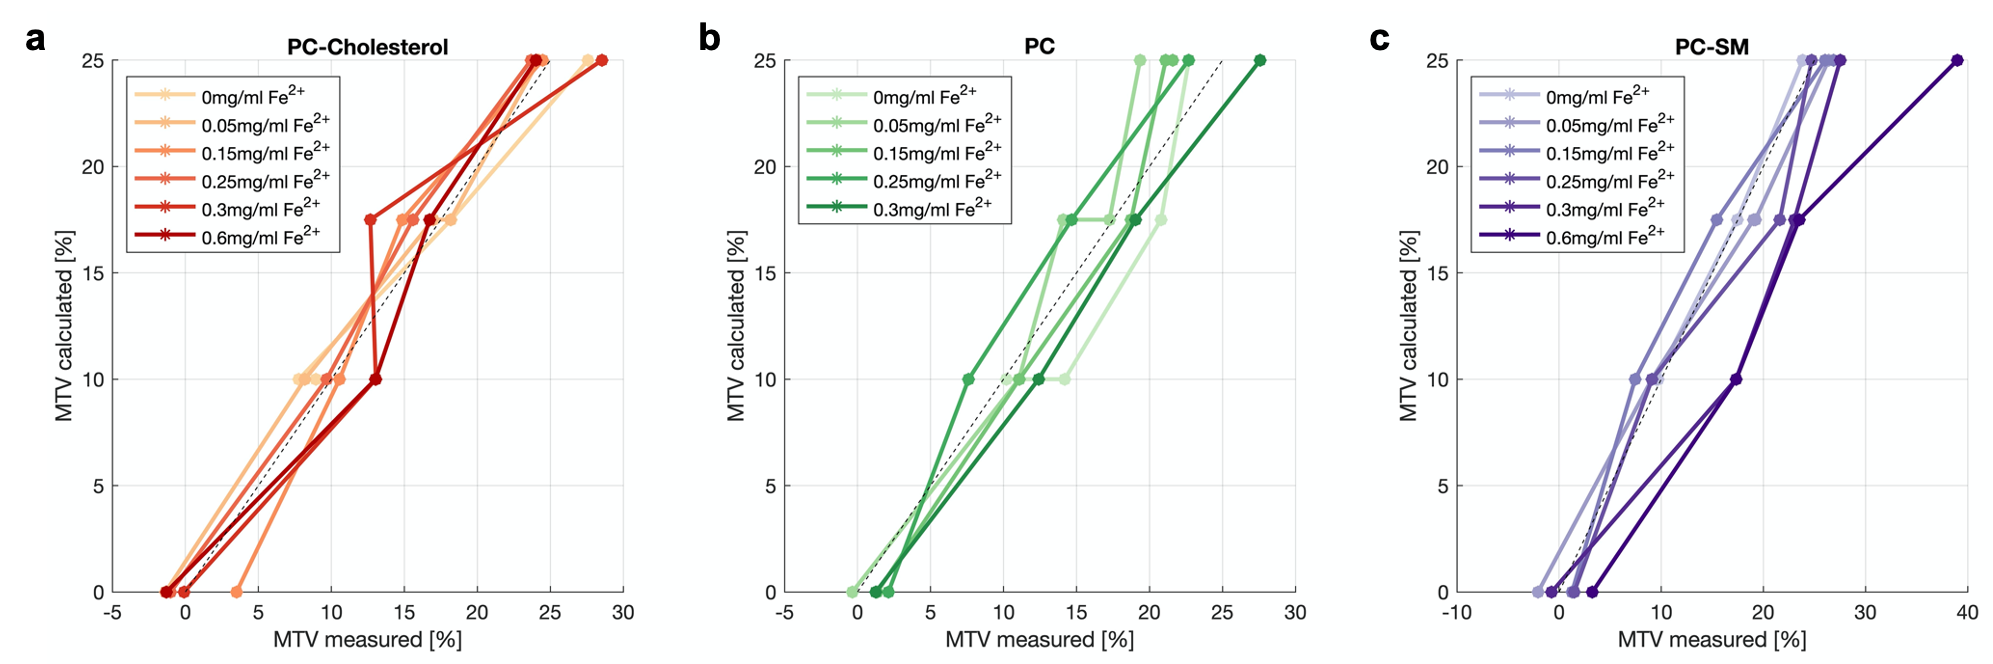
We prepared phantom samples that contain varying amounts of lipid-water fractions in 10%, 17.5%, and 25% v/v, at different concentrations of iron ions, Fe2+ (0.05, 0.15, 0.25, and 0.3 mg/ml).First, we validated the phantom system and tested its reliability. We tested the MRI estimation of MTV, which is the non-water fraction, defined as 1 – WF. The qMRI MTV parameter, showed a very good agreement with the calculated lipid fraction volume (Fig. 2), for all iron concentrations. We also tested the reproducibility of the system by comparing different qMRI parameters of the same phantom taken on different days and found a strong reproducibility (R2=0.92 on average). We found that our phantom system of lipids and iron is a reliable and reproducible tool to examine the contribution of lipid and iron to qMRI parameters.
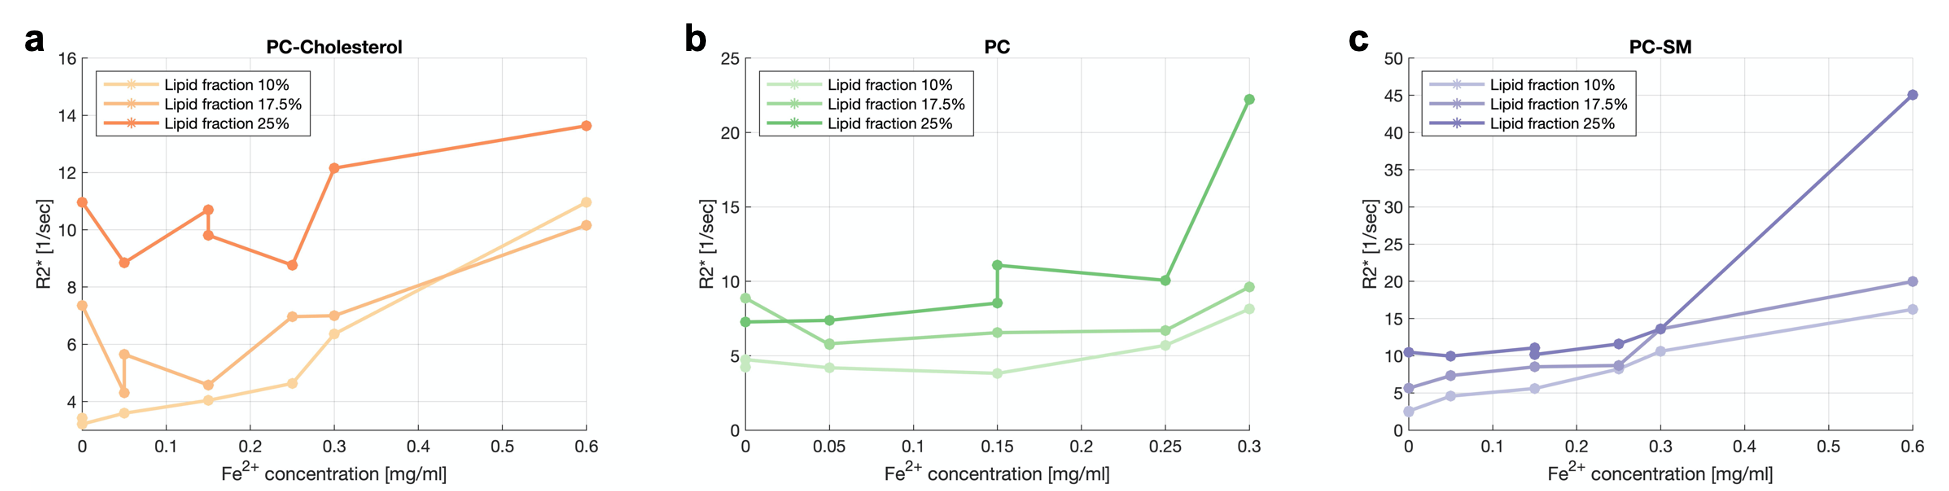
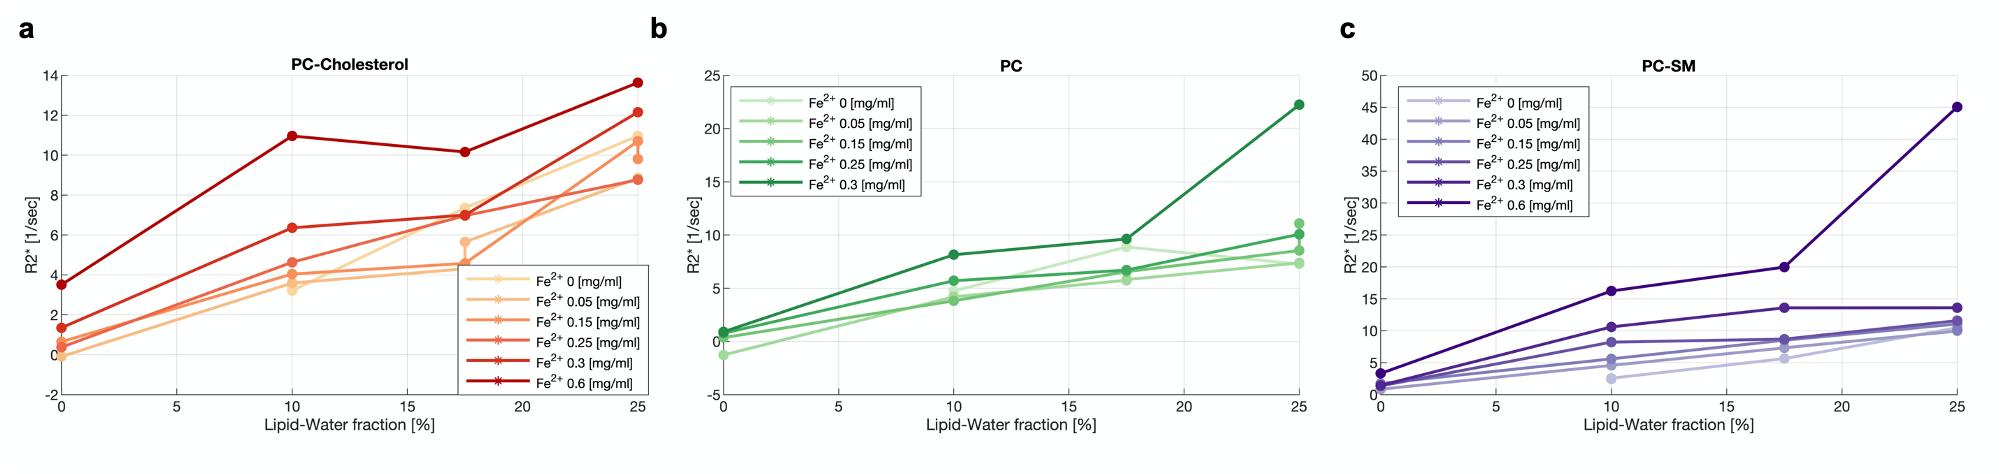
To emphasize the potential contribution of the lipids and iron concentrations phantom system, we focused on R2*. Previous studies showed a link between R2* and iron presence in the brain11,19,22. We replicated this result in our phantom system and found a dependency of R2* and iron concentration (Fig. 3) for all lipid types. Next, we tested the dependency of R2* on the lipid-water fraction. Interestingly, we found that R2* is dependent on the lipid concentration for every lipid type phantom system (Fig. 4). We found a non-additive effect of iron and lipid-water fraction on the R2* parameter. Hence, the phantom system highlights the strong dependency of R2* on lipid concentration on top of the iron concentration.
Conclusions
We developed a phantom system, composed of different lipids, for evaluating the separate effects of the iron and lipid contents on qMRI parameters. We found that the phantom system is a reliable tool for assessing qMRI parameters. This phantom system is designed to evaluate the contribution of lipids and iron to qMRI parameters such as R1, R2, R2*, and MT.qMRI parameters show dependency on both lipid compositions and iron. As expected, R2* was affected by iron concentration, with increased concentrations of Fe2+ exhibiting greater R2* for all lipid types. In addition, we found that R2* values are also highly dependent on the lipid-water fraction. Further experiments and analysis will allow us to evaluate the exact nature of the interaction between these dependencies. In conclusion, this phantom system, in which we can control the lipid type and iron content will allow us to better understand and model the biophysical sources of qMRI parameters and improve their use as biomarkers for assessing brain changes.
Acknowledgements
No acknowledgement found.References
1. Williams, K. A., Deber, C. M. & Klrschner, O. A. The Structure and Function of Central Nervous System Myelin. Crit. Rev. Clin. Lab. Sci. 30, 29–64 (1993).
2. O’Brien, J. S., Sampson, E. L. & Angeles, L. Lipid composition of the normal human brain: gray matter, white matter, and myelin”. J. Lipid Res. 6, 537–544 (1965).
3. Betsholtz, C. Lipid transport and human brain development. Nat. Genet. 47, 699–701 (2015).
4. Van Meer, G., Voelker, D. R. & Feigenson, G. W. Membrane lipids: Where they are and how they behave. Nature Reviews Molecular Cell Biology 9, 112–124 (2008).
5. Shaharabani, R. et al. Structural Transition in Myelin Membrane as Initiator of Multiple Sclerosis. J. Am. Chem. Soc. 138, 12159–12165 (2016).
6. Min, Y. et al. Interaction forces and adhesion of supported myelin lipid bilayers modulated by myelin basic protein. Proc. Natl. Acad. Sci. U. S. A. 106, 3154–3159 (2009).
7. Lee, J. et al. In-vivo histology of iron and myelin in the brain using magnetic susceptibility source separation in MRI Hyeong-Geol Shin Republic of Korea 20. bioRxiv 2020.11.07.363796 (2020).
8. Stüber, C. et al. Myelin and iron concentration in the human brain: A quantitative study of MRI contrast. Neuroimage 93, 95–106 (2014).
9. Möller, H. E. et al. Iron, Myelin, and the Brain: Neuroimaging Meets Neurobiology. Trends in Neurosciences 42, 384–401 (2019).
10. Abbaspour, N., Hurrell, R. & Kelishadi, R. Review on iron and its importance for human health. Journal of Research in Medical Sciences 19, 164–174 (2014).
11. Langkammer, C. et al. Quantitative MR imaging of brain iron: A postmortem validation study. Radiology 257, 455–462 (2010).
12. Haacke, E. M. et al. Imaging iron stores in the brain using magnetic resonance imaging. Magn. Reson. Imaging 23, 1–25 (2005).
13. Todorich, B., Pasquini, J. M., Garcia, C. I., Paez, P. M. & Connor, J. R. Oligodendrocytes and myelination: The role of iron. GLIA 57, 467–478 (2009).
14. Connor, J. R., Snyder, B. S., Beard, J. L., Fine, R. E. & Mufson, E. J. Regional distribution of iron and iron‐regulatory proteins in the brain in aging and Alzheimer’s disease. J. Neurosci. Res. 31, 327–335 (1992).
15. Lorio, S. et al. Disentangling in vivo the effects of iron content and atrophy on the ageing human brain. Neuroimage 103, 280–289 (2014).
16. Loeffler, D. A. et al. Transferrin and Iron in Normal, Alzheimer’s Disease, and Parkinson’s Disease Brain Regions. J. Neurochem. 65, 710–716 (1995).
17. Shtangel, O. & Mezer, A. A. A phantom system for assessing the effects of membrane lipids on water proton relaxation. NMR Biomed. 33, (2020).
18. Filo, S. et al. Disentangling molecular alterations from water-content changes in the aging human brain using quantitative MRI. Nat. Commun. 10, 3403 (2019).
19. Cercignani, Mara, Dowell, G. Nicholas, Tofts, S. Paul. Quantitative MRI of the brain: Principles of physical measurement. (CRC Press, 2018).
20. Whittall, K. P. et al. In vivo measurement of T2 distributions and water contents in normal human brain. Magn. Reson. Med. 37, 34–43 (1997).
21. Helms, G., Draganski, B., Frackowiak, R., Ashburner, J. & Weiskopf, N. Improved segmentation of deep brain grey matter structures using magnetization transfer (MT) parameter maps. Neuroimage 47, 194–198 (2009).
22. Callaghan, M. F., Helms, G., Lutti, A., Mohammadi, S. & Weiskopf, N. A general linear relaxometry model of R 1 using imaging data. Magn. Reson. Med. 73, 1309–1314 (2015).
23. Mezer, A. et al. Quantifying the local tissue volume and composition in individual brains with magnetic resonance imaging. Nat. Med. 19, 1667–1672 (2013).
24. Dawson, G. Measuring brain lipids. Biochimica et Biophysica Acta - Molecular and Cell Biology of Lipids 1851, 1026–1039 (2015).
25. Ben-Eliezer, N., Sodickson, D. K. & Block, K. T. Rapid and accurate T2 mapping from multi-spin-echo data using bloch-simulation-based reconstruction. Magn. Reson. Med. 73, 809–817 (2015).
26. Weiskopf, N. et al. Quantitative multi-parameter mapping of R1, PD*, MT, and R2* at 3T: A multi-center validation. Front. Neurosci. 7, (2013).
Figures