3123
Characterization of 3AM diffusion MRI phantoms via microscopy, and phase-contrast micro-CT
Farah Mushtaha1,2, Tristan K. Kuehn1,3, Omar El-Deeb4, Seyed A. Rohani3, Luke W. Helpard3, Hanif Ladak2,3,5, Amanda Moehring6, Corey A. Baron1,2,3,7, and Ali R. Khan1,2,3,7
1Robarts Research Institute, London, ON, Canada, 2Medical Biophysics, Schulich School of Medicine and Dentistry, Western University, London, ON, Canada, 3School of Biomedical Engineering, Western University, London, ON, Canada, 4Neuroscience, Western University, London, ON, Canada, 5Department of Electrical and Computer Engineering, Western University, London, ON, Canada, 6Biology, Western University, London, ON, Canada, 7The Brain and Mind Institute, Western University, London, ON, Canada
1Robarts Research Institute, London, ON, Canada, 2Medical Biophysics, Schulich School of Medicine and Dentistry, Western University, London, ON, Canada, 3School of Biomedical Engineering, Western University, London, ON, Canada, 4Neuroscience, Western University, London, ON, Canada, 5Department of Electrical and Computer Engineering, Western University, London, ON, Canada, 6Biology, Western University, London, ON, Canada, 7The Brain and Mind Institute, Western University, London, ON, Canada
Synopsis
Validating diffusion MRI (dMRI) representations and models of brain tissue is challenging because there is no reference ground-truth for in vivo scans. We investigate the microstructural characteristics of 3D printed axon-mimetic (3AM) phantoms as a dMRI validation tool using fluorescence microscopy and phase-contrast micro computed tomography (micro-CT). Both microscopy and micro-CT yielded pore diameters of ~ 8 μm. We constructed a 2-compartment microstructural model using microscopy and micro-CT data to simulate 3AM dMRI scans, and compared the observed metrics from in-vivo scans and simulation data.
Introduction
Diffusion MRI (dMRI) is a promising imaging method to quantify histological features of the brain at a micrometre scale1 . However, there is no “ground truth” to validate it. 3D printed axon-mimetic phantoms (3AM) possess anisotropic microstructure that can mimic diffusion characteristics of axons2. In this study, we use microscopy, and phase-contrast micro computed tomography (micro-CT), to characterize 3AM phantom’s microstructure. Moreover, we construct an microstructural model of diffusion in 3AM phantoms based on confocal microscopy and micro-CT, to validate the diffusion characteristics of 3AM phantoms via both diffusion kurtosis imaging (DKI) and the ball and stick model.Methods
Four 3AM phantoms were prepared using the procedure available at osf.io/zrsp6. dMRI was implemented at 9.4 T using a single-shot EPI sequence with: 120, 60 and 20 directions at b=2000, 1000, and 0 s/mm2 , respectively, TE/TR=37/2500 ms, FOV=200x200 mm2, 0.7 mm isotropic in-plane resolution, one 3 mm axial slice per phantom (8.5 min scan time). DiPy3 was used to fit both diffusion kurtosis imaging (DKI)4, and ball and stick models to the data 5.Three 3AM phantoms were prepared for microscopy. The blocks were sliced into 50 μm slices, dyed with Rhodamine Beta, then mounted on positive microscope slides. Confocal microscopy was performed using a Leica SP5 laser system microscope with a 40X oil-immersion objective lens. Z-stacks of slides were acquired using 1.0 μm step size for axial ranges between 5-17 μm. Using MATLAB’s image processing toolbox, three averaged z-stack images were converted to grayscale, then segmented using adaptive thresholding 6. Equivalent pore diameters were calculated and fit to a gamma distribution for dMRI simulations.
An additional 3AM phantom was prepared for micro-CT. A propagation-based phase-contrast micro-CT scan was performed in air at the Biomedical Imaging and Therapy beamline (05ID-2) at the Canadian Light Source Inc. (Saskatoon, Canada), using an energy of 30 keV, 3000 projections over 180°, 150 ms exposure time and 700 ms time per projection, total scan time of 1 hour, FOV=4096 × 4096 × 3456 μm3 (L × W × H), and an effective isotropic pixel size of 1.65 μm. The micro-CT volume was segmented into 2D images, which were segmented using adaptive thresholding 6 to calculate the equivalent pore diameter.
Camino7 was used to construct a two-compartment diffusion model: a free water compartment with a volume fraction estimated from the volume fraction of free water in the micro-CT volume, and a compartment composed of spins within parallel cylinders with radii distributed using the gamma distribution from microscopy. The simulation used the diffusivity of free water at room temperature (2.1 ×10⁻³ mm2/s). We simulated a dMRI scan of our analytic model using the experimental scan parameters for the phantoms and fit both DKI and ball and stick models to the simulated signal using DiPy.
Results
Confocal microscopy images revealed two types of pores in 3AM phantoms: larger pores (70-150 μm) that are caused by tears during slides’ preparation, or gaps being left between lines of material (Figure 1), and smaller axon-mimetic pores (1-30 μm) (Figure 2). The segmented pores from three averaged z-stack confocal microscopy images had a mean equivalent diameter of 7.57 μm, a median equivalent diameter of 3.51 μm, and a standard deviation of 12.13 μm (Figure 2).Micro-CT image showed anisotropic pores that are parallel to the printing direction of the phantoms (Figure 3), supporting the findings of the confocal microscopy. These pores had typical lengths in the hundreds of microns. The segmented pores from one x-z slice of the micro-CT volume had a mean equivalent diameter of 8.69 μm, a median equivalent diameter of 5.71 μm, and a standard deviation of 20.40 μm (Figure 4).
From the micro-CT volume, we estimated a 34% volume fraction of free water in the phantom for the microstructural model used in simulations. Maximum likelihood fit of the gamma distribution to equivalent pore diameters from the microscopy images yielded the shape parameter a=1.18 and the scale parameter b=6.39 μm.Fitting DKI to the simulated signal yielded a radial diffusivity of 0.944 ×10⁻³ mm2/s and radial kurtosis of 1.19, which is nearly identical to the experimentally observed values of 1.01 ×10⁻³ mm2/s, and 1.13 from the dMRI scan2, respectively. Ball and stick volumes from the simulation were 32%, and 68%, respectively, compared to 29.1% and 70.9%, respectively from the dMRI scan (Table.1).
Discussion and Conclusion
Microscopy images and synchrotron micro-CT images showed densely packed fibrous pores in 3AM phantoms. The close correspondence between simulated and measured parameters for both DKI and ball and stick model fits suggests that the microscopy and micro-CT images resolve most of the phantoms’ pores, and that the pores are approximated well as a gamma distribution of straight cylinders. The somewhat unexpected large “ball” volume percentage suggests that many of the large diameter pores were classified as “balls” rather than “sticks”. Future work will investigate whether increasing the diffusion time alters this behaviour.Acknowledgements
This work was supported by the Canada First Research Excellence Fund, Brain Canada, and Discovery Grants from the Natural Sciences and Engineering Research Council (NSERC). Part of the research described in this paper was conducted at the BioMedical Imaging and Therapy (BMIT) facility at the Canadian Light Source Inc. (CLSI), which is funded by the Canada Foundation for Innovation, the Natural Sciences and Engineering Research Council of Canada, the National Research Council Canada, the Canadian Institutes of Health Research, the Government of Saskatchewan, Western Economic Diversification Canada, and the University of Saskatchewan.References
- Alexander D.C, Dyrby T.B, Nilsson M, and Zhang H. Imaging brain microstructure with diffusion MRI: practicality and applications. NMR in Biomedicine. 2017;e3841. doi:10.1002/nbm.3841.
- Mushtaha F.N, Kuehn TK, et al. OHBM Annual Meeting. 2020, 3516.
- Garyfallidis E, Brett M, Amirbekian B, et al. Dipy, a library for the analysis of diffusion MRI data. Front. Neuroinform. 2014;8:8.
- Lu H, Jensen JH, Ramani A, Helpern JA. Three-dimensional characterization of non-gaussian water diffusion in humans using diffusion kurtosis imaging. NMR in Biomedicine 2006;19:236–247 doi: 10.1002/nbm.1020.
- Behrens TEJ, Woolrich MW, Jenkinson M, et al. Characterization and propagation of uncertainty in diffusion-weighted MR imaging. Magnetic Resonance in Medicine: An Official Journal of the International Society for Magnetic Resonance in Medicine 2003;50:1077–1088.
- Bradley D, Roth G. Adaptive Thresholding using the Integral Image. Journal of Graphics Tools 2007;12:13–21.
- Cook PA, Bai Y, Nedjati-Gilani S, et al. Camino: open-source diffusion-MRI reconstruction and processing. In: 14th scientific meeting of the international society for magnetic resonance in medicine. Vol. 2759. Seattle WA, USA; 2006. p. 2759.
Figures
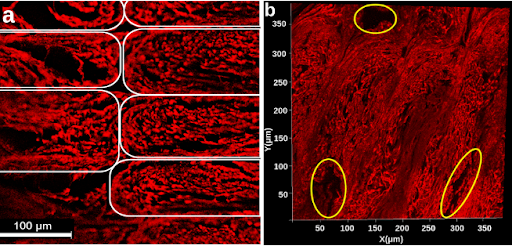
Figure 1. a) Confocal microscopy z-stack image of a stained phantom slide. Elastomeric matrix (red) and pores (black) are visible. Each white outline indicates an individual line of material. b) 2D projection of a 3D microscopy volume acquired with confocal microscopy. Outlined in yellow are larger pores caused by the printing pattern of the phantom. In both a and b, the image plane is perpendicular to the long axis of the pores.
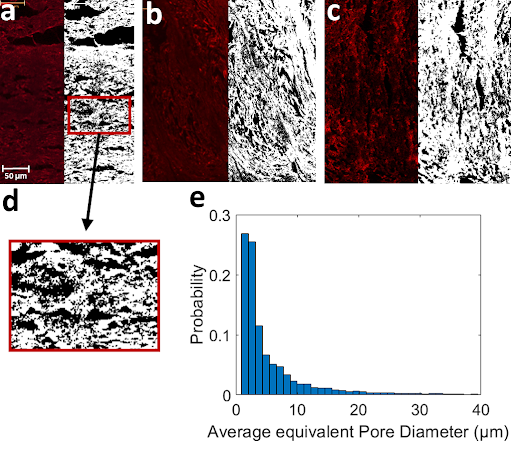
Figure 2. Pictures a-c, Confocal microscopy image before (left) and after (right) performing pore segmentation. Segmented pores are shown in black. d) zoomed in picture of segmented pores on a. e) Normalized histogram of pore equivalent diameters from the three segmentations in a-c (Total N = 10762).
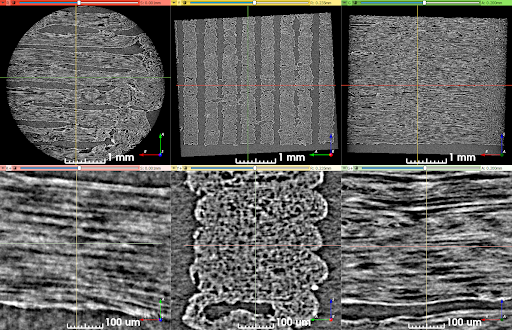
Figure 3. Synchrotron micro-CT scan data at two zoom levels, transformed to align lines of material with the viewing planes. Upper row: View of the entire scan ROI. Lower row: Detailed view of a short length of five stacked lines of material. The direction of print-head motion was left-right in the left- and right-most columns, and perpendicular to the image in the center column.
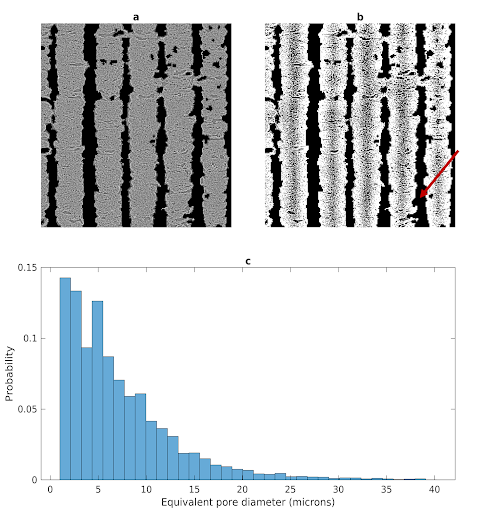
Figure 4. Segmentation of pores in a micro-CT slice. a) Preprocessed micro-CT slice with air-filled regions masked out. b) Segmentation results with pores shown in black. The red arrow identifies the gap between printed lines of pore-containing material c) Histogram of pore equivalent diameters.
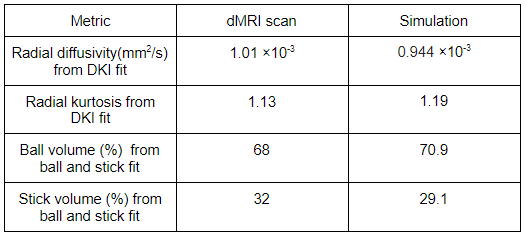
Table 1. Comparison between obtained metrics from dMRI scan and simulation