3104
D-T2 Distribution Obtained Using CPMG-only Sequence Compared with Traditional SE-CPMG Sequence on the Single-sided NMR Device1Center for Biomedical Imaging Research, Department of Biomedical Engineering, School of Medicine, Tsinghua University, Beijing, China, 2Marvel Stone Healthcare, Wuxi, Jiangsu, China
Synopsis
Two-dimension (2D) diffusion-relaxation (D-T2) correlation measured by a low-cost, portable single-sided NMR system can separate fat and water in biological tissues (for example for liver steatosis detection). Diffusion-editing CPMG sequence is commonly used for such measurement. Recently, a novel approach is proposed to measure the D-T2 correlation using the simplest CPMG-only sequence. The CPMG-only sequence is less sensitive to motion, and can extend to systems with more imperfect magnetic and radiofrequency fields. This work compares the proposed CPMG-only sequence with the traditional diffusion-editing SE-CPMG sequence. Results show the SE-CPMG and CPMG-only sequences can achieve comparable performance on water-fat separation.
Introduction
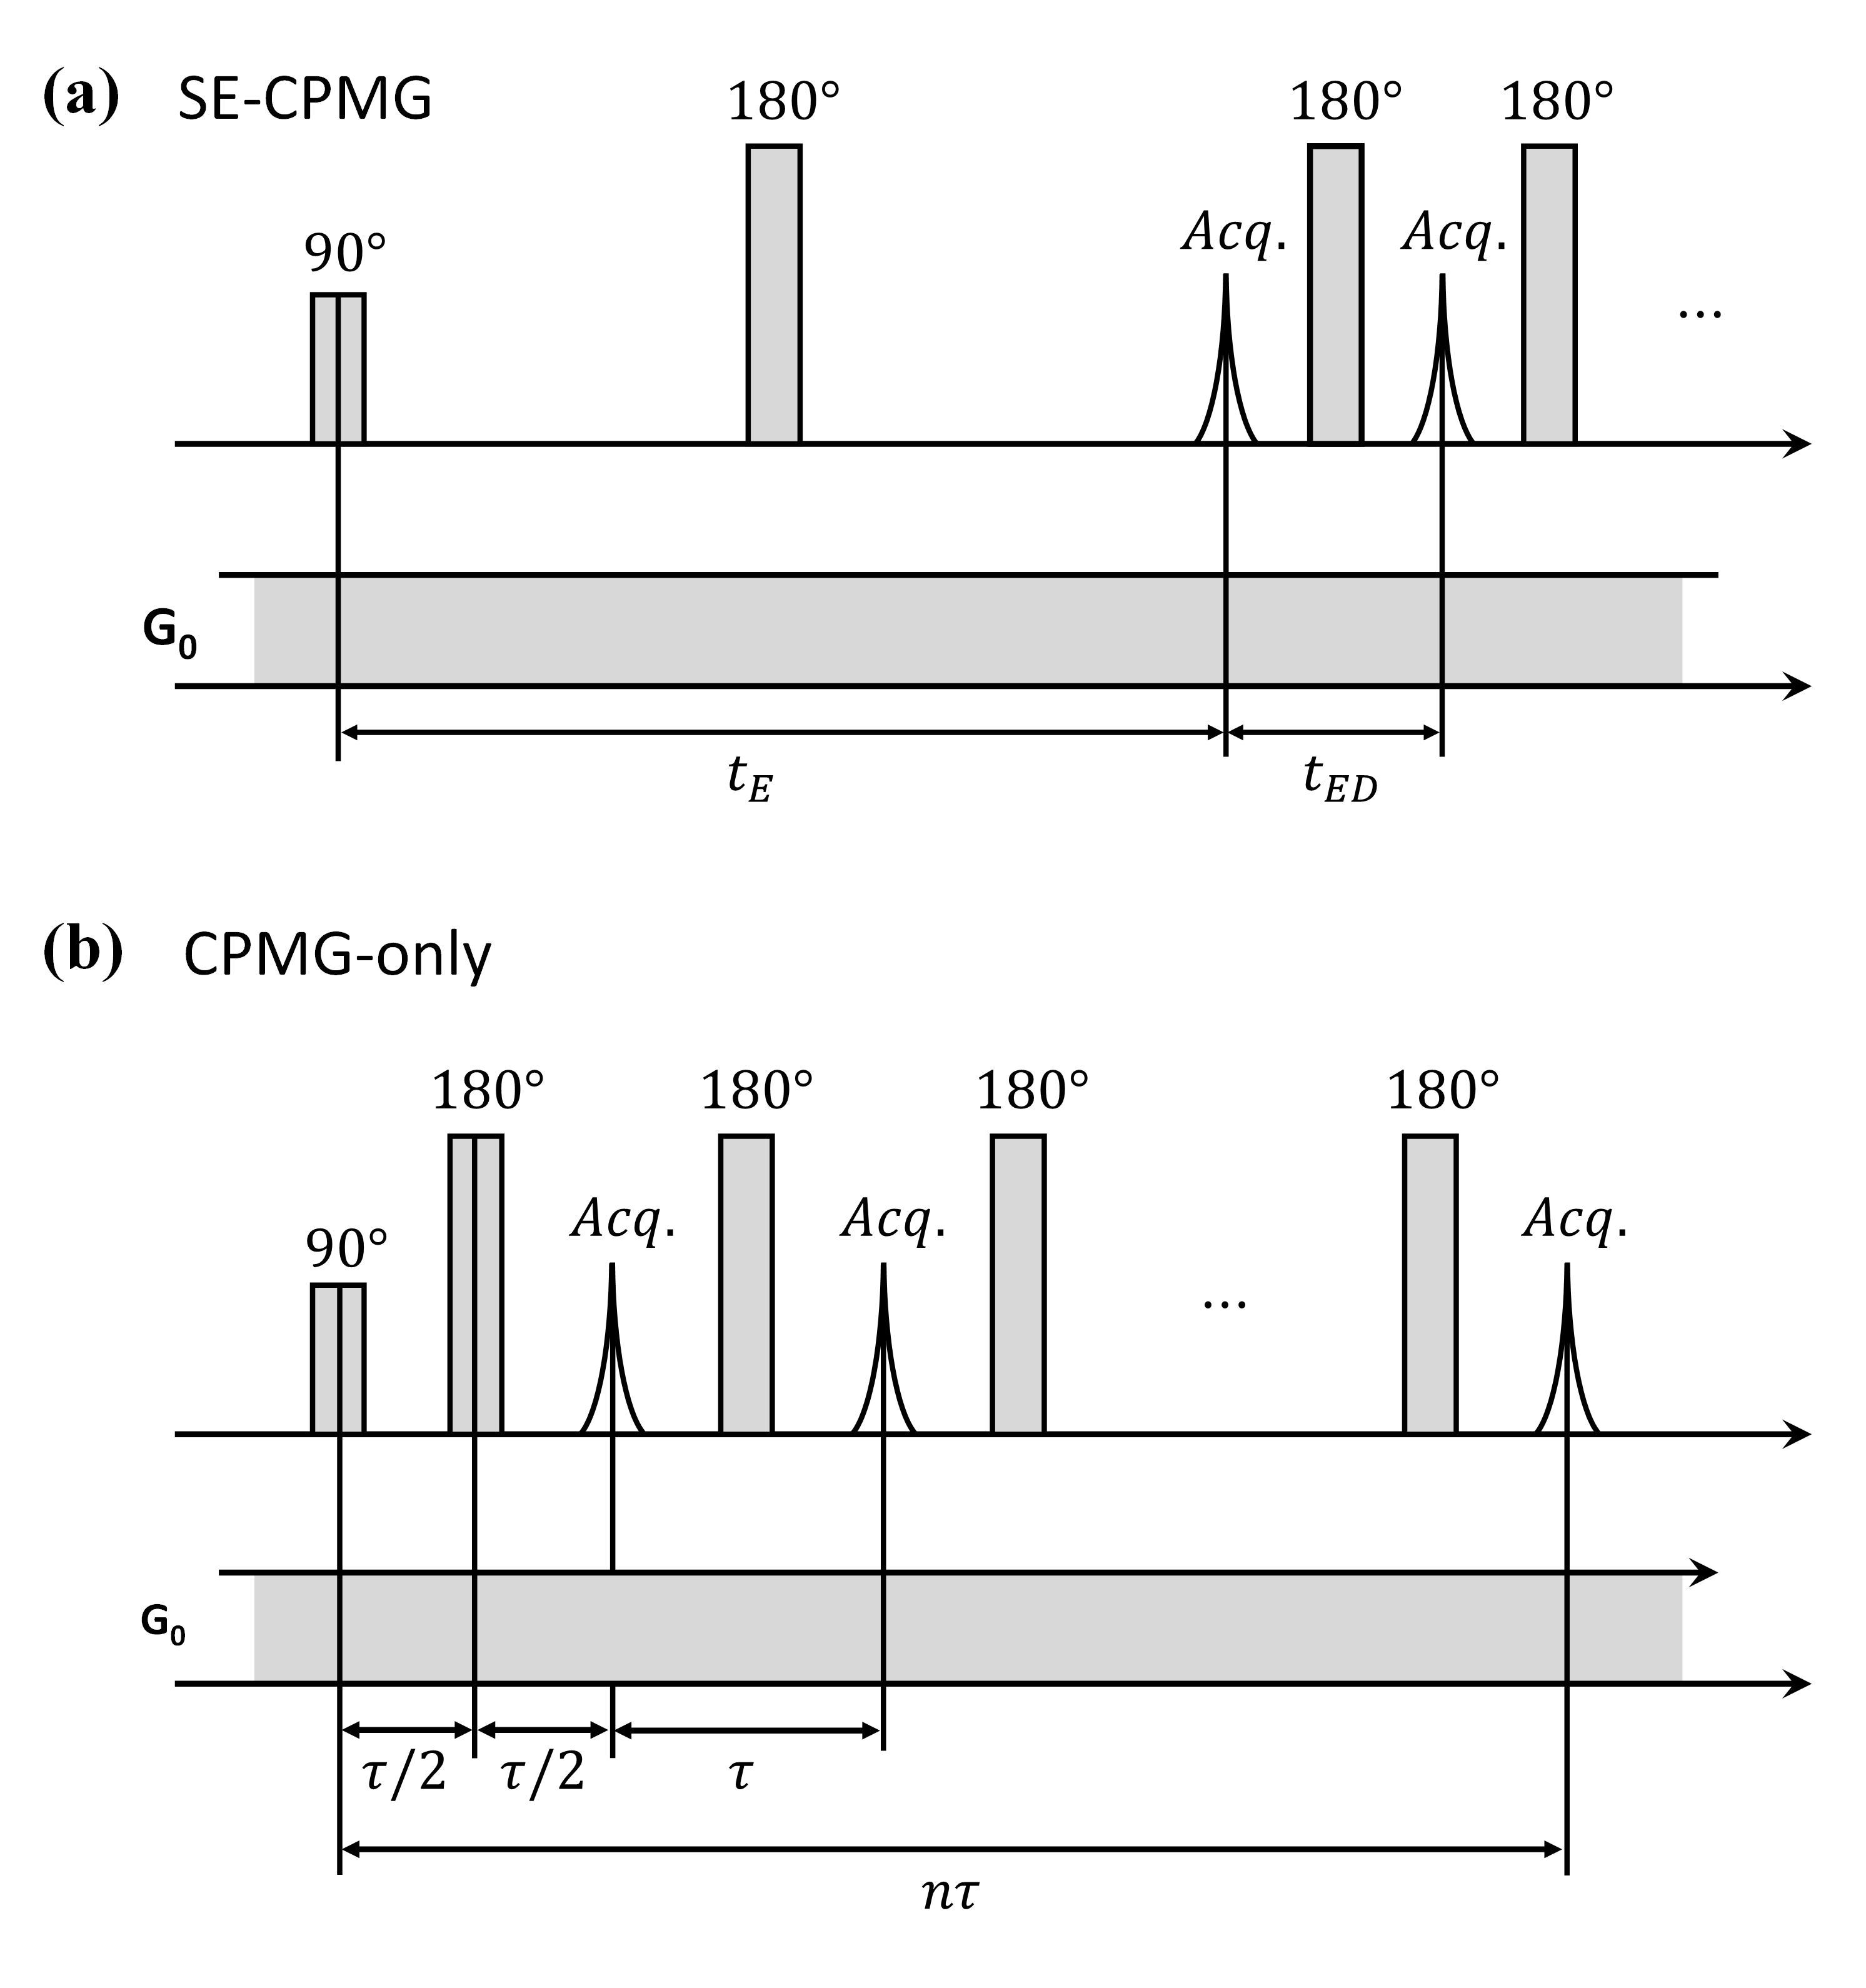
In single-sided NMR devices, reliable diffusion-relaxation (D-T2) correlation measurement has become an important technique for the identification and clean separation of different components in heterogeneous tissues 1,2, providing new opportunities for applications such as detection of liver steatosis 3.In D-T2 measurements, diffusion-editing CPMG (Carr-Purcell-Meiboom-Gill) sequence 4-6 is commonly used. It consists of a preparation sequence (a spin-echo pulse pair in SE-CPMG 5, as shown in Fig. 1a) that encodes diffusion, followed by a long train of refocusing pulses (CPMG 7) that encodes relaxation. Recently, a new approach using the CPMG-only sequence for D-T2 measurement is proposed (detailed in another abstract by our group). As shown in Fig. 1b, the diffusion-editing preparation is omitted. The CPMG-only sequence is less sensitive to motion and can extend to systems with more imperfect magnetic and radiofrequency (RF) fields.
In this work, we validated the CPMG-only sequence by comparing it with the traditional SE-CPMG. The obtained D-T2 results of different fluid samples (peanut oil, 0.5mmol/L MnCl2 solution and their combination) were presented and discussed. A T2 correction algorithm was also demonstrated which reduced the effect of self-diffusion during T2 measurement for SE-CPMG.
Theory and Methods
Diffusion Encoding of the SE-CPMG and CPMG-only SequencesThe CPMG train is typically used to measure the transverse relaxation time T2. Due to the presence of the static gradient in single-sided NMR, the echo time should be short enough to reduce the influence of molecular self-diffusion during T2 measurement 5. However, in the CPMG-only sequence, we just make use of the diffusion effect during the CPMG train. Both diffusion and relaxation are encoded by the CPMG echo time τ , and the characteristic time decay of the echoes is 7
$$ S\left(n\tau\right)=Aexp\left(-\frac{1}{T_{2}}\cdot n\tau-\frac{\gamma^{2}G_{0}^{2}\cdot n\tau^{3}}{12}\cdot D\right) $$
On the other hand, for the conventional SE-CPMG sequence, diffusion is considered only encoded by the SE echo time tE when the CPMG echo time tED is short enough
$$ S\left(nt_{ED}\right)=Aexp\left(-\frac{1}{T_{2}}\cdot nt_{ED}-\frac{\gamma^{2}G_{0}^{2}\cdot t_{E}^{3}}{12}\cdot D\right) $$
T2 Correction for the SE-CPMG Sequence
In the SE-CPMG sequence with a strong static gradient strength, or for tissues with high diffusion coefficients, self-diffusion during the CPMG readout should not be neglected. The measured T2 value is in fact shortened by a third term in the following equation:
$$S\left(nt_{ED}\right)=Aexp\left(-\frac{1}{T_{2}}\cdot nt_{ED}-\frac{\gamma^{2}G_{0}^{2}\cdot t_{E}^{3}}{12}\cdot D-\frac{\gamma^{2}G_{0}^{2}\cdot t_{ED}^{2}}{12}\cdot nt_{ED} \cdot D\right)$$
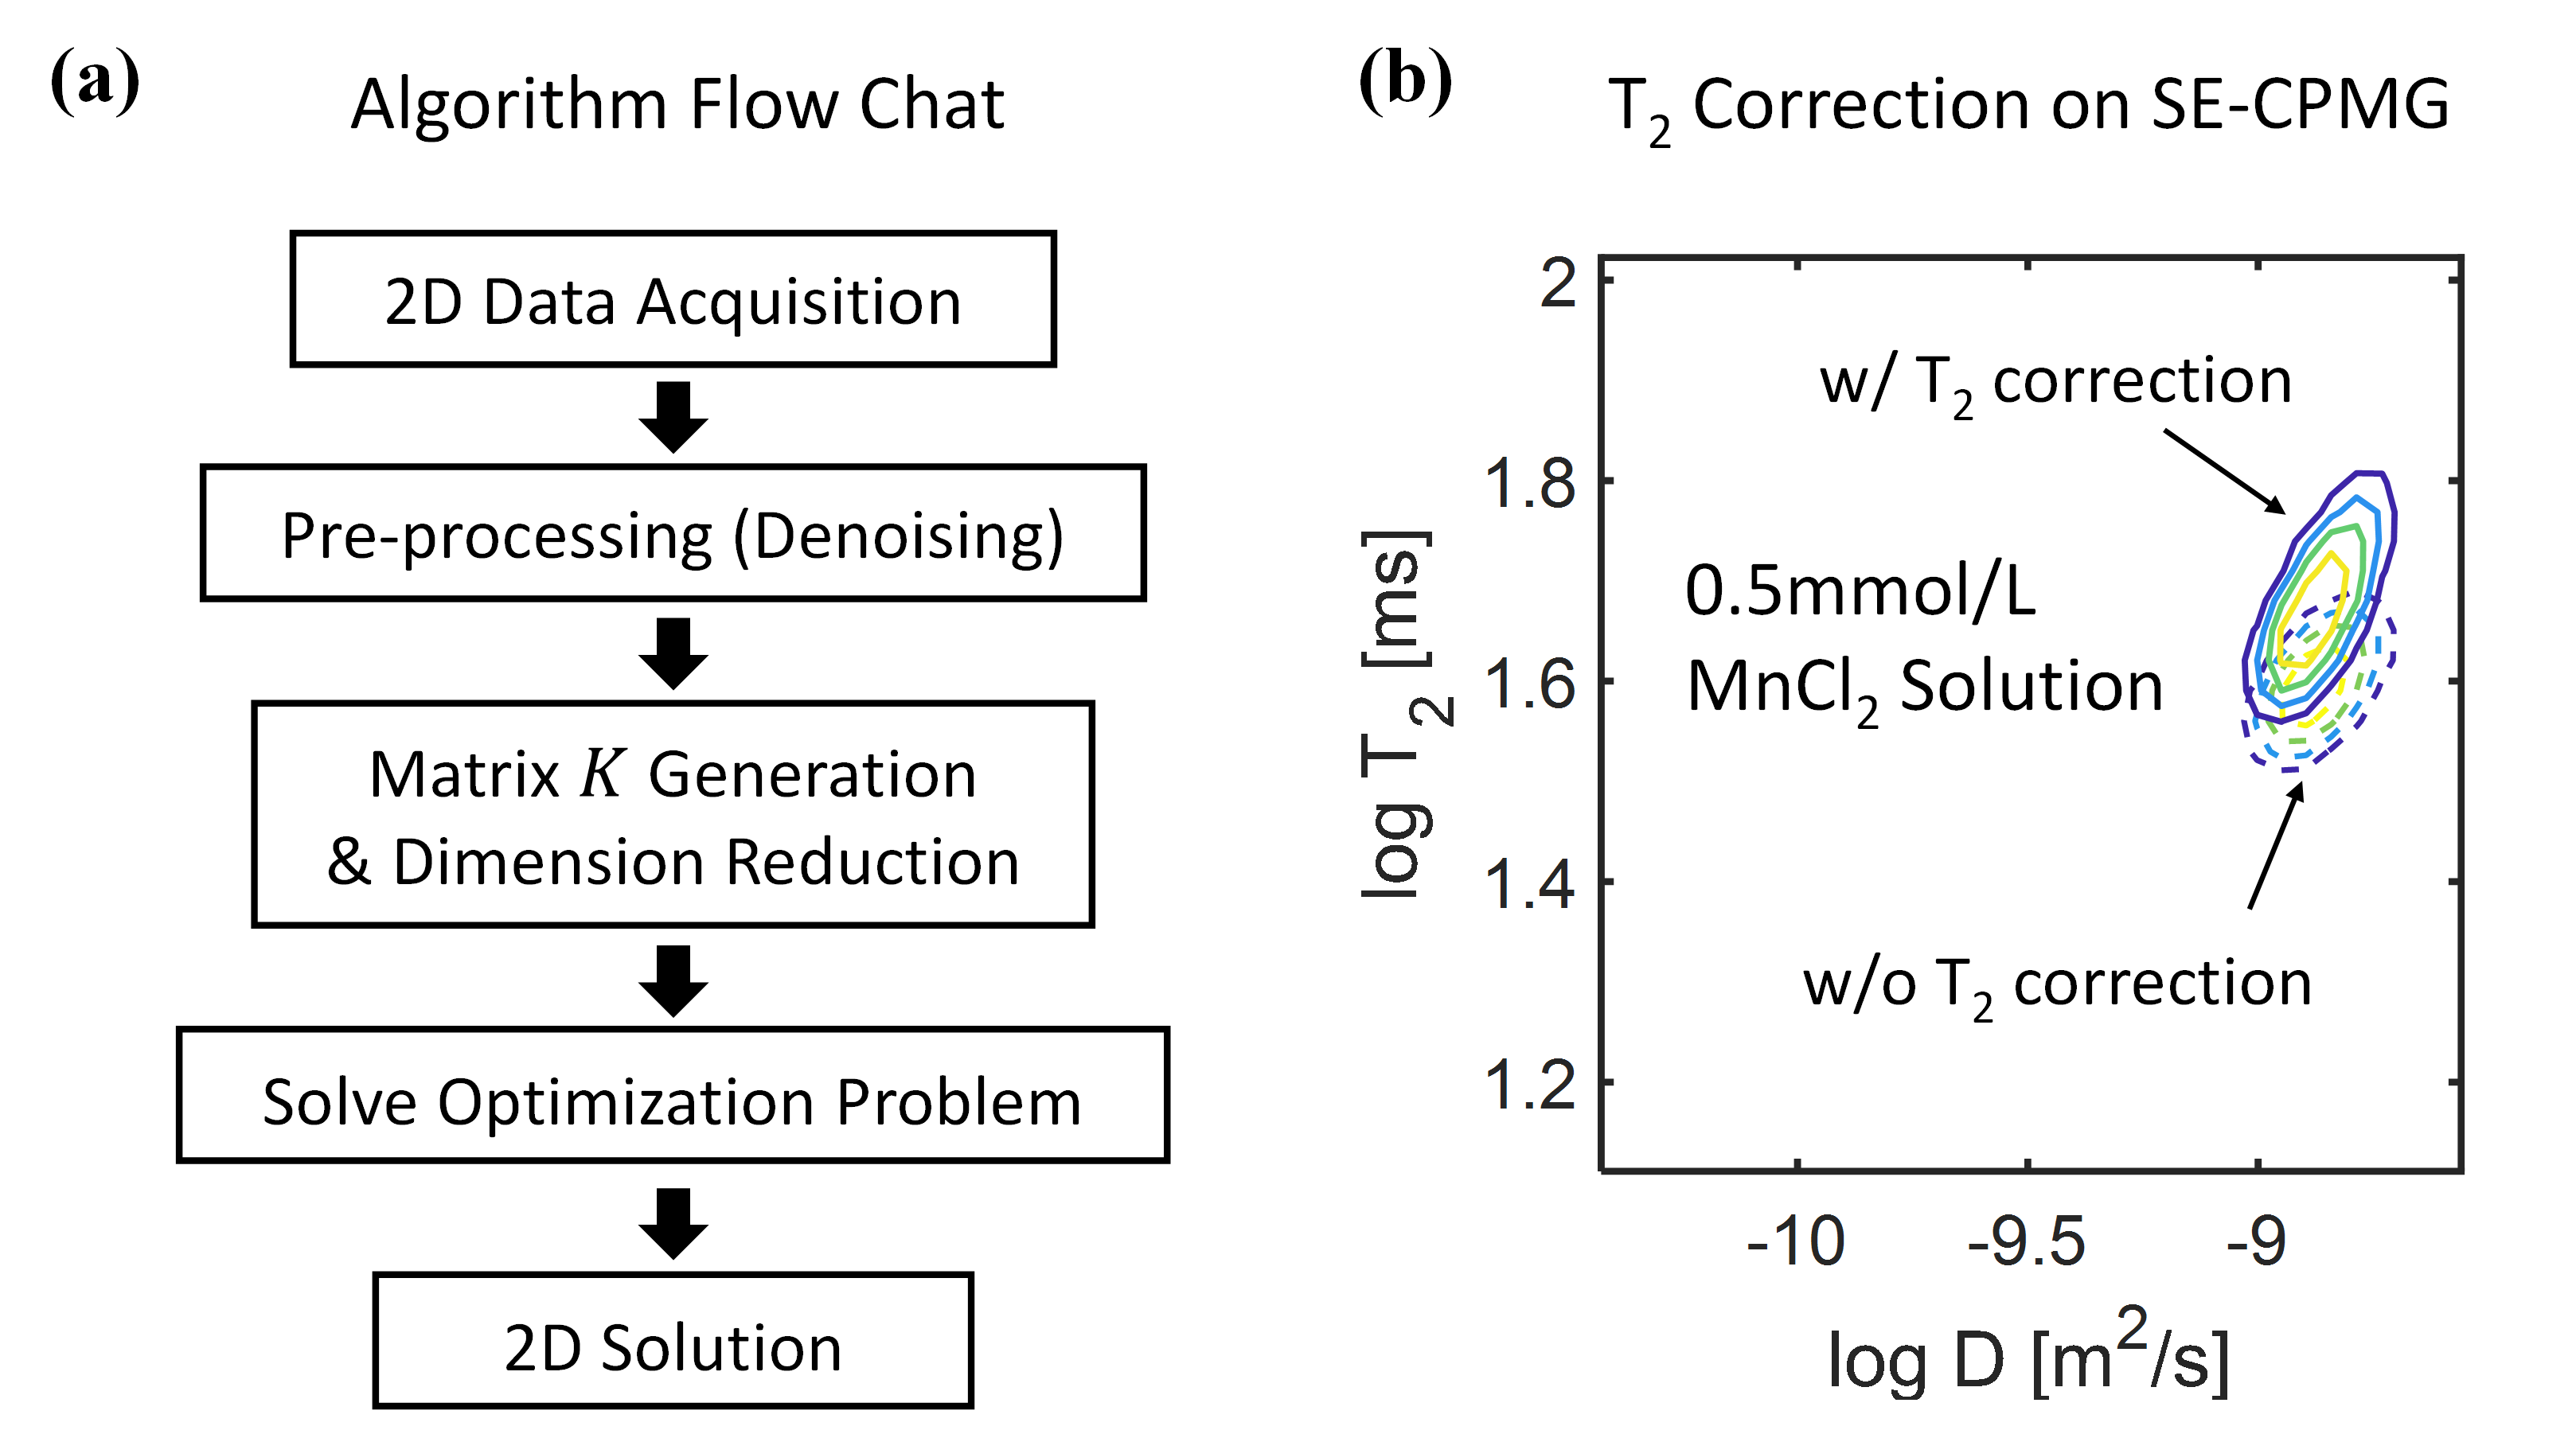
So a T2 correction algorithm is proposed for more accurate D-T2 measurement in SE-CPMG. The algorithm applied to the calculated D-T2 map is expressed as
$$ \frac{1}{T_{2_{corr}}}=\frac{1}{T_{2}}-\frac{(\gamma G_{0}t_{ED})^{2}\cdot D}{12} $$
Materials and Methods
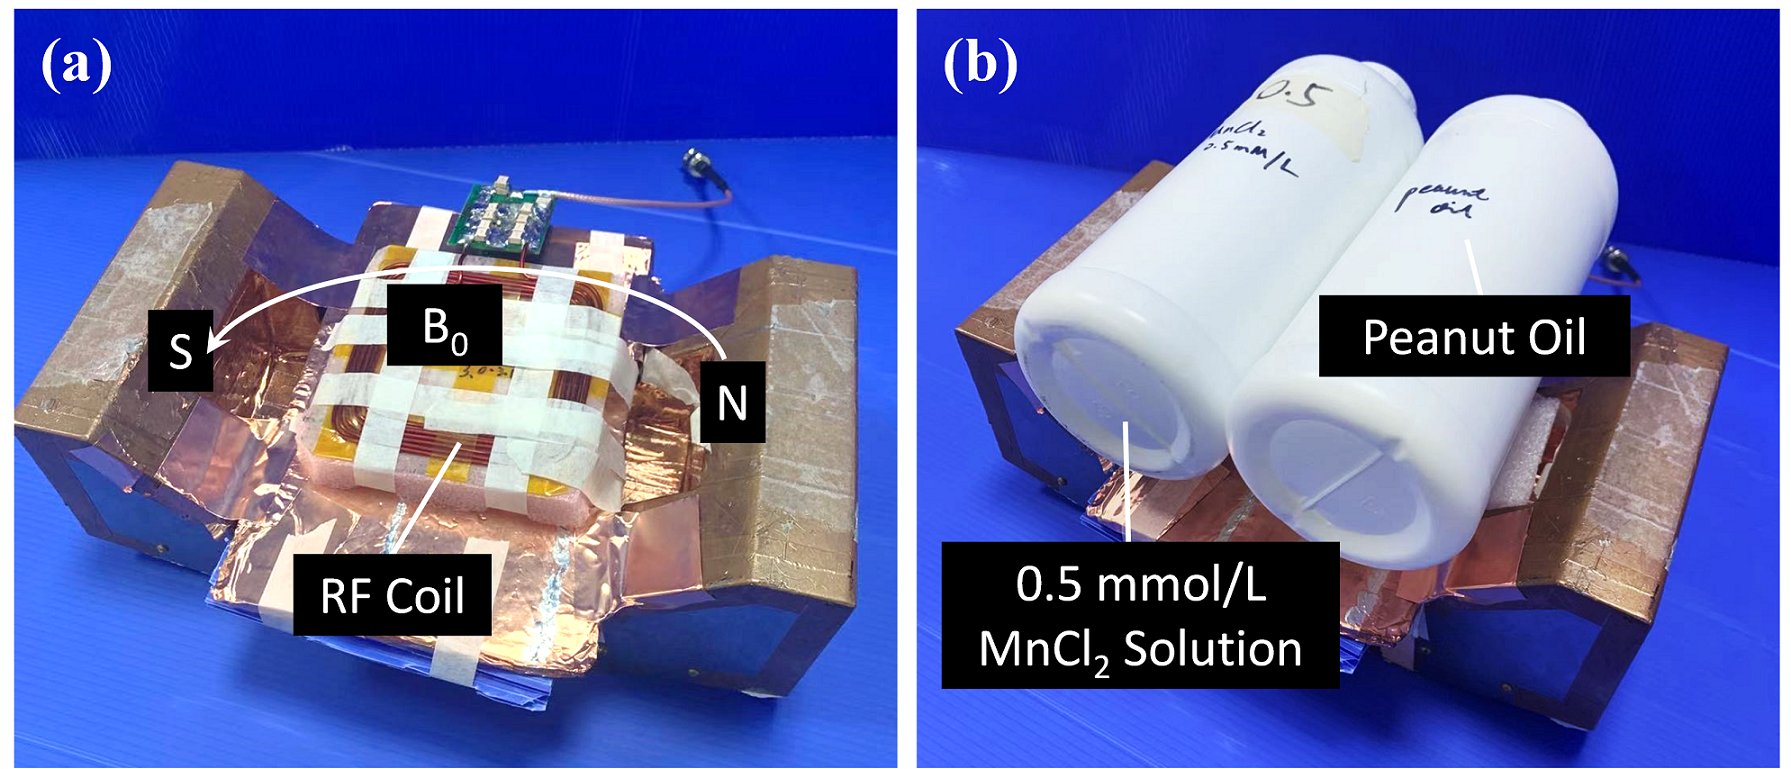
The experiments were performed using a specifically designed single-sided NMR device for detection of liver steatosis (Marvel Stone Healthcare, Wuxi, Jiangsu, China) as shown in Fig. 2. The mean strength of the magnetic field was 0.07 T, and the static gradient was 110 Gauss/cm.
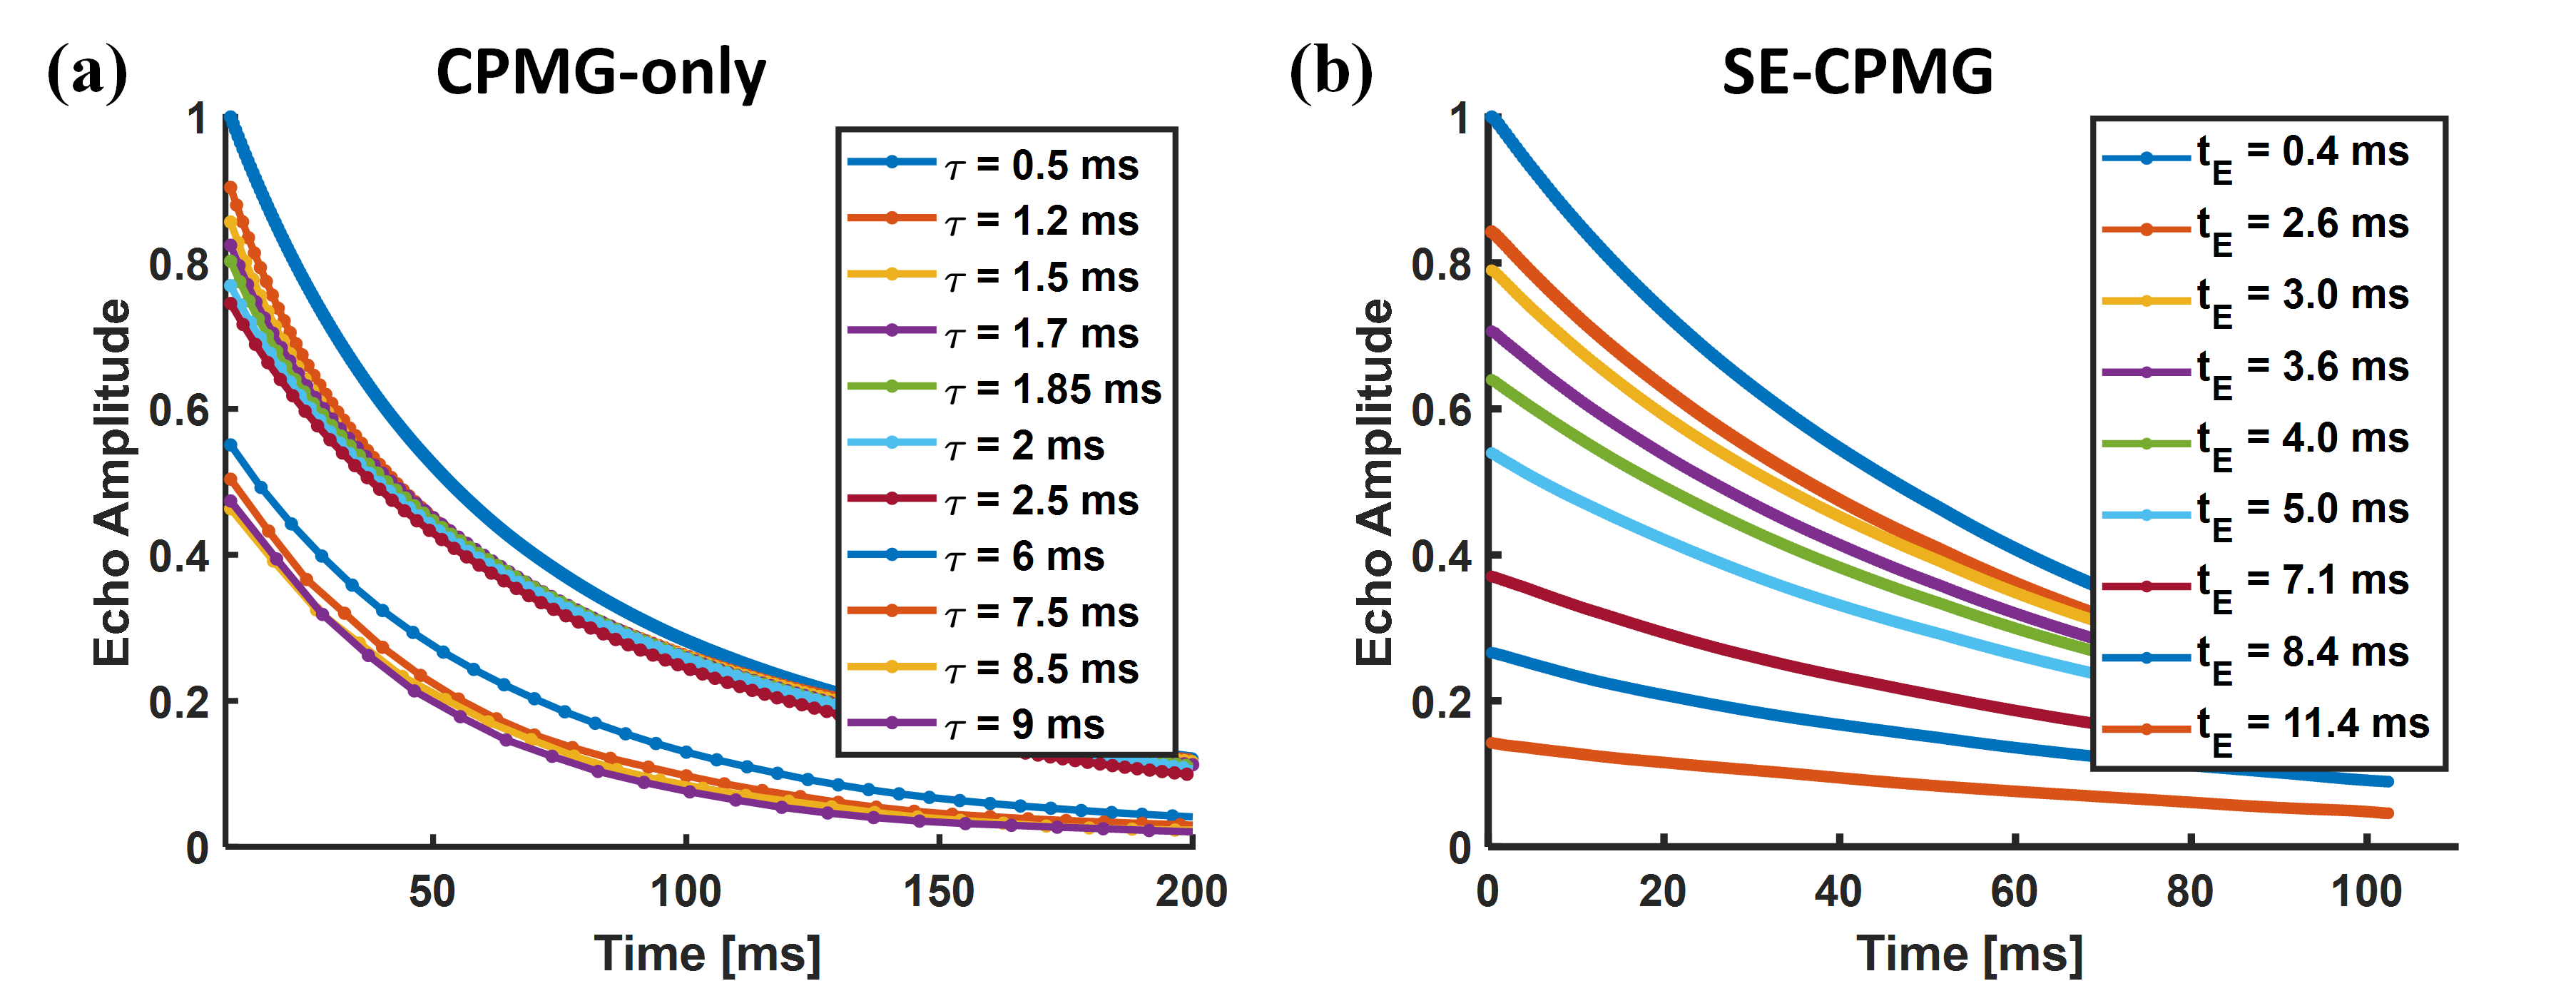
Aqueous MnCl2 solution and commercial peanut oil were used in the experiments. TR (Repetition Time) was 1000ms and NSA (Number of Signal Averages) was 64 for both sequences. Fig. 3 showed the characteristics of the averaged signals measured from the two fluids (MnCl2 solution and peanut oil) by the two sequences. The echo time τ (11 sets of τ for CPMG-only) and tE (9 sets of tE for SE-CPMG, tED=0.2ms) both covered a large scale so as to encode diffusion for either water (short echo time for high D value) or fat (long echo time for low D value).
To obtain the D-T2 distribution functions, the inversion of the measured 2D NMR data was translated into an optimization problem 8, and L2 regularization was implemented. The data processing procedure for the SE-CPMG and CPMG-only sequences was identical and illustrated in flow chat (Fig. 4a). More details were explained in another abstract.
Results
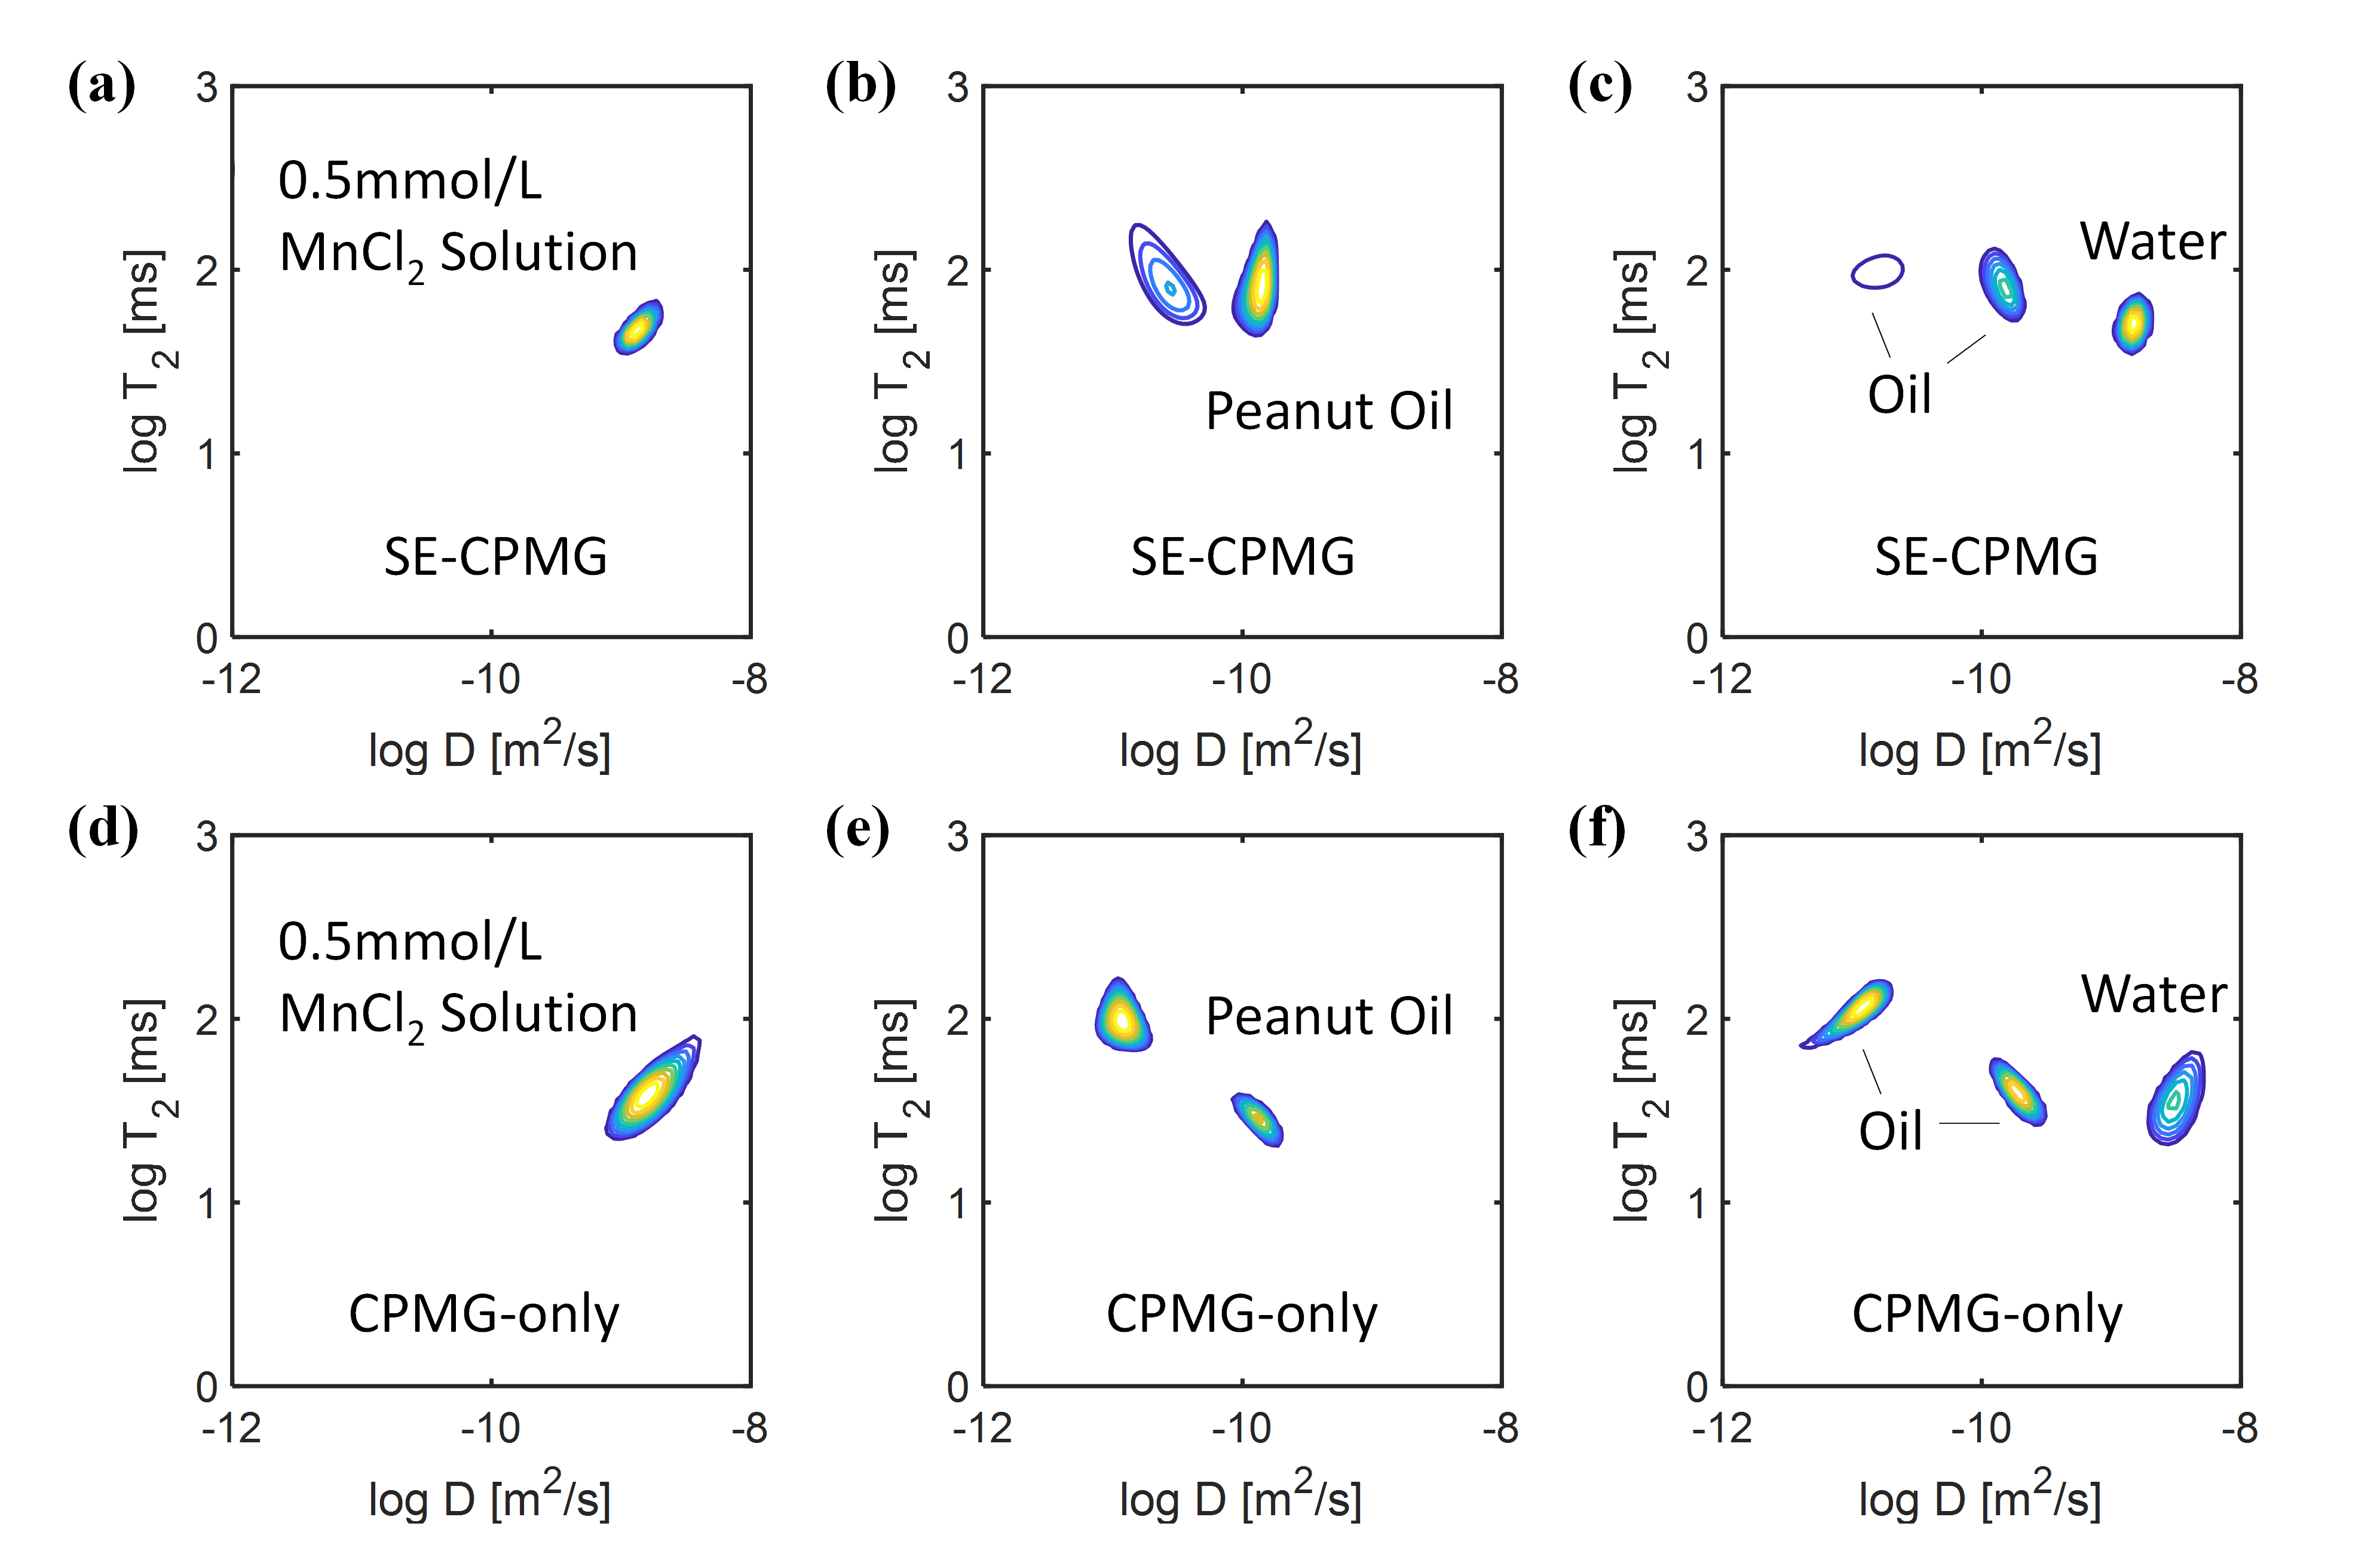
Fig. 5 shows the D-T2 correlation maps acquired by the SE-CPMG (top row) and CPMG-only (bottom row) sequences, including results of the 0.5mmol/L MnCl2 solution (a, d), the peanut oil (b, e), and their combination (c, f).The two sequences present identical D-T2 distributions of the 0.5mmol/L MnCl2 solution, while show differences on the D-T2 maps of the peanut oil, especially on the peak values. Despite the differences, both methods reveal the existence of the three main peaks of the two fluids, and the peak positions are close to the results of their single-fluid (peanut oil or MnCl2 solution) experiments.
Discussion
The difference in the D-T2 distribution between the two sequences is possibly introduced by the inconsistent positioning of the bottles in the experiments. Besides, it may result from the different encoding patterns of the two sequences. CPMG-only provides a more flexible encoding pattern, with the varying parameters n and τ.We will conduct in-vivo (human liver) experiments in the future to evaluate the two sequences under respiratory movement. The CPMG-only sequence is less sensitive to motion because different b-values (encoded by nτ3) are added within the train. On the other hand, motion between the different b-values of the multiple tEs in SE-CPMG may influence the measuring accuracy.
Conclusion
In conclusion, the CPMG-only sequence provides an alternative approach for the D-T2 distribution measurement. It is easy to operate in the single-sided NMR device (for detection of liver steatosis) and can achieve comparable performance with the traditional SE-CPMG on water-fat separation.Acknowledgements
References
1. Hurlimann MD, Burcaw L, Song YQ. Quantitative characterization of food products by two-dimensional D-T2 and T1-T2 distribution functions in a static gradient. J Colloid Interface Sci 2006;297(1):303-311.
2. Mutina AR, Hurlimann MD. Correlation of transverse and rotational diffusion coefficient: a probe of chemical composition in hydrocarbon oils. J Phys Chem A 2008;112(15):3291-3301.
3. Bashyam A, Frangieh CJ, Li M, Cima MJ. Dehydration assessment via a portable, single sided magnetic resonance sensor. Magn Reson Med 2020;83(4):1390-1404.
4. English AE, Whittall KP, Joy ML, Henkelman RM. Quantitative two-dimensional time correlation relaxometry. Magn Reson Med 1991;22(2):425-434.
5. Hurlimann MD, Venkataramanan L. Quantitative measurement of two-dimensional distribution functions of diffusion and relaxation in grossly inhomogeneous fields. J Magn Reson 2002;157(1):31-42.
6. Stejskal EO, Tanner JE. Spin Diffusion Measurements: Spin Echoes in the Presence of a Time-Dependent Field Gradient. J Chem Phys 1965;42(1):288-+.
7. Meiboom S, Gill D. Modified Spin-Echo Method for Measuring Nuclear Relaxation Times. Rev Sci Instrum 1958;29(8):688-691.
8. Zhou XL, Su GQ, Wang LJ, Nie SD, Ge XM. The inversion of 2D NMR relaxometry data using L1 regularization. J Magn Reson 2017;275:46-54.
Figures