3094
Fast and quiet MPRAGE using a silent gradient axis at 7T – subject experience and qualitative image assessment
Sarah M Jacobs1, Edwin Versteeg1, Leonie NC Visser2, Anja G van der Kolk1,3, Dennis WJ Klomp1, and Jeroen CW Siero1,4
1Department of Radiology and Nuclear Medicine, University Medical Center Utrecht, Utrecht, Netherlands, 2Alzheimer Center Amsterdam, Department of Neurology, Amsterdam Neuroscience, Vrije Universiteit Amsterdam, Amsterdam UMC, Amsterdam, Netherlands, 3Department of Radiology, the Netherlands Cancer Institute, Amsterdam, Netherlands, 4Spinoza Centre for Neuroimaging Amsterdam, Amsterdam, Netherlands
1Department of Radiology and Nuclear Medicine, University Medical Center Utrecht, Utrecht, Netherlands, 2Alzheimer Center Amsterdam, Department of Neurology, Amsterdam Neuroscience, Vrije Universiteit Amsterdam, Amsterdam UMC, Amsterdam, Netherlands, 3Department of Radiology, the Netherlands Cancer Institute, Amsterdam, Netherlands, 4Spinoza Centre for Neuroimaging Amsterdam, Amsterdam, Netherlands
Synopsis
Acoustic noise can negatively impact patients from anxiety and communication problems to transient and permanent hearing loss. In this pilot study we used a silent gradient axis that is switched at the inaudible frequency of 20 kHz with a silent readout module implemented in an MPRAGE sequence, and investigated subject experience and image quality of fast and quiet anatomical brain imaging at 7T. Here we show preliminary evidence that our silent gradient axis with silent readout module incorporated into a T1-weighted MPRAGE sequence is perceived more quiet and positive and delivers images of largely acceptable quality.
Introduction
Magnetic Resonance Imaging (MRI) examinations and loud acoustic noise go hand in hand. Acoustic noise can negatively impact patients from anxiety and communication problems to transient and permanent hearing loss.1,2 Moreover, a direct correlation between the acoustic noise level and claustrophobia has been demonstrated.3 The acoustic noise during an MRI examination is consequent to the amount of gradient switching. Sound levels can be lowered by either reducing the amount of gradient switching or by increasing the gradient switching frequency beyond the hearing threshold. In this pilot study we used a silent gradient axis that is switched at the inaudible frequency of 20 kHz with a silent readout module implemented in a Magnetization Prepared Rapid Gradient Echo (MPRAGE) sequence4, and investigated subject experience and image quality of fast and quiet anatomical brain imaging at 7 tesla (T).Methods
Study populationTo achieve the most MRI ‘naïve’ experience, five healthy volunteers (aged 21-29 years; three females) with little to no MRI experience were included. All subjects provided written informed consent.
Set-up
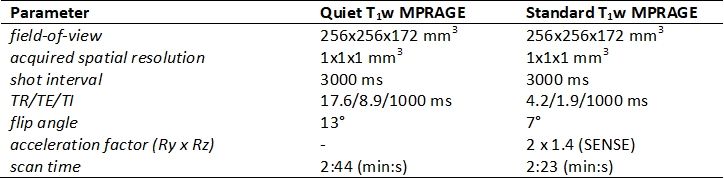
A 7T MRI scanner (Philips, Best, the Netherlands) was used together with a 32-channel head coil (Nova Medical) inside a birdcage coil containing the silent gradient axis (Figure 1). A T1-weighted sequence was chosen because of its significant acoustic noise levels. Both a standard MPRAGE sequence as well as a quiet version applying the silent gradient axis was obtained; acquisition parameters can be found in Table 1. For the quiet sequence no acceleration factor was needed due to the intrinsic fast echo-planar imaging (EPI) readout used. A condenser microphone (Behringer ECM8000) was used to measure sound level during both sequences.
Subjects were given adequate hearing protection. Each subject underwent both the quiet and the standard MPRAGE twice to determine consistency in reporting; the order of the scans differed per subject. Directly after each scan (immediate) and after all scans (delayed), subjects were asked to rate the sound level of each scan on an ordinal scale from 0 to 10. In addition, subjects filled out a questionnaire and rated level of comfort, overall experience, and willingness to undergo the scan again.
Qualitative image assessment
A preliminary assessment of MR images of both sequences was performed by a radiologist with 11 years of experience in 7T neuroimaging to determine the image quality. Visibility of anatomical details and grey-white matter contrast were scored using a five-point Likert scale from 1 (very poor) to 5 (excellent) as well as artifacts from 1 (severe) to 5 (none) (Table 2). An average score per category was determined for each sequence.
Statistical analysis
To assess the extent to which the subjects rated the first and second scan of each sequence differently, the mean difference between the ratings of the first and second scan of each sequence was calculated. Then, to compare the ratings of the quiet and standard sequence, a mean was calculated for each rating for both sequences. To determine whether the sequences differed statistically significantly, a Wilcoxon signed-rank test was used.
Results
The peak sound level in the quiet MPRAGE was measured to be 26 dB lower than the standard.Subject experience
Mean difference between the ratings of the first and second scan of the quiet and standard sequence was minimal; 0.6 (SD 0.9) and 0.3 (SD 0.9) points, respectively. All subjects reported sound level of the quiet sequence substantially lower, with immediate ratings similar to delayed, and comfort, overall experience and willingness to undergo the scan again higher (Figure 2). Apart from willingness to undergo the scan again, all differences between sequences were statistically significant. An interesting remark from two subjects was that the type of sound of the quiet sequence was more pleasant to listen to.
Qualitative image assessment
Average scores of all categories showed a higher image quality and less artifacts of the standard sequence compared to the quiet sequence; however, with only one point difference on average. The main limitation of the quiet sequence was its apparent increased sensitivity to susceptibility effects, which translated in signal distortion and signal loss near the paranasal sinuses and the temporal lobes/mastoid, causing artifacts in the orbits and more difficulty discerning anatomical details and grey-white matter contrast of the limbic system. All other anatomical areas showed acceptable or good image quality, with even better visibility of the basal ganglia (globus pallidus)in the MR images of the silent sequence compared to the standard sequence (Table 2; Figure 3).
Discussion/Conclusion
We have shown preliminary evidence that our silent gradient axis with silent readout module incorporated into a T1-weighted MPRAGE sequence is perceived more quiet and positive and delivers images of largely acceptable quality. We would like to continue assessing subject experience in small cohorts of patients that could benefit from a quieter MRI scan, for instance children and elderly patients. The susceptibility effects leading to lesser image quality mainly in the limbic system are likely due to the prolonged echo time of the sequence. Our next steps towards higher image quality are therefore a quantitative image assessment followed by a further improvement of the reconstruction of the images.Acknowledgements
No acknowledgement found.References
- Brummett RE, Talbot JM, Charuhas P. Potential hearing loss resulting from MR imaging. Radiology 1988;169:539e40.
- Phillips S, Dreary IJ. Interventions to alleviate patient anxiety during magnetic resonance imaging: a review. Radiography 1995;1:29e34.
- Dewey M, Schink T, Dewey CF. Claustrophobia during magnetic resonance imaging: cohort study in over 55,000 patients. J Magn Reson Imaging 2007;26:1322e7.
- Versteeg, E. et al. in Proceedings of the 27th Annual Meeting of ISMRM #4586 (2019)
Figures
Table
1: Acquisition parameters.
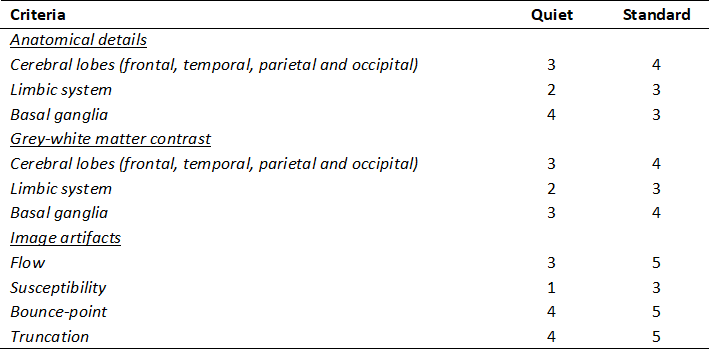
Table
2: Preliminary qualitative image assessment
of MR images of both sequences on visibility of anatomical details, grey-white
matter contrast and artifacts using a
five-point Likert scale (1 = very poor, 2 = poor, 3 = acceptable, 4 = good and 5
= excellent for anatomical details and grey-white matter contrast; 1 = severe,
2 = obvious, 3 = moderate, 4 = mild and 5 = none for image artifacts).
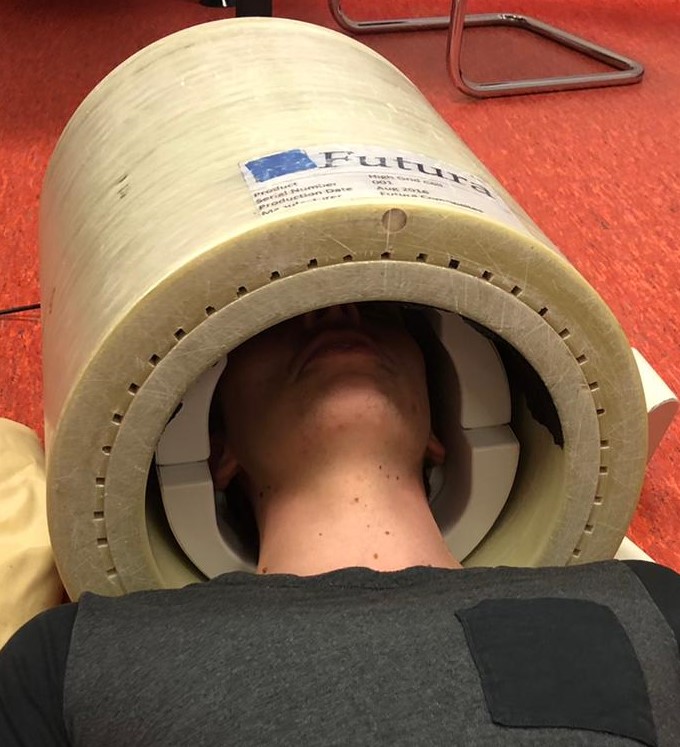
Figure 1:
Silent gradient axis embedded in birdcage coil with head coil (Nova Medical)
with head of volunteer inside.
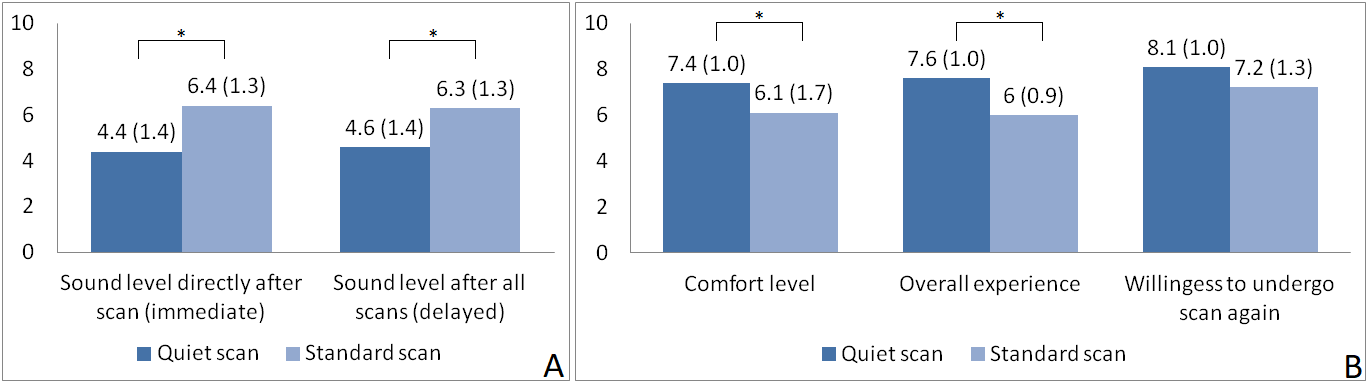
Figure 2: (A) Means (SD) of reported sound level
ratings directly after the scan (immediate) and after all scans (delayed) for the quiet compared
to the standard scan; (B) Means (SD) of comfort level, overall experience and
willingness to undergo scan again ratings for the quiet compared to the
standard scan. Asterisk indicates statistical significance.
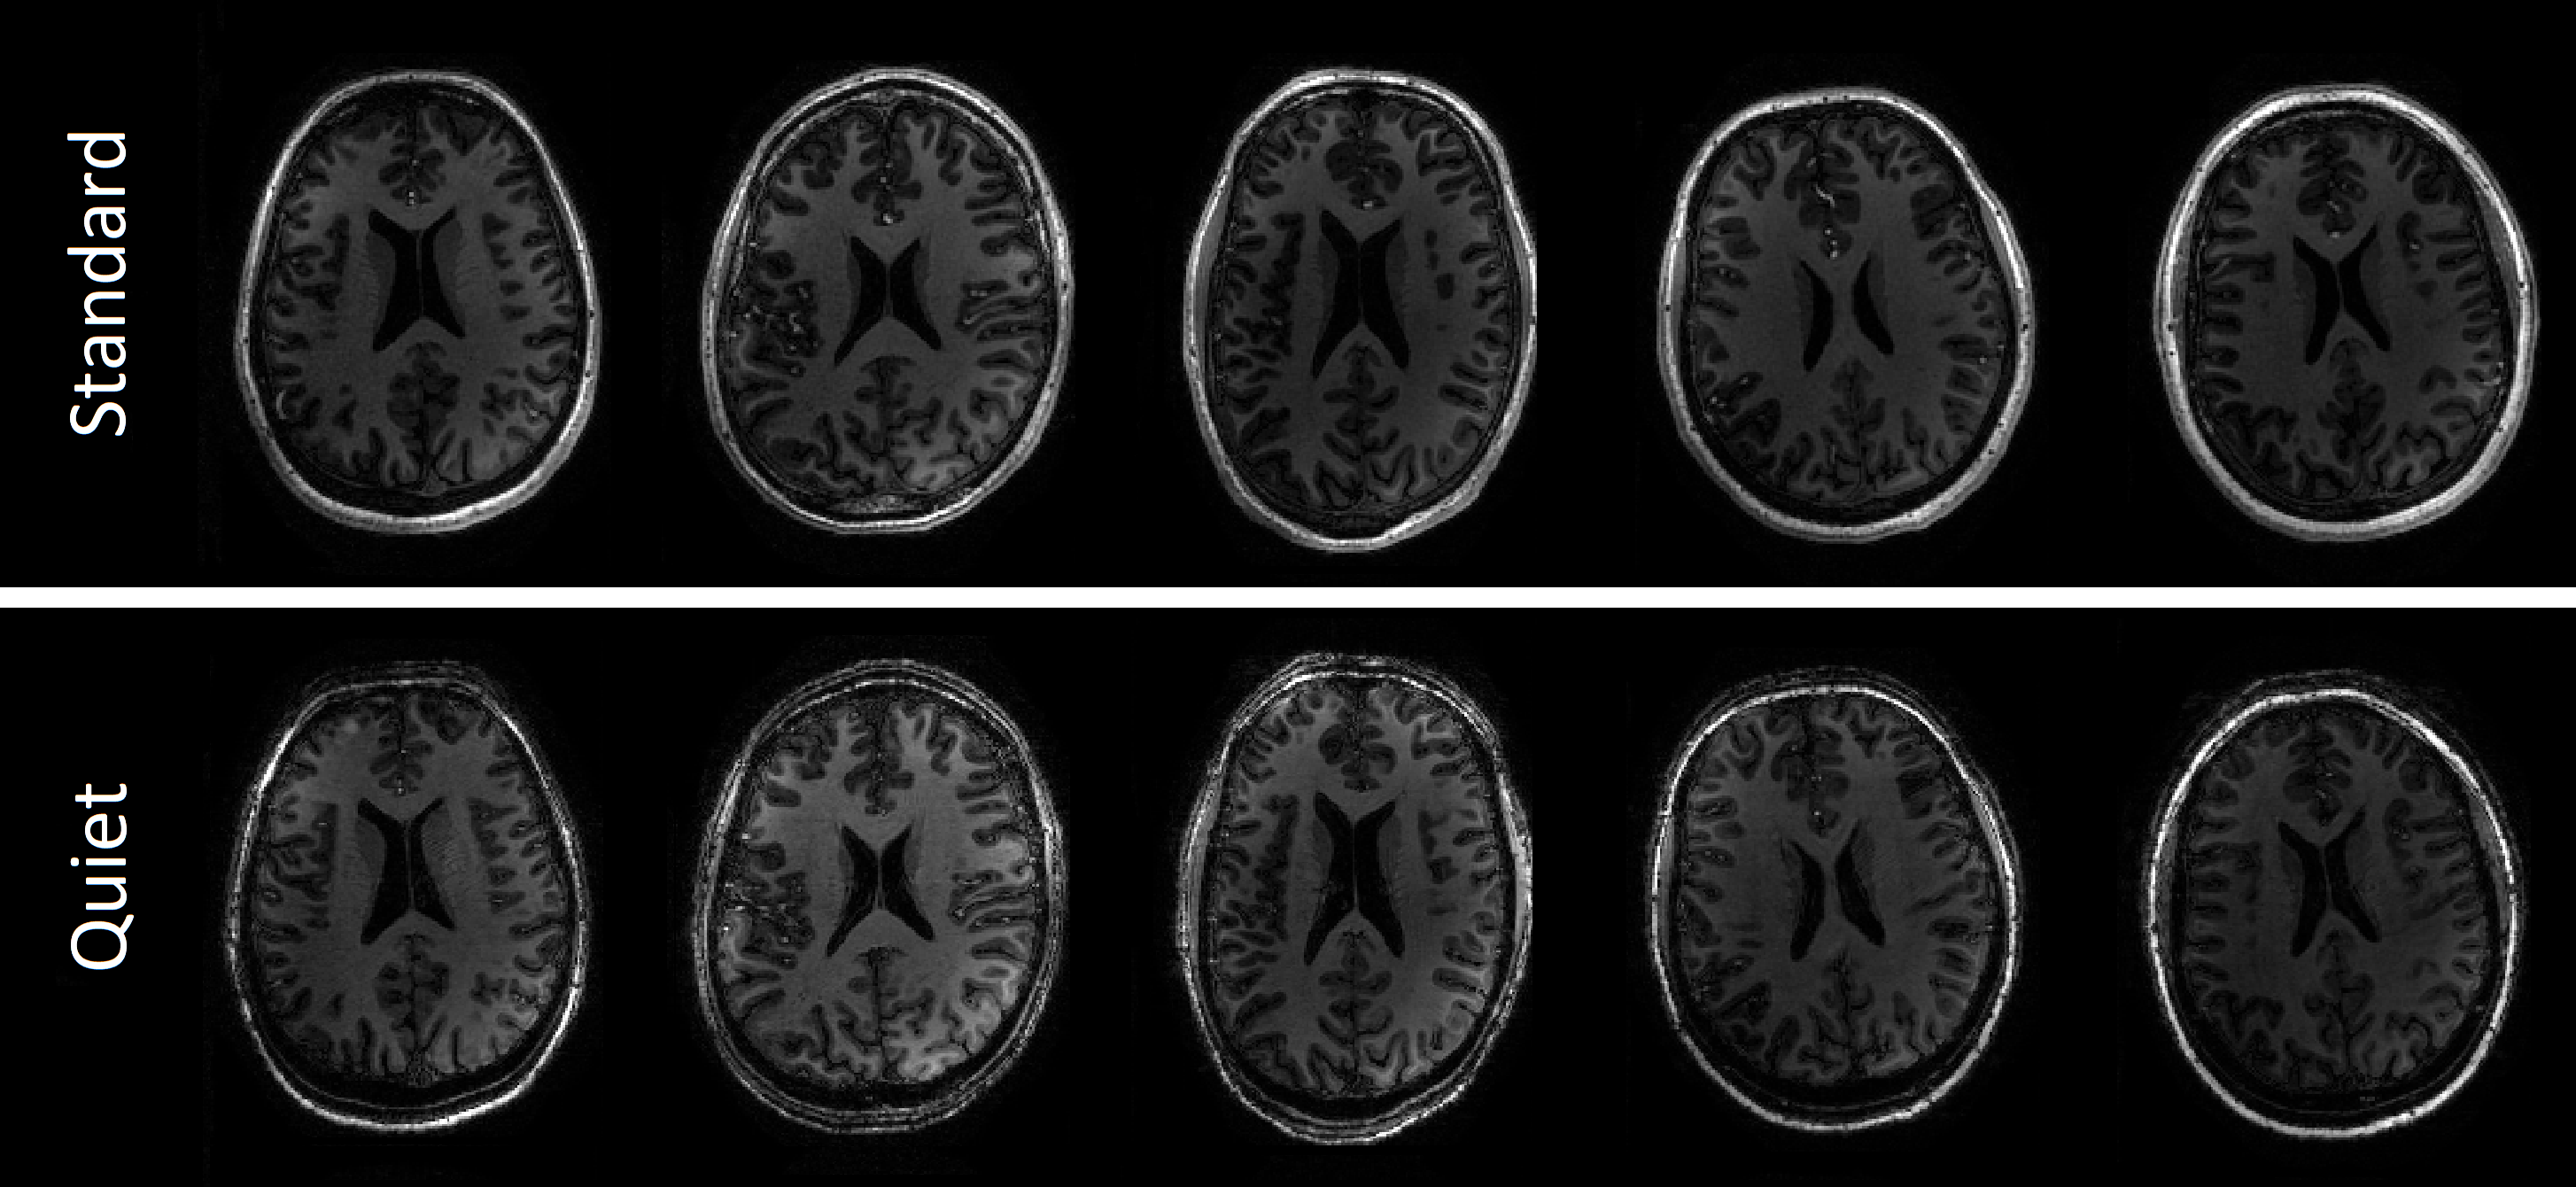
Figure 3: T1-weighted
axial images of the standard (top row) and the quiet (bottom row) scans of all five
subjects.