3089
Direct Comparison of Gradient Modulation Transfer Functions and Acoustic Noise Spectra of the same MRI at High- (3T) and Lower-Field (0.75T)1Institute for Biomedical Engineering, University and ETH Zurich, Zurich, Switzerland
Synopsis
In this work, gradient fidelity is compared between high-field (3T) and lower-field (0.75T) configurations on the same MRI system by measuring the Gradient Modulation Transfer Function (GMTF) and audio noise spectra. Results demonstrate that at lower field mechanical resonances are reduced, leading to improved gradient fidelity and reduction of audio noise levels of up to 70%. Furthermore, it is shown that spectral peaks in the audio spectrum can be related to resonances in the GMTF, which suggests mechanical resonances can be identified using the audio spectrum.
Introduction
Sequences including fMRI, Diffusion Weighted Imaging (DWI) and Dixon-type water/fat separation result in increased audio noise levels compromising patient comfort1. These vibrations are caused by rapid switching of gradients leading to Lorentz forces acting on the gradient coils themselves. Hence, audio noise levels are dependent on sequence type and timings and could also be an indicator of gradient performance and fidelity. Since the sound pressure level (SPL) is linearly related to the logarithm of field strength2, reduced field strength is accompanied by less acoustic noise emission and potentially higher gradient fidelity.In this work, we evaluate the gradient fidelity and audio noise characteristics of the same MRI operated sequentially at 3T and at a lower field strength of 0.75T by comparing Gradient Modulation Transfer Functions (GMTFs) and audio noise measurements.
Methods
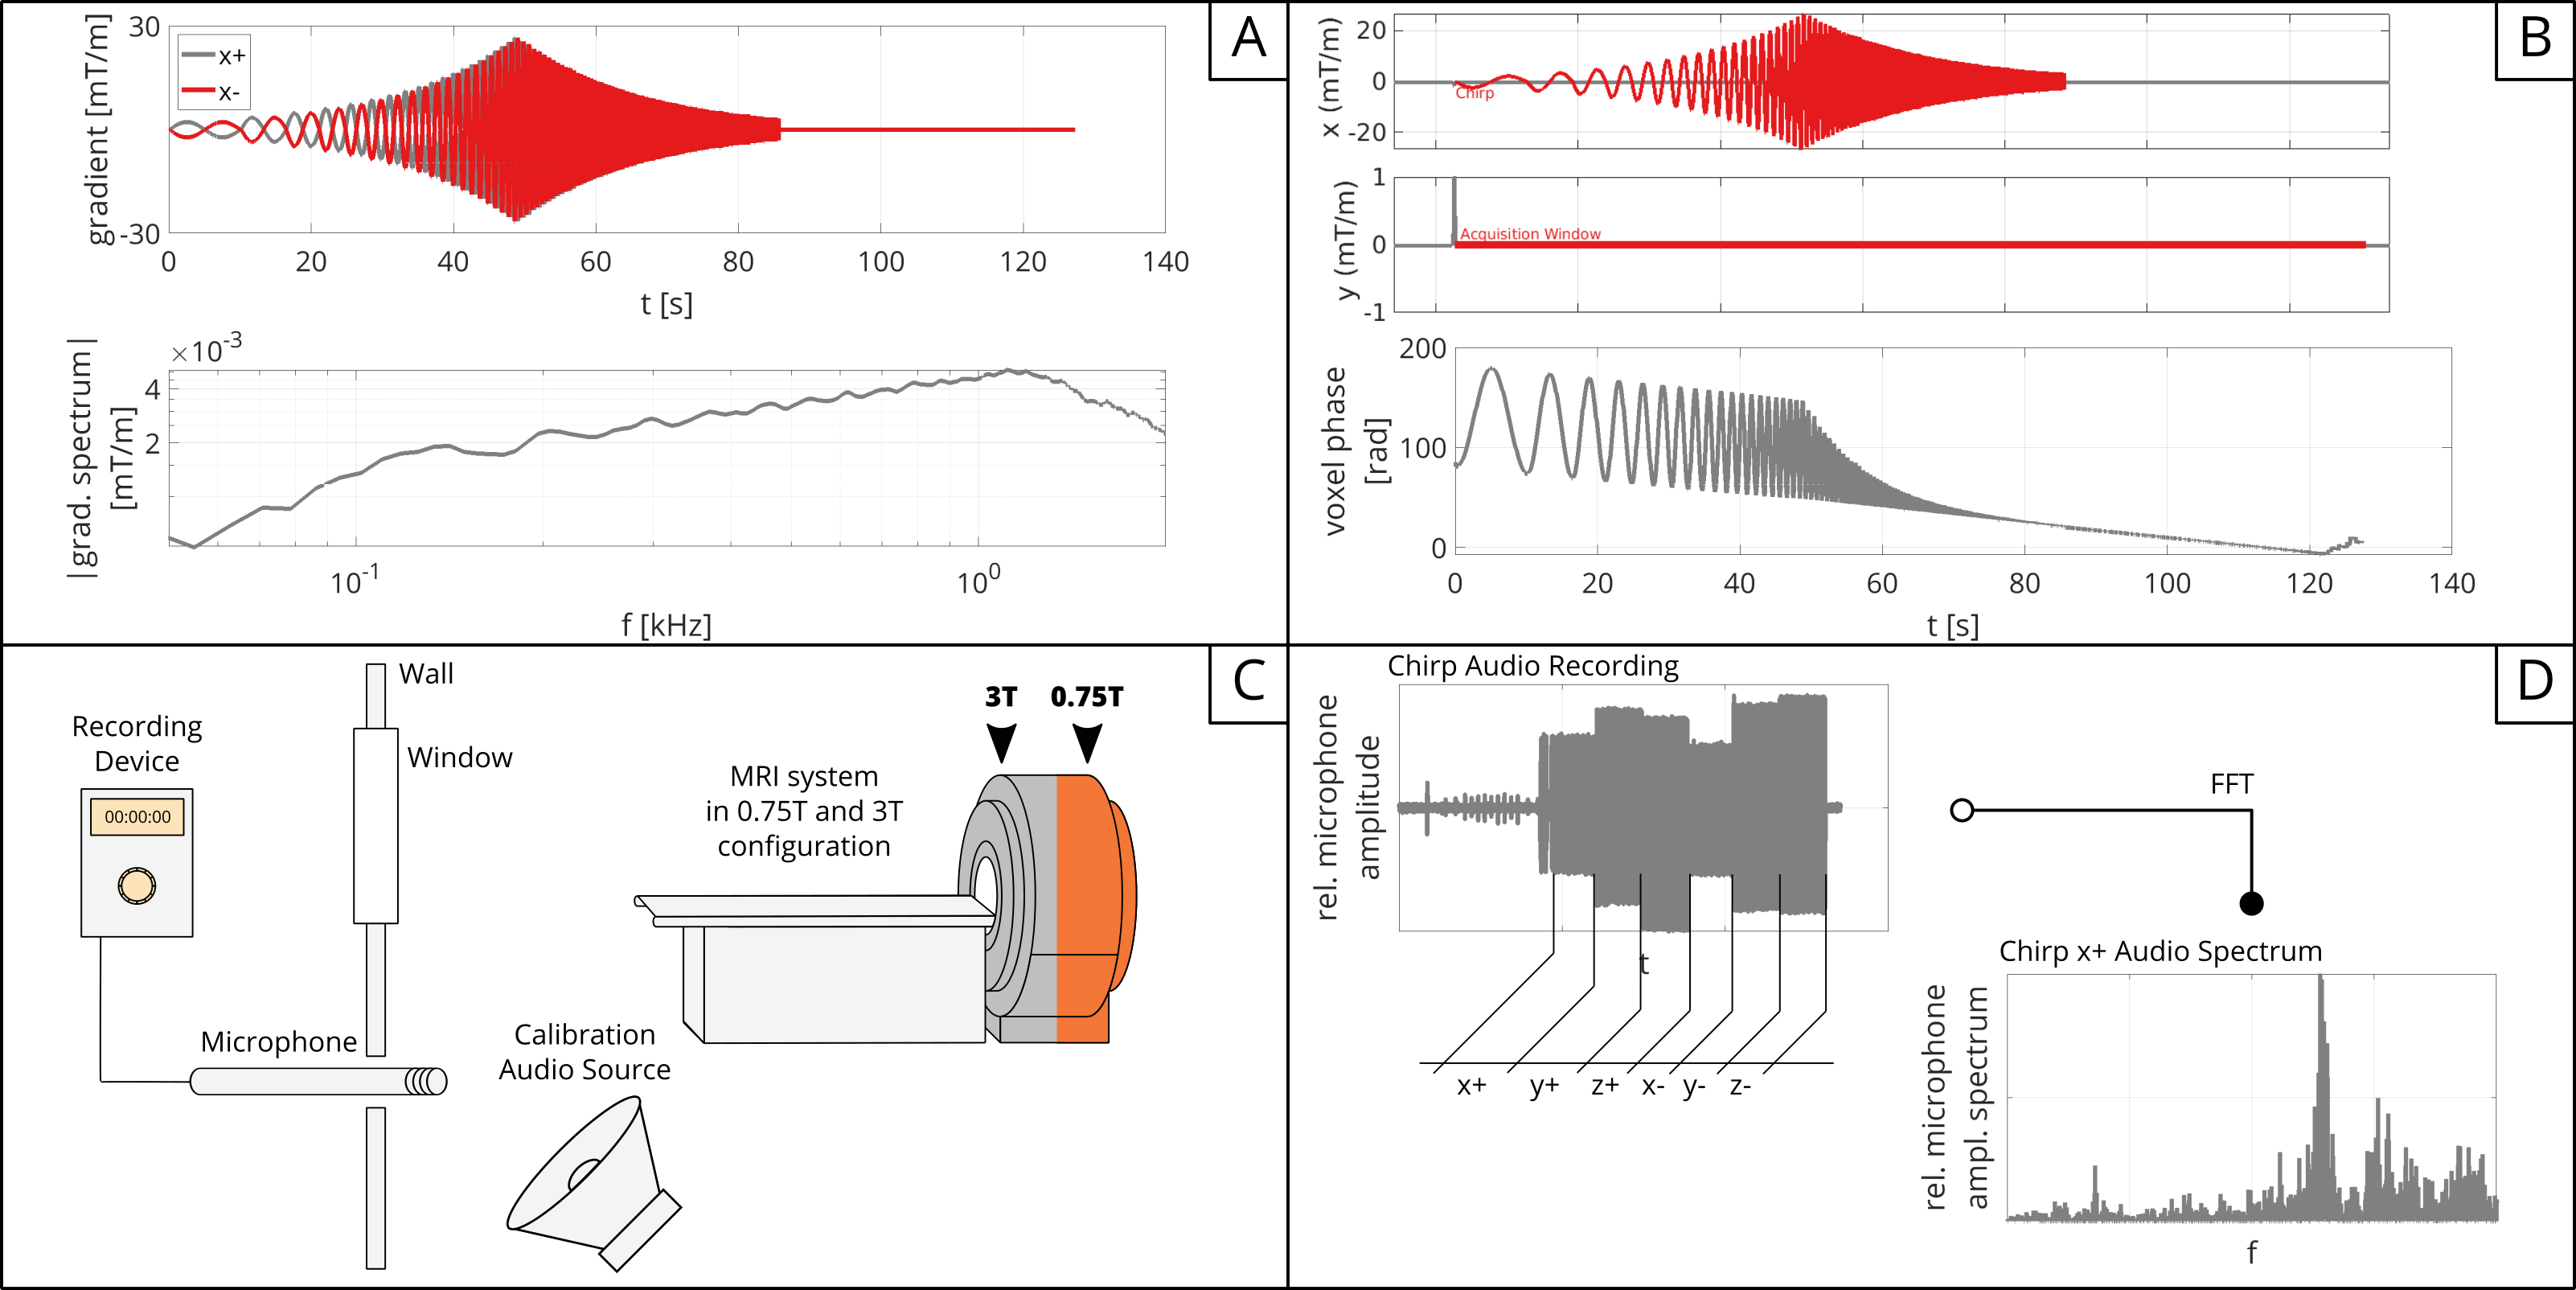
A multi-slice 2D spectroscopy sequence was modified to acquire the phase signal during a chirp pulse according to the method published by Rahmer et al.3. The chirp comprised a linear frequency sweep from 0.1-10kHz, optimized to comply with slew rate and gradient amplitude limits (Figure 1A). A spherical phantom was positioned at the isocenter of a 3T MRI system (Achieva; Philips Healthcare, Best, the Netherlands). Third-order spherical harmonics were fitted for self- and cross-terms (Figure 1B).Measurements were repeated after down-ramping of the system to 0.75T. Excitation and signal reception of proton magnetization was performed by exploiting the 3T-13C channel of the Achieva’s multi-nuclei interface and a Helmholtz-like two-loop transmit coil and a four-channel receive array (Clinical MR Solutions, Brookfield, WI, USA).
In order to quantify audio noise spectra during GMTF estimation and imaging sequences, a measurement microphone (Sennheiser ME 66) connected to a recording device (Tascam DR-100) was positioned in the waveguide connecting the scanner with the control room (Figure 1C). Dependence of SPL on spatial position and linearity with gradient strength was investigated by Hamaguchi et al.4 allowing to correlate our measurements with SPL inside the bore. The sample rate was set to 48kHz mono and data was saved as uncompressed .wav file. The calibration of SPL was verified by recording a 1kHz tone from a known audio source at the beginning of each experiment.
The audio recording of the chirp sequence was divided into 6 audio snippets, each corresponding to the nominal and inverted chirp waveforms played out on the x,y and z axes exclusively, and Fourier transformed resulting in relative microphone amplitude spectra (RMAS, see Figure 1D).
Additionally, RMAS were obtained for exemplary clinical sequences (Cartesian Multi-Acquisition, MA; Multi-Echo Dixon, ME; and Spiral Multi-Acquisition Dixon) to evaluate audio characteristics of the 0.75T and 3T configurations. Here, the timing at 0.75T was used for the acquisitions at 3T to enable direct comparison of the audio levels.
Results & Discussion
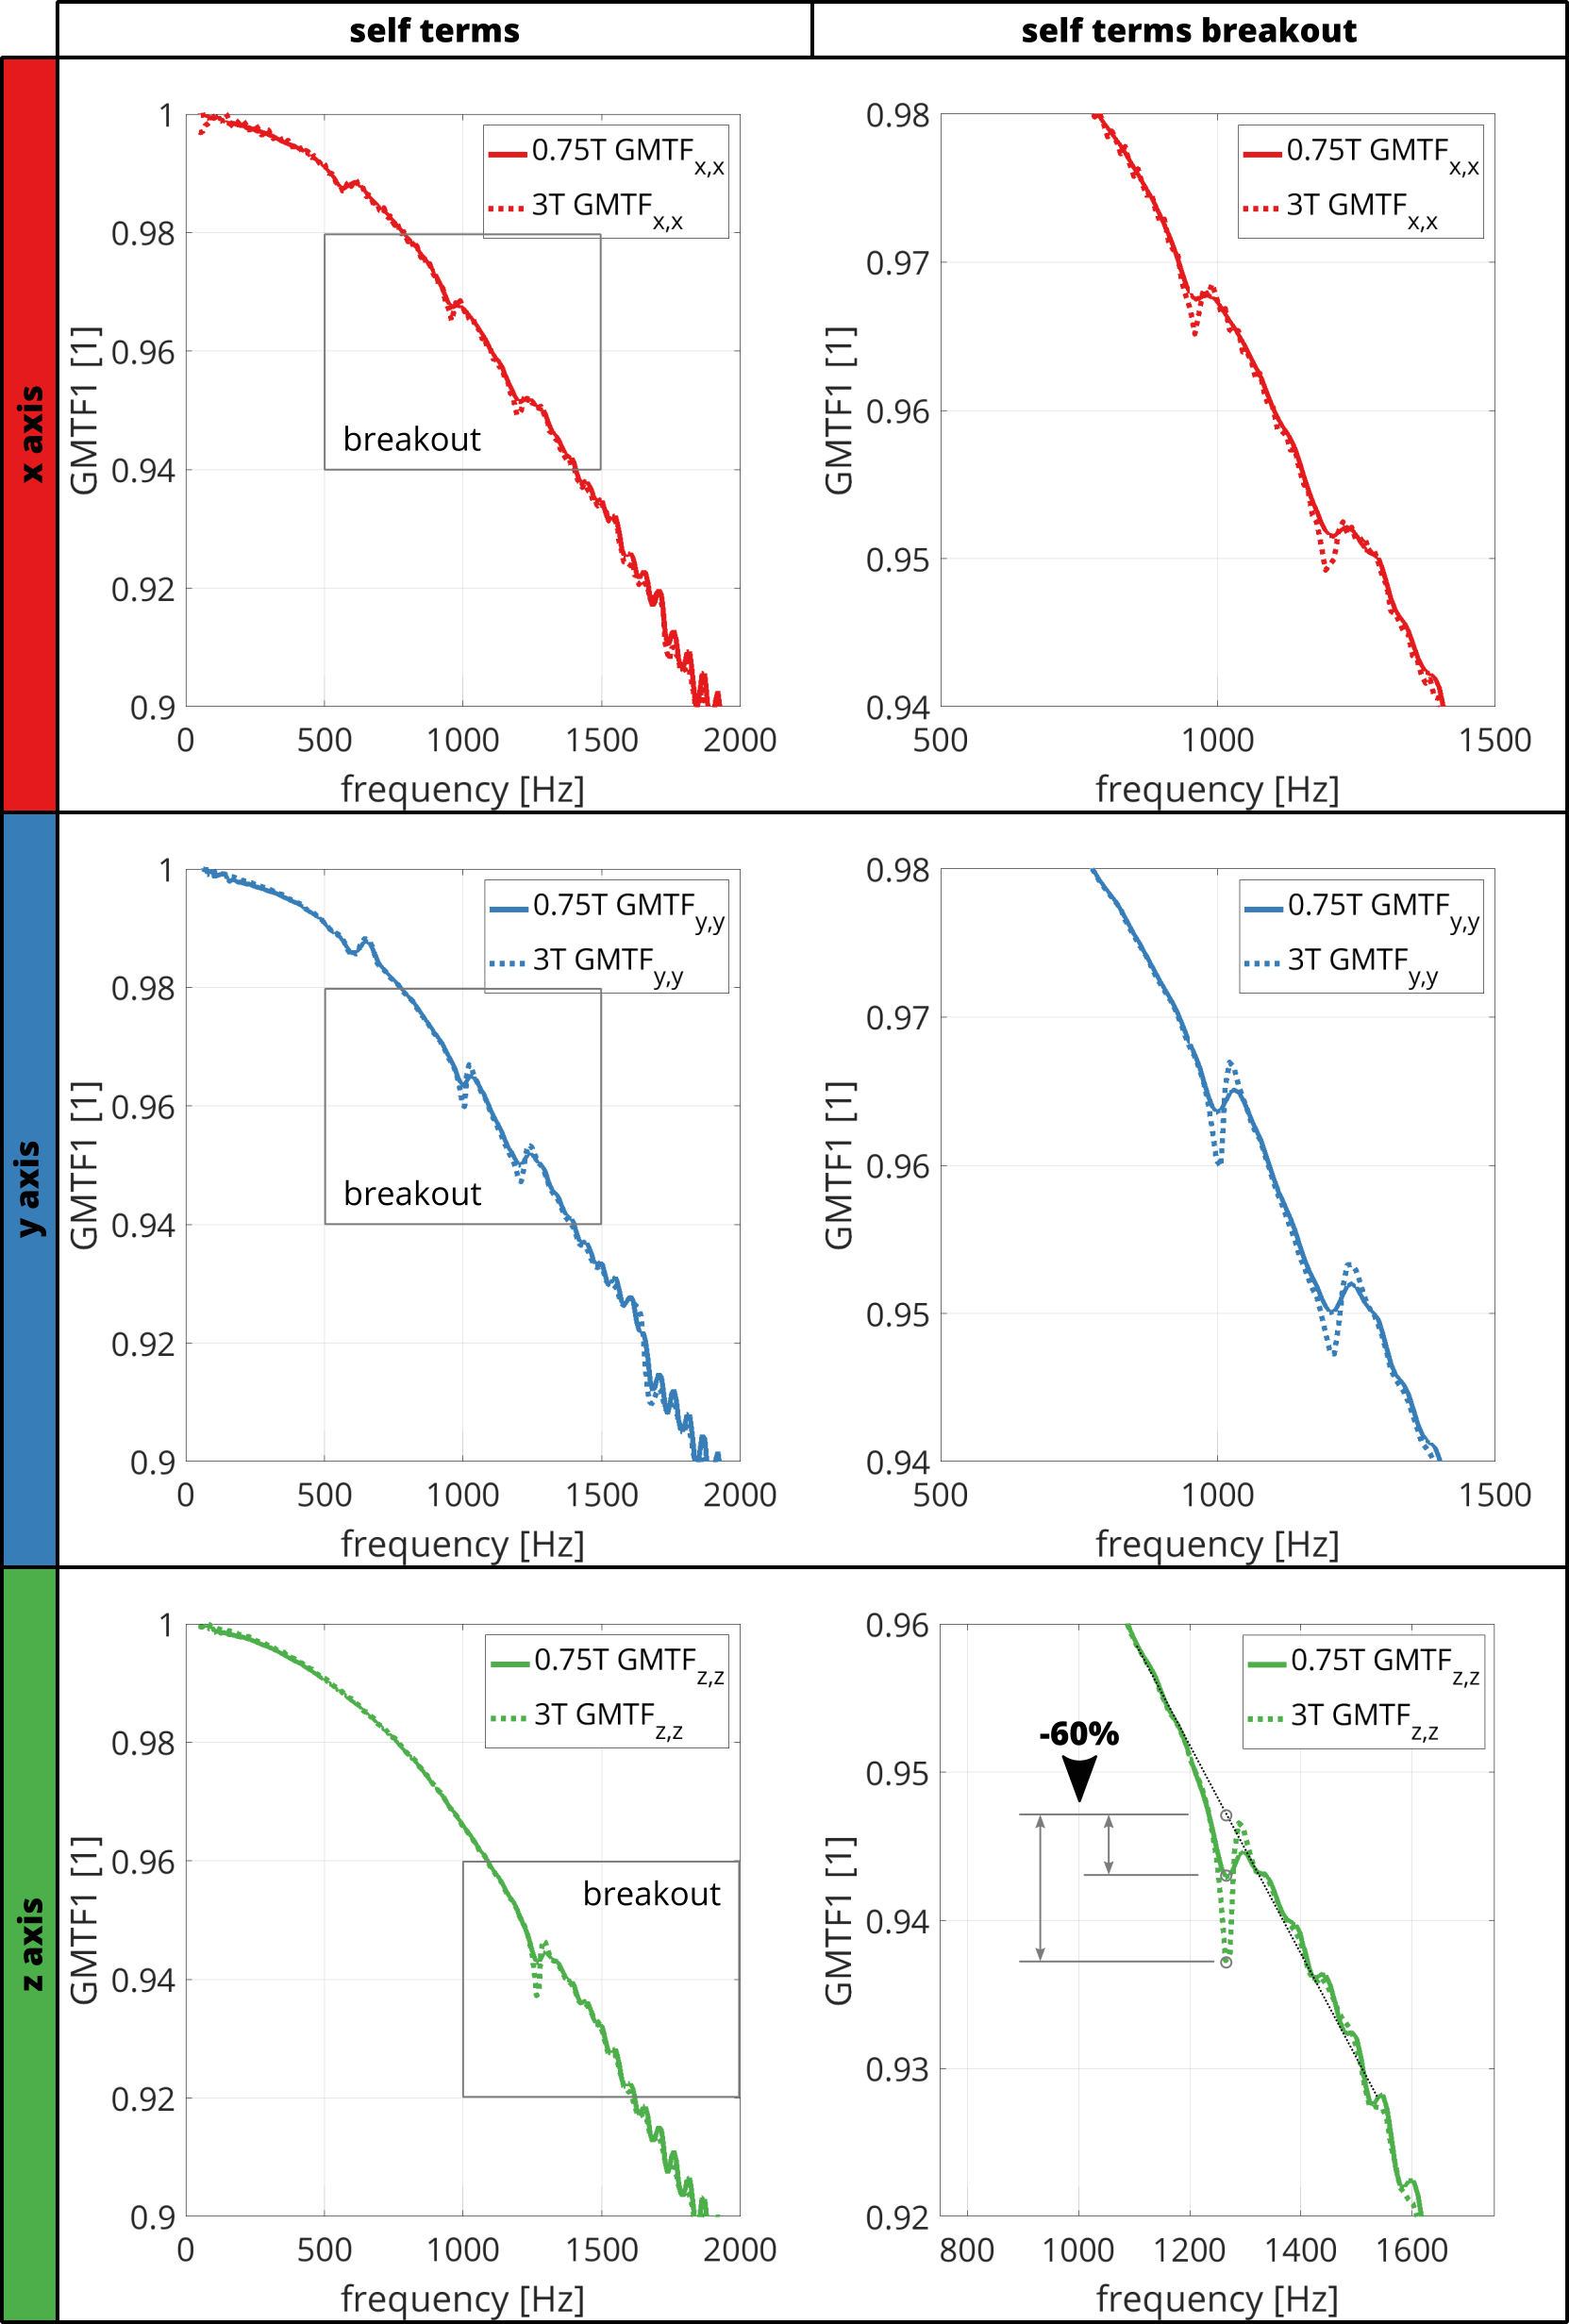
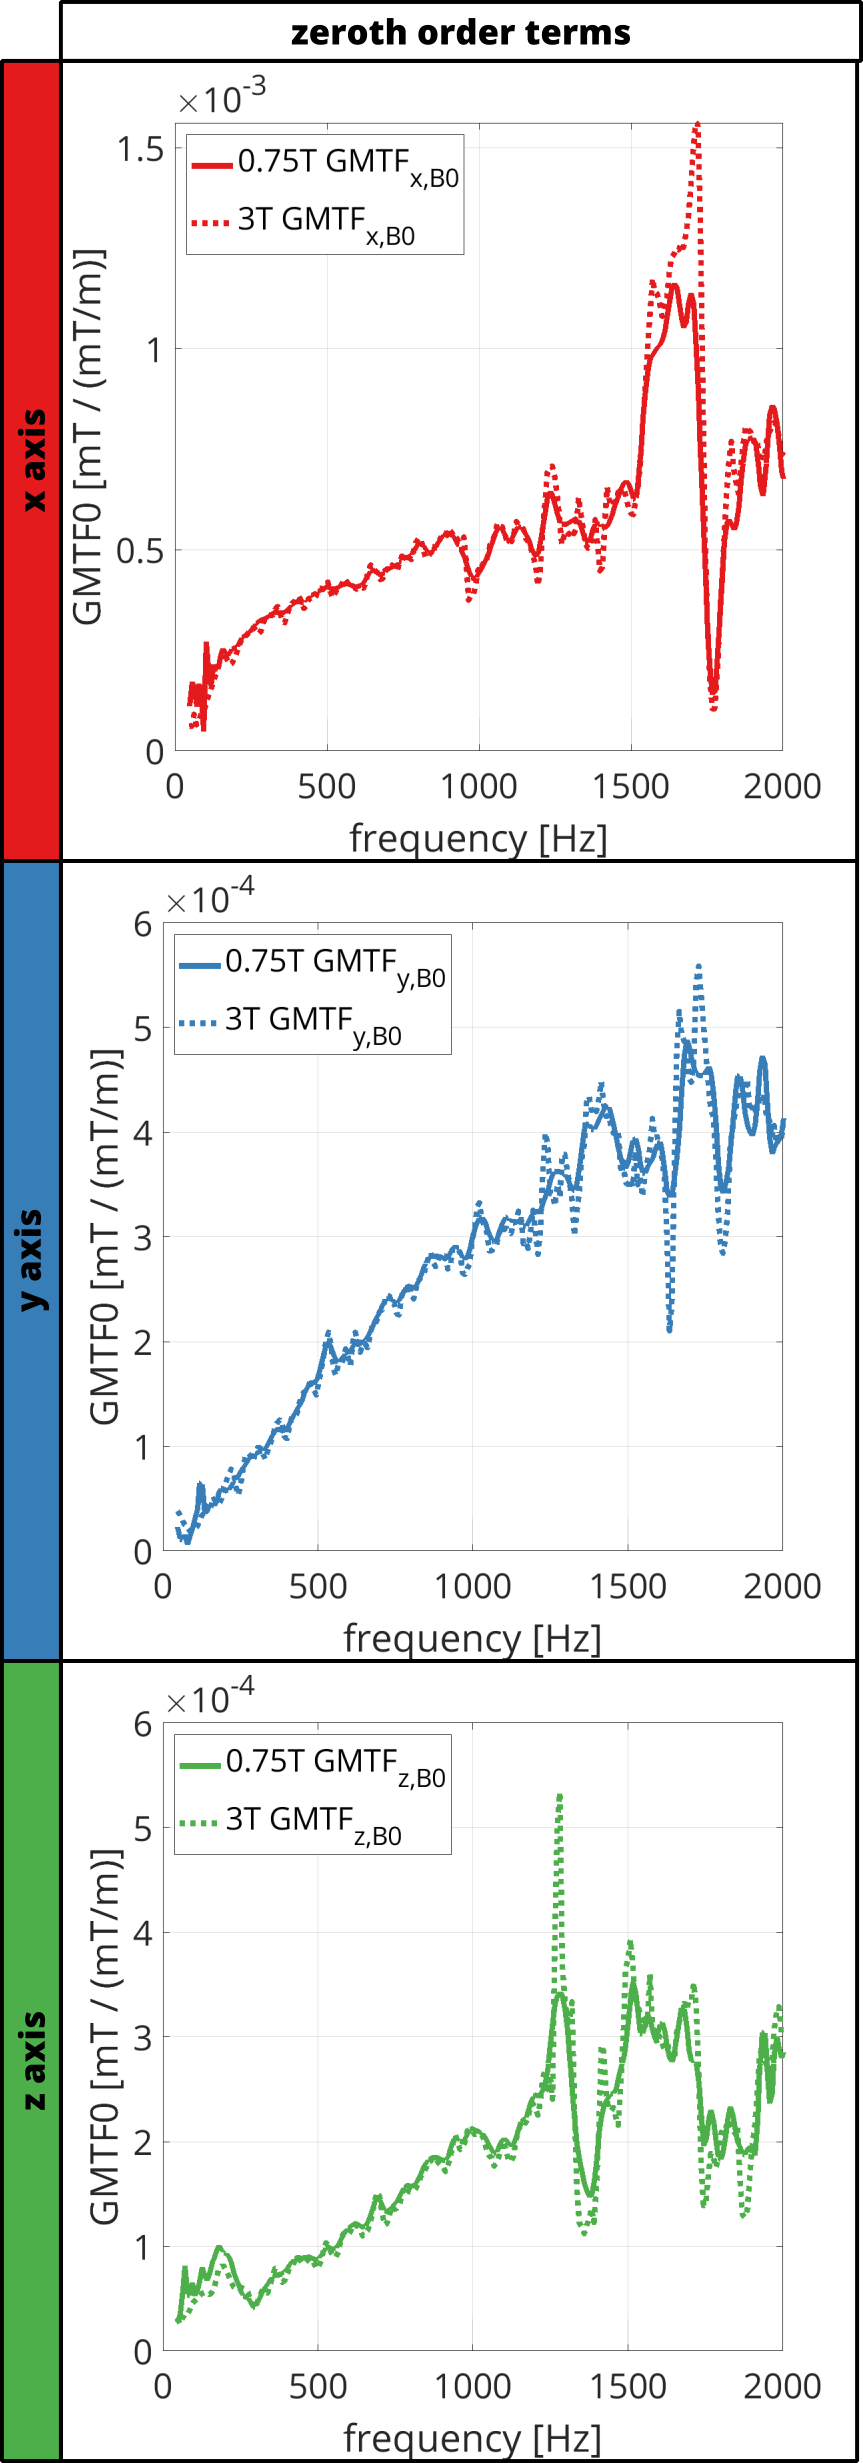
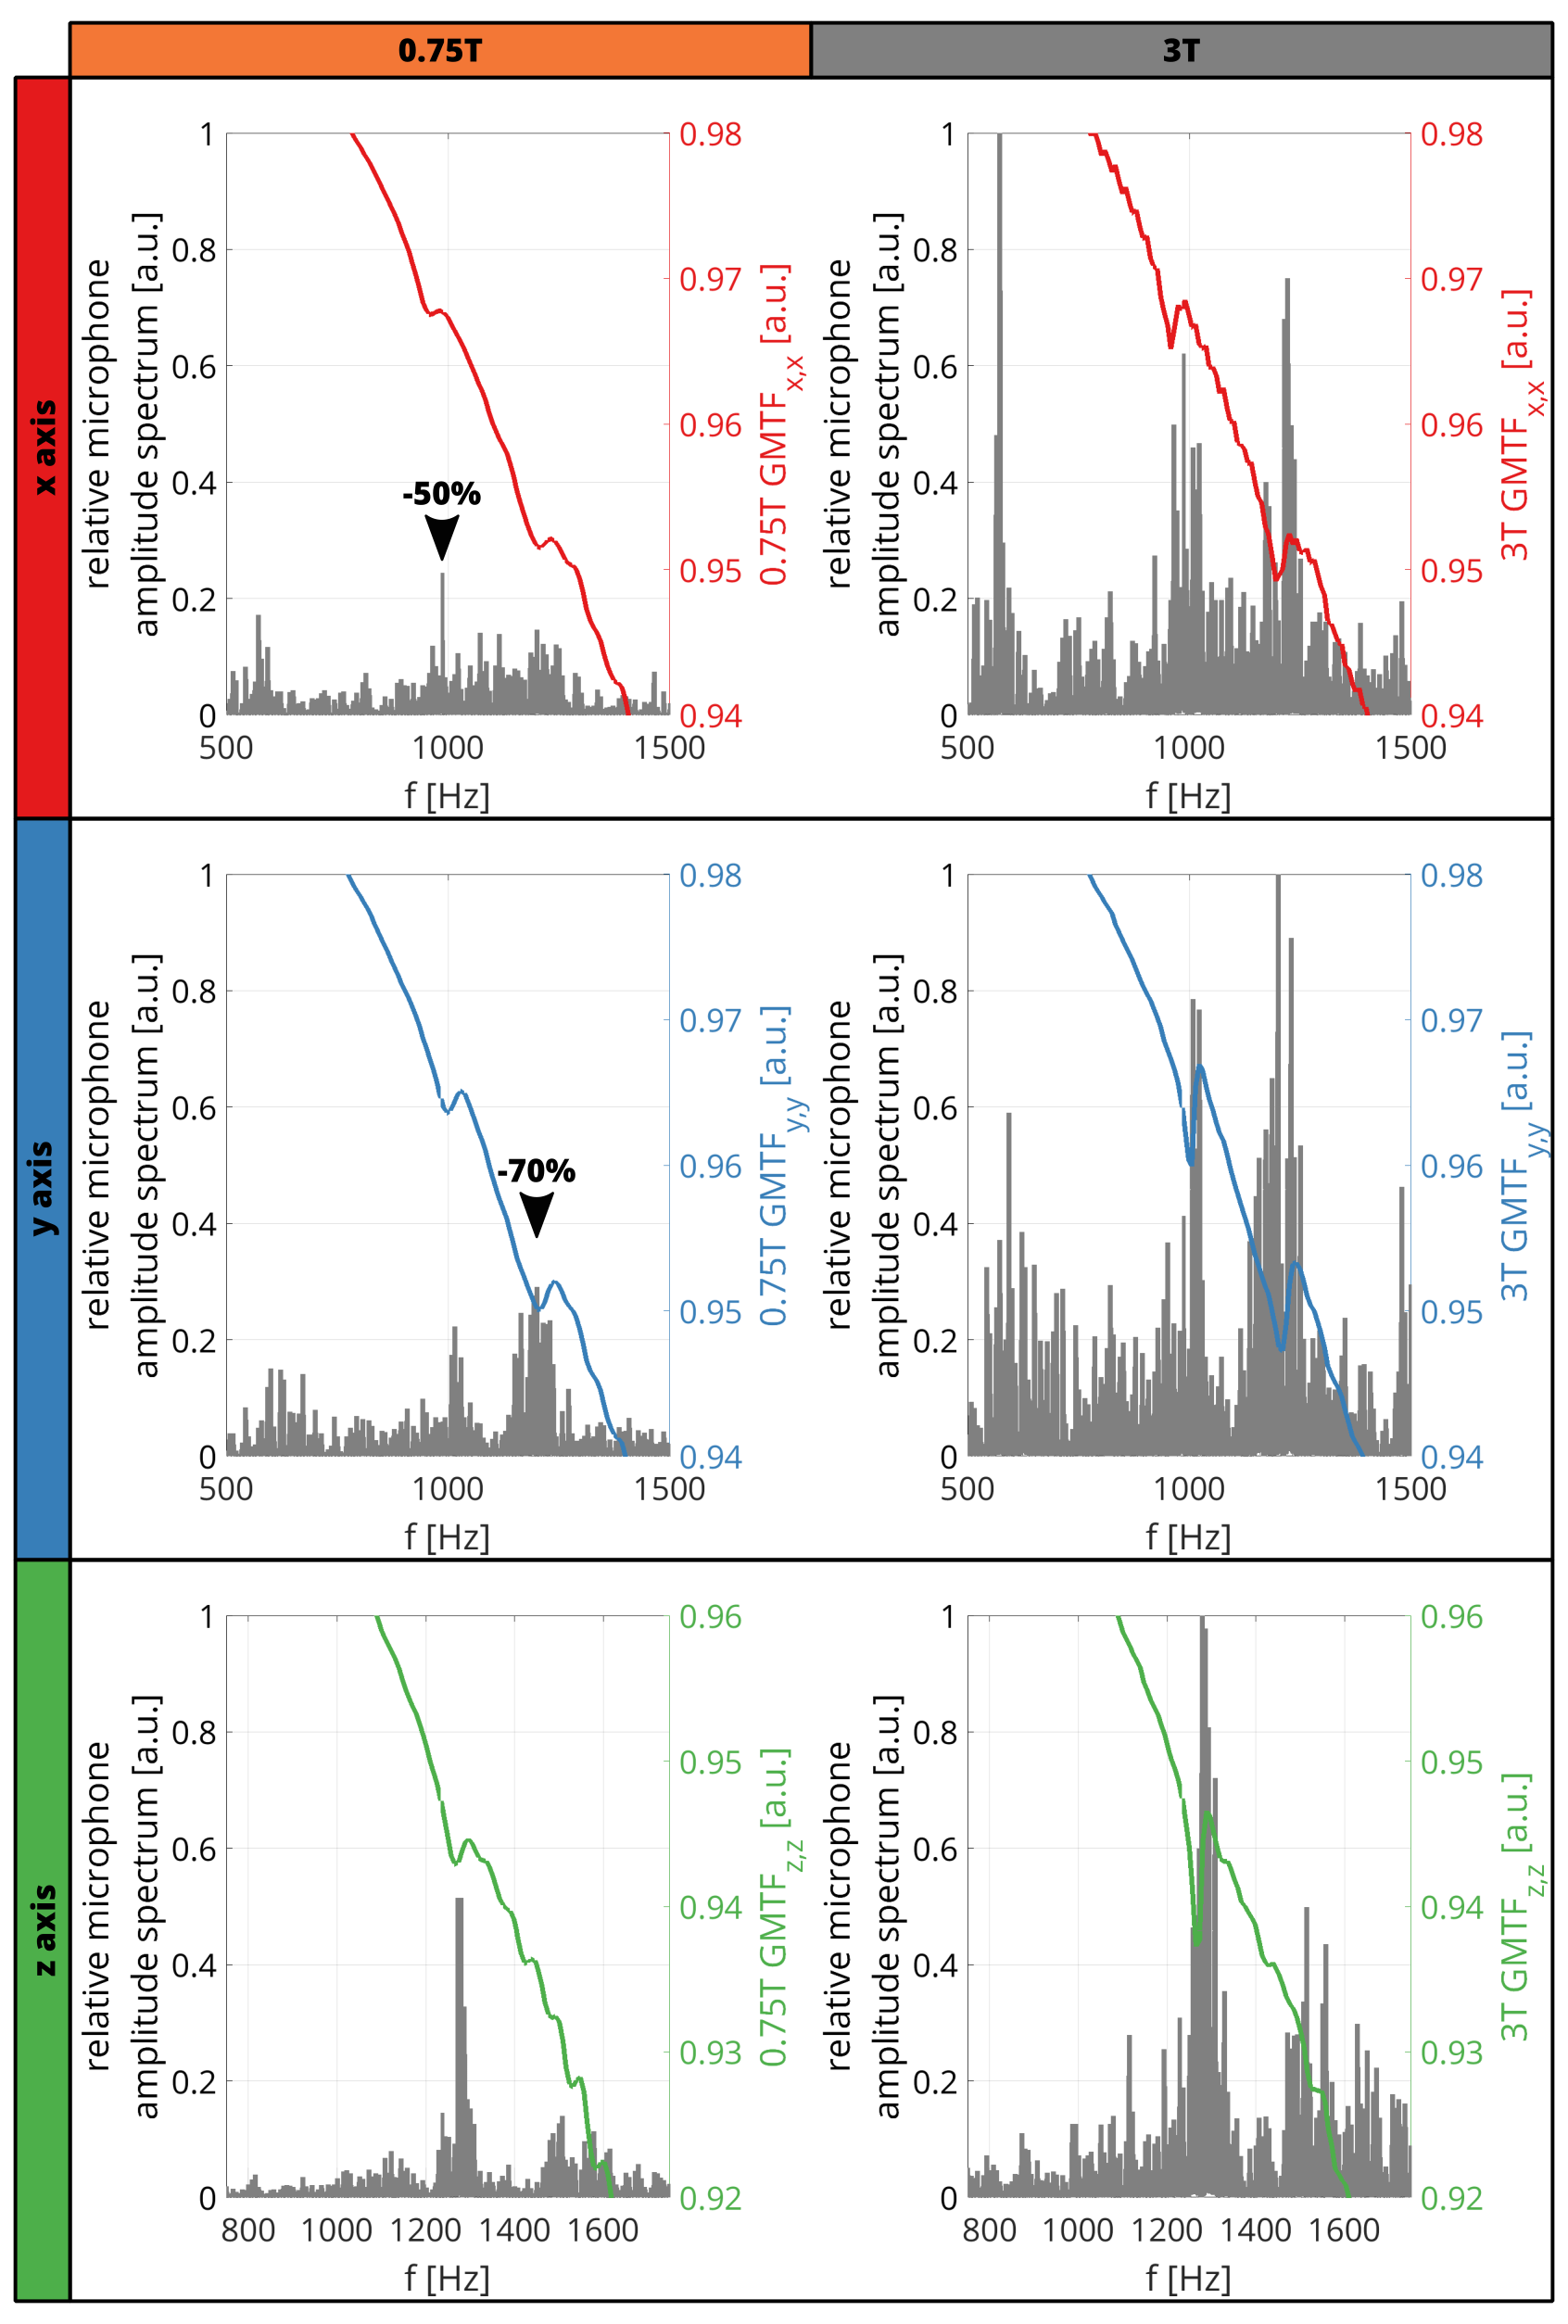
Figure 2 shows the estimated GMTF using the chirp sequence for 0.75T and 3T. Mechanical resonances and antiresonances were detected at the same frequencies for both configurations, but their amplitude is decreased for 0.75T (antiresonance for 0.75T / 3T = 60% reduction). Comparing self terms, most prominent antiresonances are located at 1065Hz and 1264Hz for the y and z axis, respectively. For zeroth-order GMTF terms (Figure 3), the resonance in the x-axis dominates the spectrum.Figure 4 shows the GMTFs and their corresponding relative microphone amplitude spectra (RMAS). For 0.75T, the peaks in the RMAS are found to be reduced by up to 70% for the y-axis (at 1202Hz) when compared to 3T. For the x and z axes, a reduction of 50% is found (x-axis, at 985.7Hz).
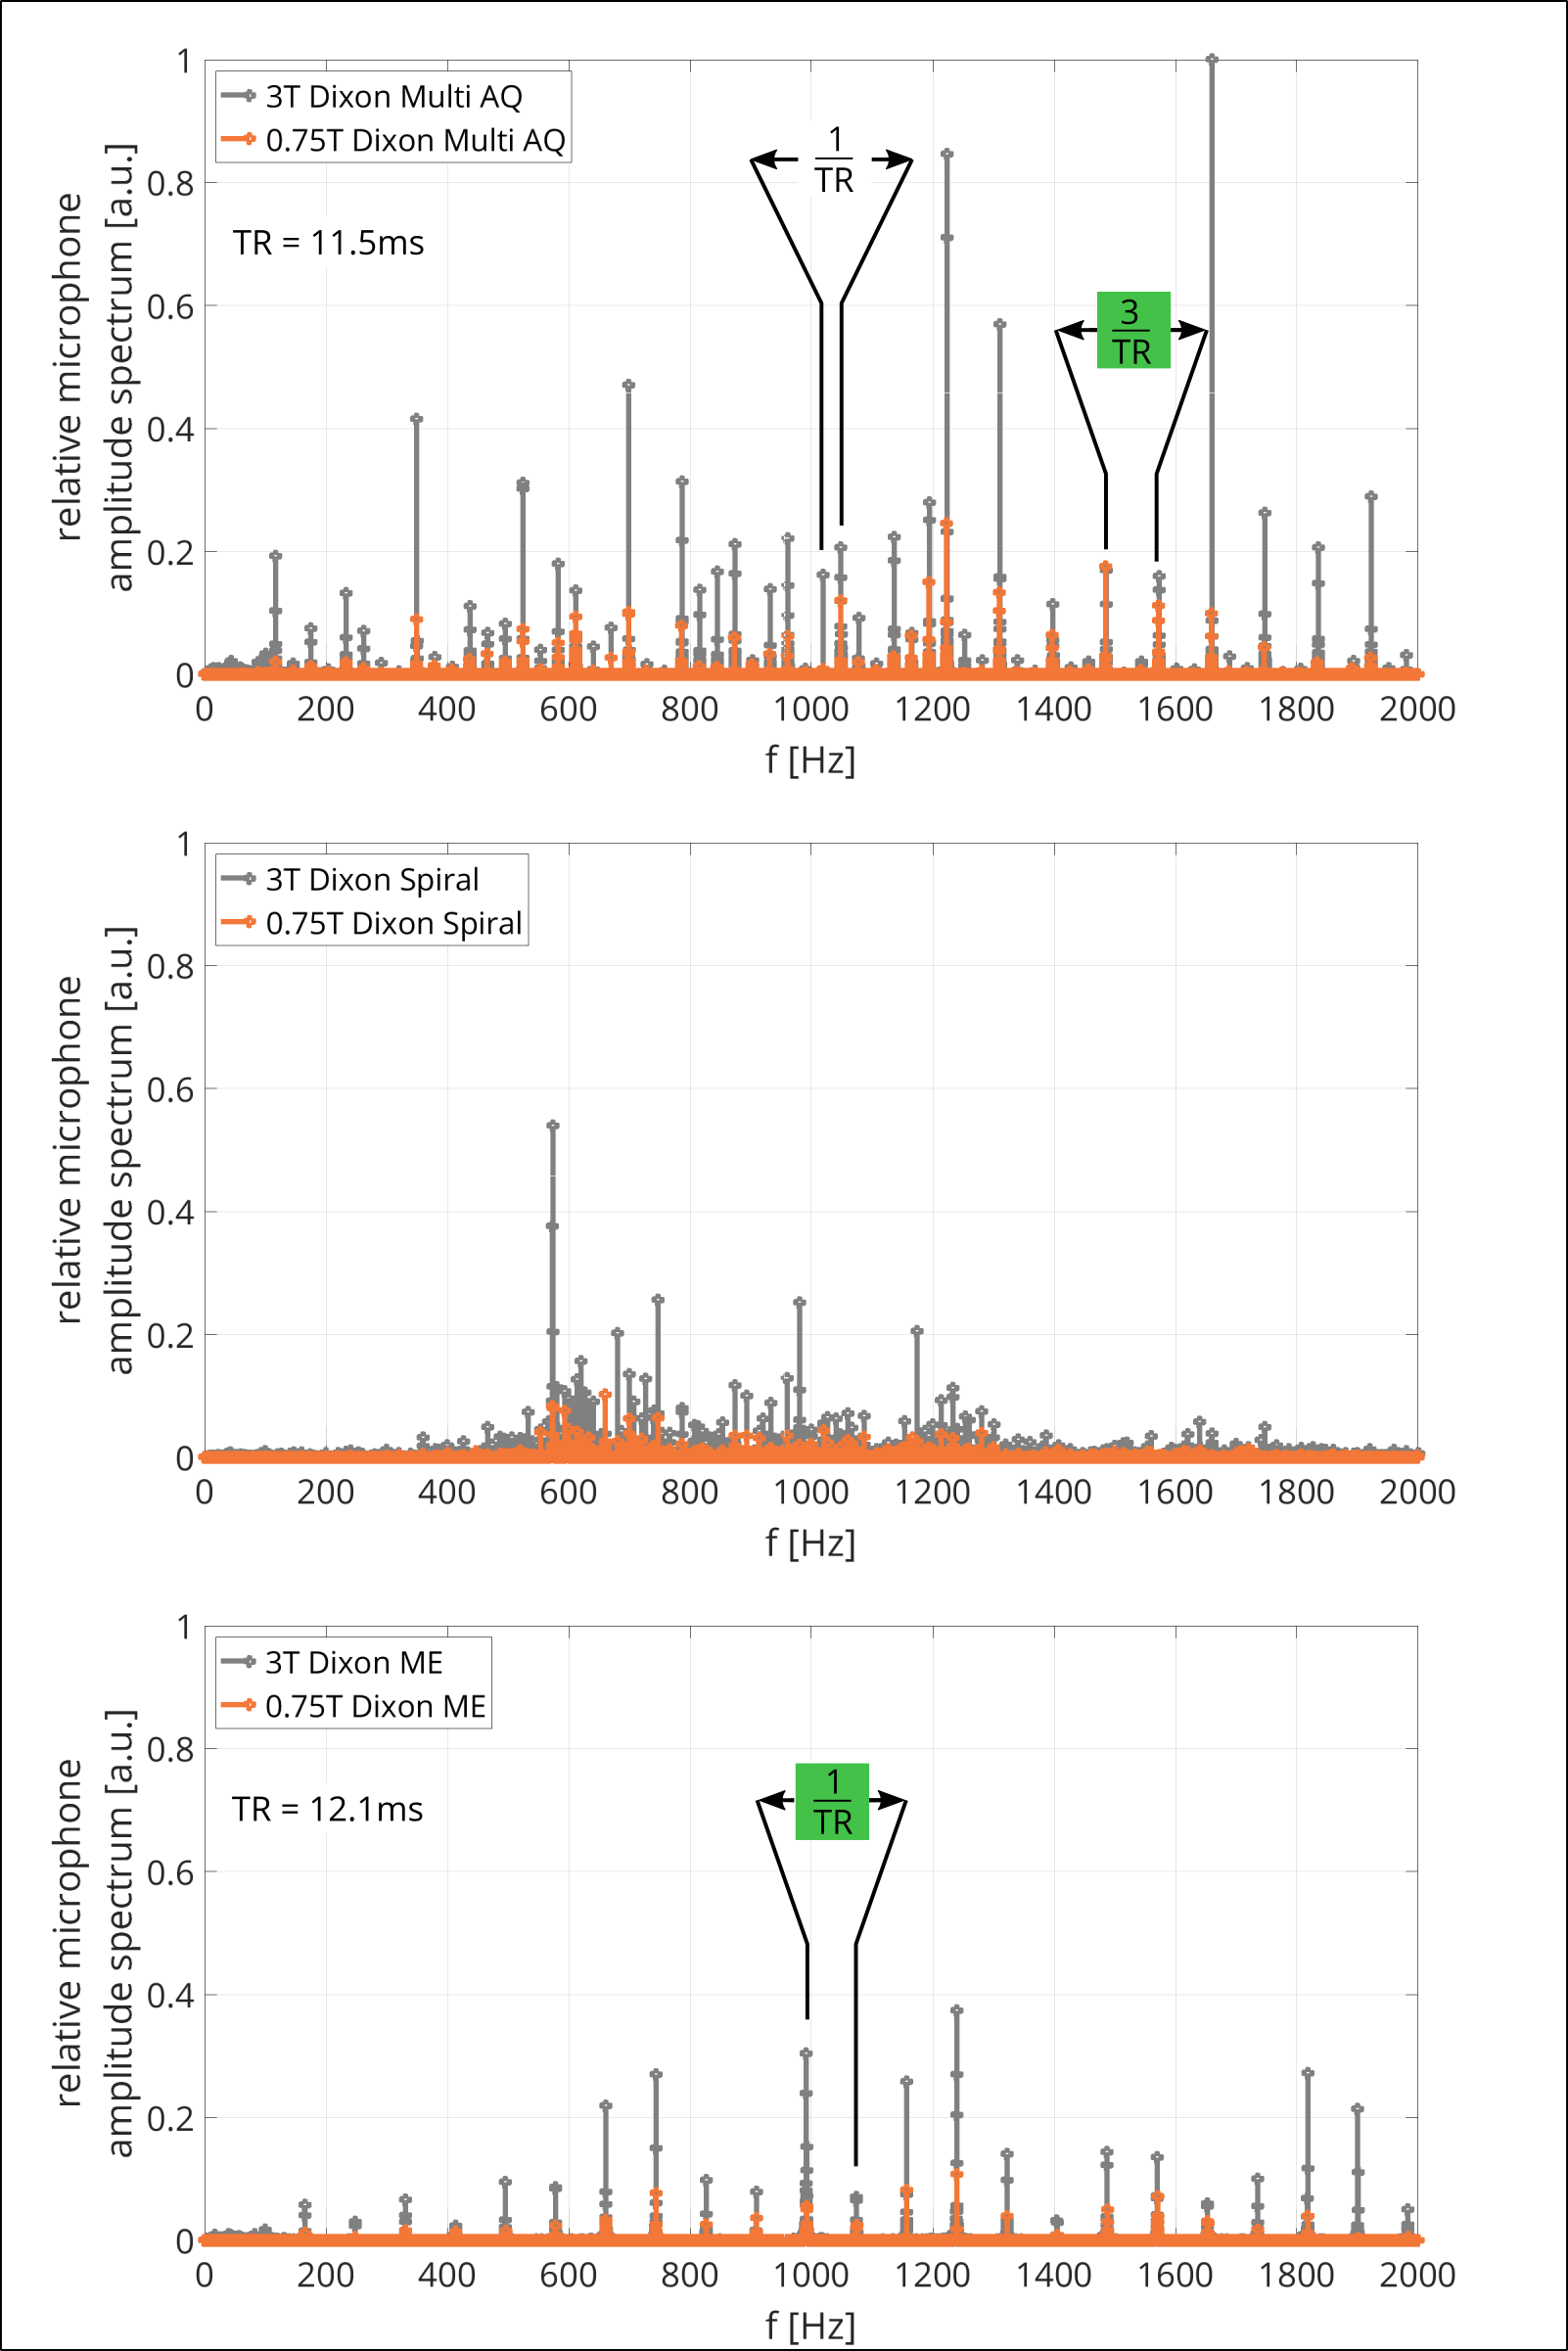
In Figure 5, RMAS for the vendor-supplied clinical three-point Dixon sequences are shown. Due to the repetitive nature of MRI sequences, a frequency comb is observed in the RMAS, which is given by the inverse of the sequence’s periodicity, i.e. 1/TR for ME and 1/(3TR) for MA. The integral over RMAS in the depicted frequency region (up to 2kHz, frequency region high sensitivity of human hearing) is found to be reduced by factors 4 (Cartesian Multi-Acquisition Dixon), 3.67 (Spiral MA Dixon) and 5.59 (Cartesian Multi-Echo Dixon) between the 3T and 0.75T configurations, respectively.
Conclusion
In this work, we presented GMTFs of a 3T MRI in its original and down-ramped 0.75T configuration. While the general transfer characteristics remain unchanged, mechanical resonances in the GMTF were found to be reduced at 0.75T indicating higher gradient fidelity and lower acoustic noise levels. For both chirp and Dixon sequences, the 0.75T configuration exhibited significantly decreased sound levels.Peaks in the spectrum of audio recordings corresponded well to mechanical resonances in the GMTF. This may offer a unique possibility to identify and track resonances continuously without special hardware or scan procedures in future MR system designs.
Acknowledgements
The authors acknowledge funding of the Platform for Advanced Scientific Computing of the Council of Federal Institutes of Technology (ETH Board), Switzerland.References
1. Moelker A, Pattynama PMT. Acoustic Noise Concerns in Functional Magnetic Resonance Imaging. Hum. Brain Mapp. 2003;20:123–141 doi: 10.1002/hbm.10134.
2. Moelker A, Wielopolski PA, Pattynama PMT. Relatioship between magnetic field strength and magnetic-resonance-related acoustic noise levels. Magn. Reson. Mater. Physics, Biol. Med. 2003;16:52–55 doi: 10.1007/s10334-003-0005-9.
3. Rahmer J, Mazurkewitz P, Börnert P, Nielsen T. Rapid acquisition of the 3D MRI gradient impulse response function using a simple phantom measurement. Magn. Reson. Med. 2019;82:2146–2159 doi: 10.1002/mrm.27902.
4. T. Hamaguchi, T. Miyati, T. Matsushita, N. Ohno; Kanazawa K. Analysis of spatial dependence of acoustic noise transfer function in magnetic resonance imaging. 2014:1–25.
Figures