3082
Accelerating spin-lock imaging using signal compensated low-rank plus sparse matrix decomposition1Shenzhen Institutes of Advanced Technology, Shenzhen, China, 2Chongqing University of Technology, Chongqing, China, Chongqing, China
Synopsis
Recent studies show that variations in the rate of $$$T_{1\rho} (R_{1\rho})$$$ reflect changes in the spectral density of the local dipolar fields experienced by protons due to slow molecular motions. The quantitative data for $$$R_{1\rho}$$$ dispersion requires multiple $$$T_{1\rho}$$$-weighted images with different spin lock times (TSLs) and different locking fields, which makes the acquisition time very long. In this work, a signal compensation strategy with low-rank plus sparse model (SCOPE) was used to reconstruct $$$T_{1\rho}$$$-weighted images from highly undersampled data. We provide the reconstructed images, the estimated $$$R_{1\rho}$$$ maps, and the results of $$$R_{1\rho}$$$ dispersion curves at different acceleration factors.
Introduction
The spin-lattice relaxation in the rotating frame ($$$T_{1\rho}$$$) reflects the relatively slow motional characteristics of macromolecules [1,2] and can quantify dynamic processes such as chemical exchange [3,4]. The variations in the rate of $$$T_{1\rho }$$$ ($$$R_{1\rho}=1/T_{1\rho}$$$) reflect changes in the spectral density of the local dipolar fields experienced by protons due to relatively slow molecular motions. However, to obtain the $$$R_{1\rho}$$$ dispersion information, several datasets with different locking field amplitudes and spin-lock times (TSLs) need to be acquired, which makes the acquisition time very long. Compressed sensing has shown significant performance in fast quantitative $$$T_{1\rho}$$$ mapping [5,6]. In this work, we reconstruct the $$$T_{1\rho}$$$-weighted images and obtain the $$$R_{1\rho}$$$ dispersion from highly undersampled k-space data based on our previous fast $$$T_{1\rho}$$$ mapping method (SCOPE) [7].Methods
The SCOPE method based on the exponential signal decay in $$$T_{1\rho}$$$ mapping was applied by multiplying the original signal by a compensation coefficient. In this study, $$$T_{1\rho}$$$-weighted images with different TSLs and different locking fields ($$$\omega$$$)need to be acquired. Signal evolution of T1ρ mapping varies with each locking field. Therefore the total image matrix obtained doesn’t exhibit low-rankness and the acceleration factor that can be achieved in undersampling is limited. In this work, images at each locking field can be compensated to the same signal intensity level as the image acquired at the first TSL by applying the signal compensation strategy. After compensation, T1ρ-weighted images with each locking field are combined together and theoretically the rank of the total image matrix would be 1. The compensation coefficient can be calculated by :$$coef_{\omega ,n}=1/exp(-TSL_{n}/T_{1\rho }^{\omega })_{n=1,2,...,N}\ \ \ \ \ \ \ \ \ \ (1)$$
where $$$TSL_n$$$ is the $$$n$$$th spin-lock time;$$$T_{1\rho }^{\omega }$$$ is the $$$T_{1\rho }$$$ value at locking field $$$\omega $$$; $$$N$$$ is the total TSL number.
The image reconstruction model can be expressed asl as follows:
$$\min_{\{X_{\omega ,n}, L, S\}}\ \ ||L||_*+\lambda||TV(S)||_1\ \ \ \ \ s.t.\ \ \left\{\begin{matrix}C(X_{\omega ,n})=L+S, E(X_{\omega ,n})=d, \text{Rank}(L)=1\\ C(X_{\omega ,n})=X_{\omega ,n}\times coef_{\omega ,n}\end{matrix}\right.\ \ \ \ \ \ \ \ \ \ (2)$$
where $$$||L||_*$$$ is the nuclear norm of the low-rank matrix $$$L$$$; $$$TV$$$ is the total variation transform which is applied to the sparse matrix $$$S$$$; $$$||.||_1$$$ is the l1-norm of the matrix; $$$X_{\omega ,n}$$$ is the T1ρ-weighted image at the nth spin-lock time with locking field ω ;$$$\lambda$$$ is a regularization parameter; $$$d$$$ is the undersampled k-space data; $$$C(∙)$$$ performs pixel-wise signal compensation; $$$E$$$ is the encoding operator [8]; $$$\text{Rank}(·)$$$ represents the rank value of the image matrix.
To solve the above equation, an initial compensation coefficient was calculated using the $$$T_{1\rho}$$$ map estimated from the fully sampled central k-space. Iterative hard thresholding of the singular values for $$$L$$$ and a soft-thresholding of the entries for $$$S$$$ was used to solve the optimization problem in Eq. (2). A new $$$T_{1\rho}$$$ map was estimated from the reconstructed images and then used to update the compensation coefficient. The reconstruction and signal compensation coefficient updating steps were repeated alternately until convergence.
The $$$R_{1\rho}$$$ measurements can be estimated using the monoexponential model:
$$M=M_0\text{exp}(-TSL_n\times R_{1\rho})_{n=1, 2, \dots, N}\ \ \ \ \ \ \ \ \ \ (3)$$
where $$$M$$$ is the image intensity obtained at varying $$$TSL_s$$$, $$$M_0$$$ is the baseline image intensity without the application of spin lock pulse.
Evaluation
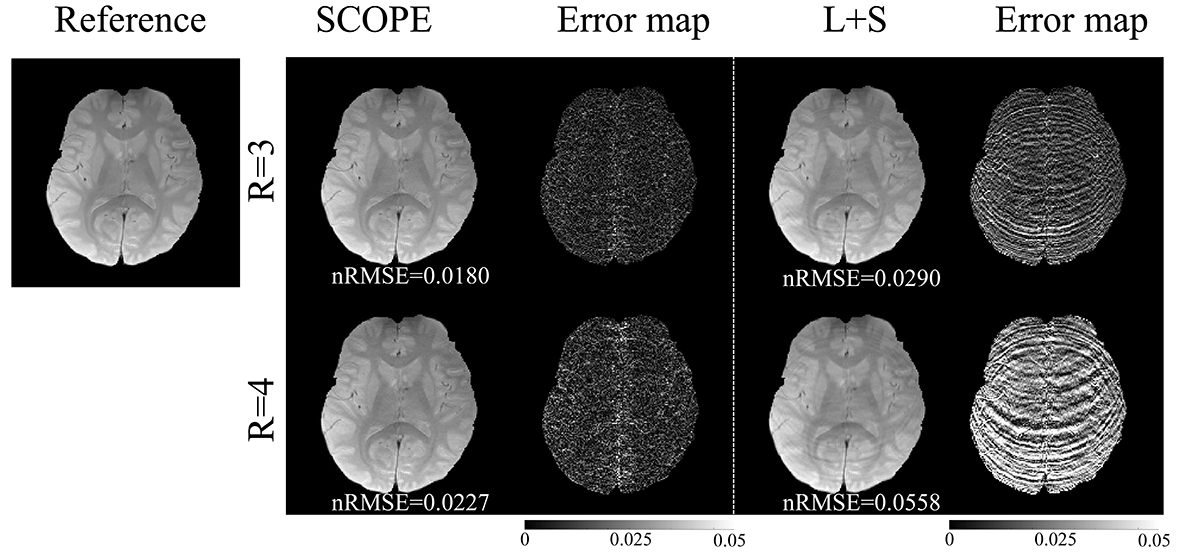
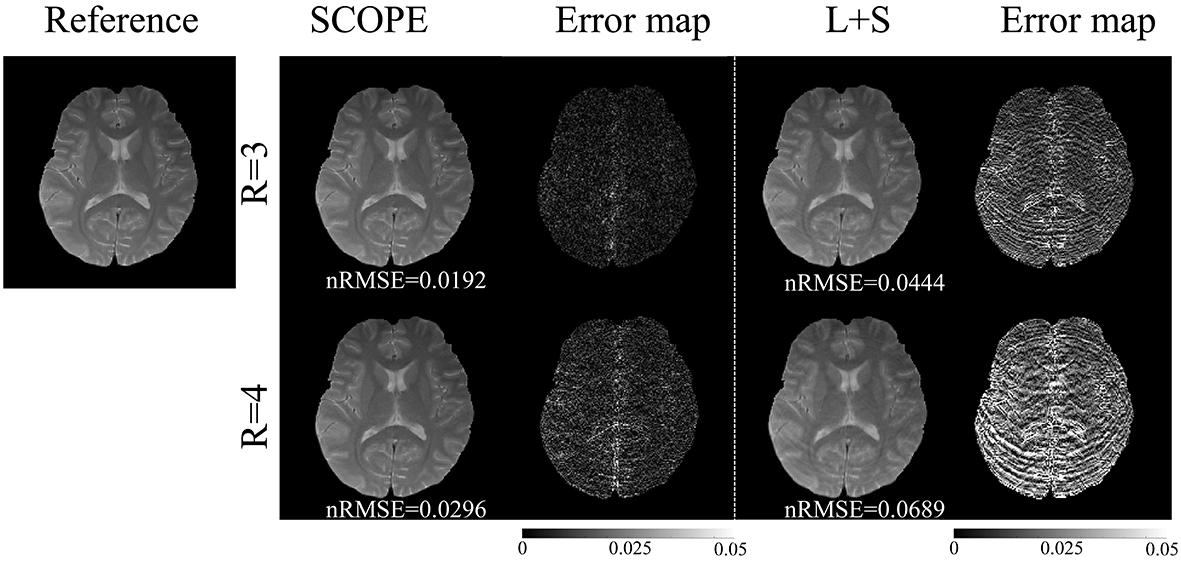
Two in vivo human brain T1ρ -weighted data sets (2 female, age 23±1, IRB proved) were acquired using a 2D fast spin echo (FSE) sequence with a self-compensated paired spin-lock preparation [9]. The MRI scan was performed on a 3T uMR 790 scanner (United Imaging Healthcare, Shanghai, China) using a commercial UIH 32-channel phased-array head coil. Imaging parameters were: TR/TE=4649ms/8.74ms, spin-lock frequency w= 500,3000, and 5000 Hz, FOV=200$$$\times$$$200 mm2, matrix size =192 $$$\times$$$192, slice thickness 5mm, and TSLs =1, 20, 40, 60 ms. The acquired k-space data were retrospectively undersampled along the ky dimension with pseudo-random undersampling acquisition scheme [10] with net acceleration factors R=3 and 4. T1ρ-weighted images were reconstructed by the SCOPE method and L+S method [11]. The quality of the reconstructed images and the estimated T1ρ maps were assessed by normalized root mean square error (nRMSE).Results and discussion
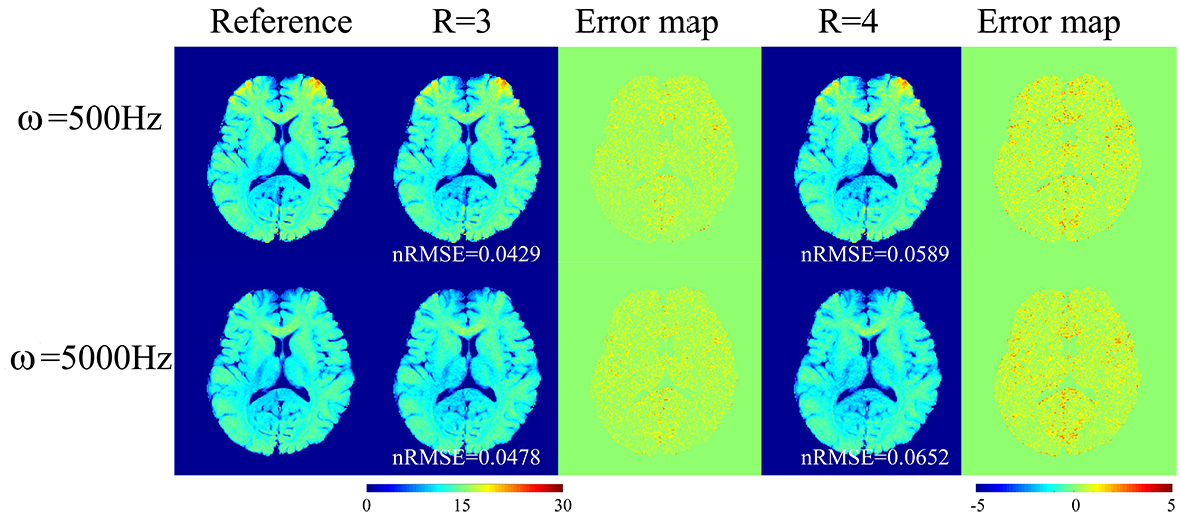
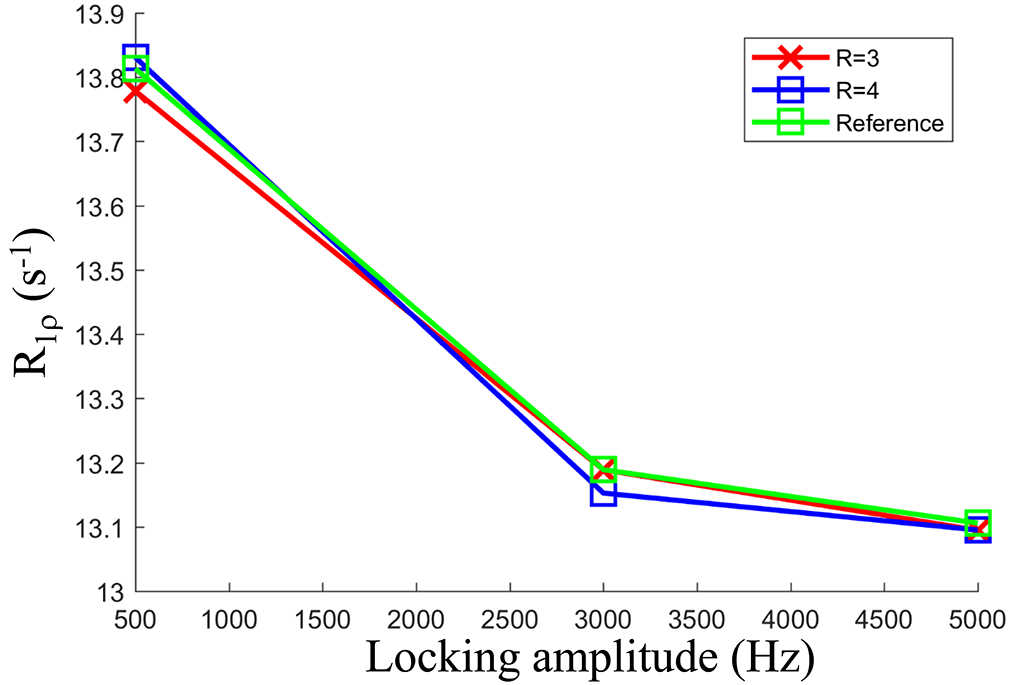
Figure 1 and Figure 2 show the reconstructed T1ρ-weighted images using SCOPE and L+S. Figure 3 shows the estimated R1ρ maps using SCOPE at each acceleration factor for different locking fields. Figure 4 shows the R1ρ dispersion curve of the reconstructed R1ρ maps in selected regions of interest (ROI) using SCOPE with R=3 and 4. The corresponding nRMSEs are shown at the bottom of each image. All reconstructed images and maps using SCOPE are comparable with the reference. Artifacts can be observed in the reconstructed images and maps using L+S, especially at a higher acceleration factor. It can be observed that the SCOPE method achieves better reconstruction quality with lower nRMSEs than the L+S method for all the acceleration factors. The R1ρ dispersion curve of the reconstructed R1ρ maps for each R is highly consistent with the reference .Conclusion
The proposed method can accurately reconstruct the T1ρ-weighted image series and R1ρ dispersion from highly undersampled k-space data, and thereby significantly reduce the scan time of T1ρ imaging.Acknowledgements
This work is supported in part by the National Natural Science Foundation of China under grant nos. 61771463,81971611, National Key R&D Program of China nos. 2020YFA0712202, 2017YFC0108802 , the Innovation and Technology Commission of the government of Hong Kong SAR under grant no. MRP/001/18X, and the Chinese Academy of Sciences program under grant no. 2020GZL006.References
[1]. Davis DG, Perlman ME, London RE. Direct measurements of the dissociation-rate constant for inhibitor-enzyme complexes via the T1ρ and T2 (CPMG) methods. J Magn Reson B 1994;104(3):266-275.2.
[2]. Li X, Han ET, Ma CB, Link TM, Newitt DC, Majumdar S. In vivo 3T spiral imaging based multi-slice T1ρ mapping of knee cartilage in osteoarthritis. Magn Reson Med 2005;54(4):929-936.3.
[3]. Cobb JG, Xie J, Li K, Gochberg DF, Gore JC. Exchange-mediated contrast agents for spin-lock imaging. Magn Reson Med 2012;67(5):1427-1433.4.
[4]. Zu Z, Janve V, Gore JC. Spin-lock imaging of intrinsic susceptibility gradients in tumors. Magn Reson Med 2020;83(5):1587-1595.5.
[5]. Zhou Y, Pandit P, Pedoia V, Rivoire J, Wang Y, Liang D, Li X, Ying L. Accelerating T1ρ cartilage imaging using compressed sensing with iterative locally adapted support detection and JSENSE. Magn Reson Med 2016;75(4):1617-1629.6.
[6]. Zibetti MVW, Sharafi A, Otazo R, Regatte RR. Compressed sensing acceleration of biexponential 3D-T1ρ relaxation mapping of knee cartilage. Magn Reson Med 2019;81(2):863-880.7.
[7]. Zhu Y, Liu Y, Ying L, Peng X, Wang YJ, Yuan J, Liu X, Liang D. SCOPE: signal compensation for low-rank plus sparse matrix decomposition for fast parameter mapping. Phys Med Biol 2018;63(18):185009.8.
[8]. Pruessmann KP, Weiger M, Bornert P, Boesiger P. Advances in sensitivity encoding with arbitrary k-space trajectories. Magn Reson Med 2001;46(4):638-651.9.
[9]. Mitrea BG, Krafft AJ, Song R, Loeffler RB, Hillenbrand CM. Paired self-compensated spin-lock preparation for improved T1rho quantification. J Magn Reson 2016;268:49-57.10.
[10]. Rich A, Gregg M, Jin N, Liu Y, Potter L, Simonetti O, Ahmad R. CArtesian sampling with Variable density and Adjustable temporal resolution (CAVA). Magn Reson Med 2020;83(6):2015-2025.11.
[11]. Otazo R, Candes E, Sodickson DK. Low-rank plus sparse matrix decomposition for accelerated dynamic MRI with separation of background and dynamic components. Magn Reson Med 2015;73(3):1125-1136.
Figures