3080
Robust T2 Mapping from Standard Brain Images: Repeatability and Lifespan Changes in Healthy Participants1Biomedical Engineering, University of Alberta, Edmonton, AB, Canada, 2CancerCare Manitoba, Winnipeg, MB, Canada
Synopsis
Transverse relaxation (T2) mapping from standard images is investigated in human brain using only a proton density and T2-weighted dual-echo turbo spin echo acquisition and applying Bloch fitting approach with transmit field map. In 24 subjects, repeatability of T2 maps was excellent with typically coefficient of variation (CoV) ~1% on the same scanner. In grey and white matter overall, CoV was 0.4%. The method is then applied to study T2 changes across the lifespan from 5-90 years old in 333 healthy participants, providing a normative population of true T2 values independent of refocusing flip angle effects.
Introduction
Transverse relaxation (T2) in the brain is sensitive to many developmental and aging events including myelination, iron accumulation, calcification and water content changes from tissue loss.1,2 T2 weighting is universal in pathological investigations of tissue damage. However, quantitative T2 is rarely used for clinical neuroimaging, since it typically relies on multi-echo spin echo sequences that require long acquisition times for adequate resolution. A solution to introducing quantitative T2 to the clinic is to make use of the weighted images that are already available. For example, in diseases such as multiple sclerosis both T2- and proton density (PD) weighting are recommended in standard protocols.3,4 Fitting these two points to an exponential decay has been common practice for decades, but is highly inaccurate due to imperfect refocusing pulses.5 By modelling the exact pulse sequence and the signal evolution via Bloch simulations, accurate T2 mapping from PD and T2-weighted images becomes possible with adequate SNR.5 While this new technique has been used for retrospective longitudinal studies in MS6 and in multi-site tests,7 its repeatability and changes across the healthy lifespan are not known.Purpose
Apply T2 mapping in healthy brain at 3T via Bloch modelling from PD and T2-weighted images to determine the scan-rescan repeatability in 24 subjects and examine the lifespan variation in 333 subjects aged 5-90 years.Methods
Subjects: 333 healthy volunteers (age 5-90, 187 female/146 male) were imaged at 3T (Prisma, Siemens Medical Systems). An additional 24 volunteers were imaged twice for repeatability measures, mean time between scans 15 ± 29 days.Acquisition: PD-T2 weighted images were acquired using axial-oblique dual-echo 2D turbo spin echo with TR/TE1/TE2 = 4000/10/93 ms, 0.9x0.9x3.5 mm3, 41 slices, FOV 240x180 mm2 in 2 minutes. Nominal refocusing flip angles were mainly 150°. Whole brain B1+ maps were acquired using a dedicated Bloch-Siegert B1+ mapping sequence (turbo-flashed based), axial-oblique, 1.3x1.3x3 mm3, 40 slices, FOV 240x240 mm2 in 39 sec. The exam also included a 3D T1-weighted MPRAGE scan for segmentation.
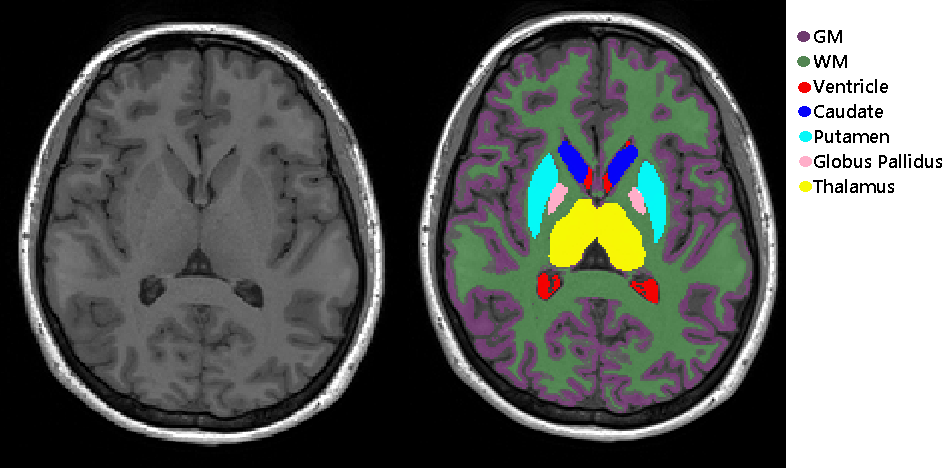
Analysis: T2 maps were calculated by modelling the pulse sequence using the Bloch equations and accounting for the actual flip angles in each voxel from the B1+ map, as previously described.5,8 Prior to fitting, the B1+ maps were registered to the raw PD-T2-weighted images. All segmentations were performed on the T1-weighted images using FSL9 or volBrain10 then transferred to the registered T2 maps. Regions studied included hippocampus, thalamus, putamen, caudate, globus pallidus, amygdala, total white and total grey matter. For scan-rescan, the coefficient of variation (CoV) was determined for each region using all subjects. For lifespan T2 analysis, scatter plots of T2 versus age were fit with a simple 2nd order polynomial.
Results and Discussion
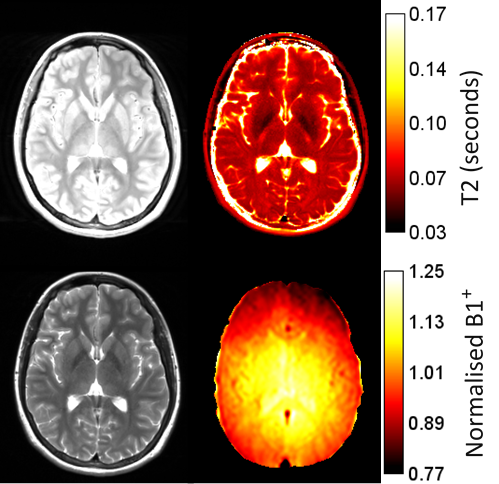
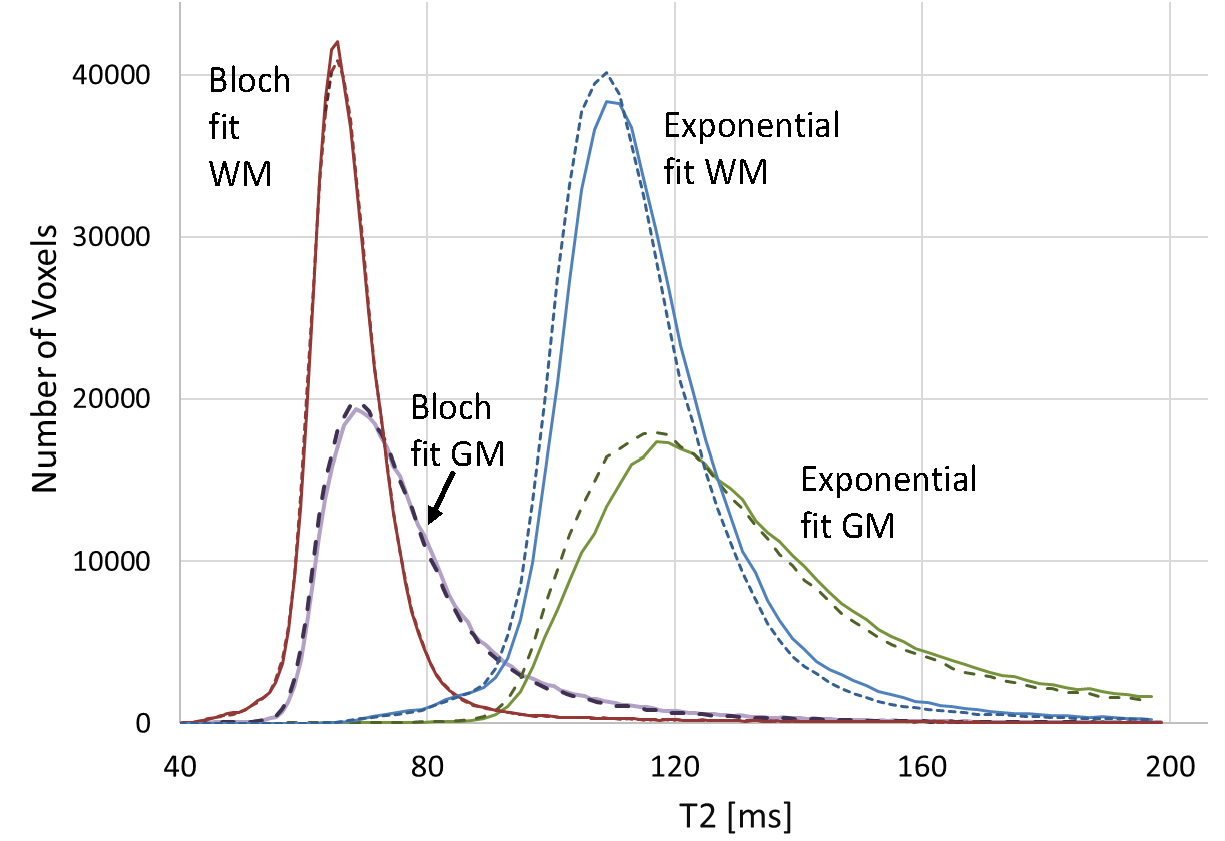
Figure 1 shows the PD and T2-weighted images along with the B1+ map that is needed to produce the T2 map. Note the spatial variation in B1+, and therefore in flip angle. Figure 2 illustrates segmentations for some of the regions under study.An anecdotal example of scan-rescan whole brain T2 histograms is presented in Fig. 3 from one subject, illustrating the high repeatability with the Bloch approach. A basic exponential fit is also shown illustrating severe T2 overestimation arising from the reduced first echo signal when the flip angle is not 180°, and the increased T2-weighted echo signal from stimulated echoes. Poorer repeatability is also evident because an exponential fit does not account for any transmit field variations between scans which might arise from positioning alterations.
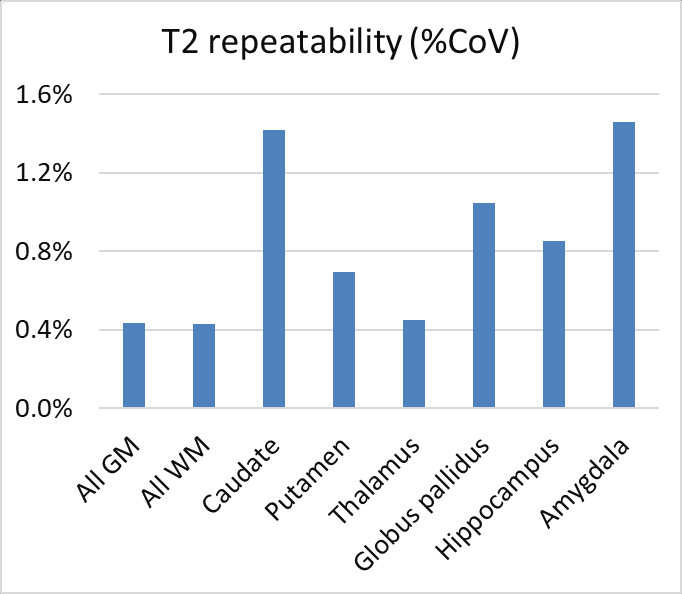
Figure 4 presents the scan-rescan results showing CoVs across all subjects. The values are remarkably small, suggesting that the modelling has taken into account any flip angle variations. The low CoV’s also arise from use of spin echo methods that refocus static field homogeneities, which strongly affect gradient-echo methods.
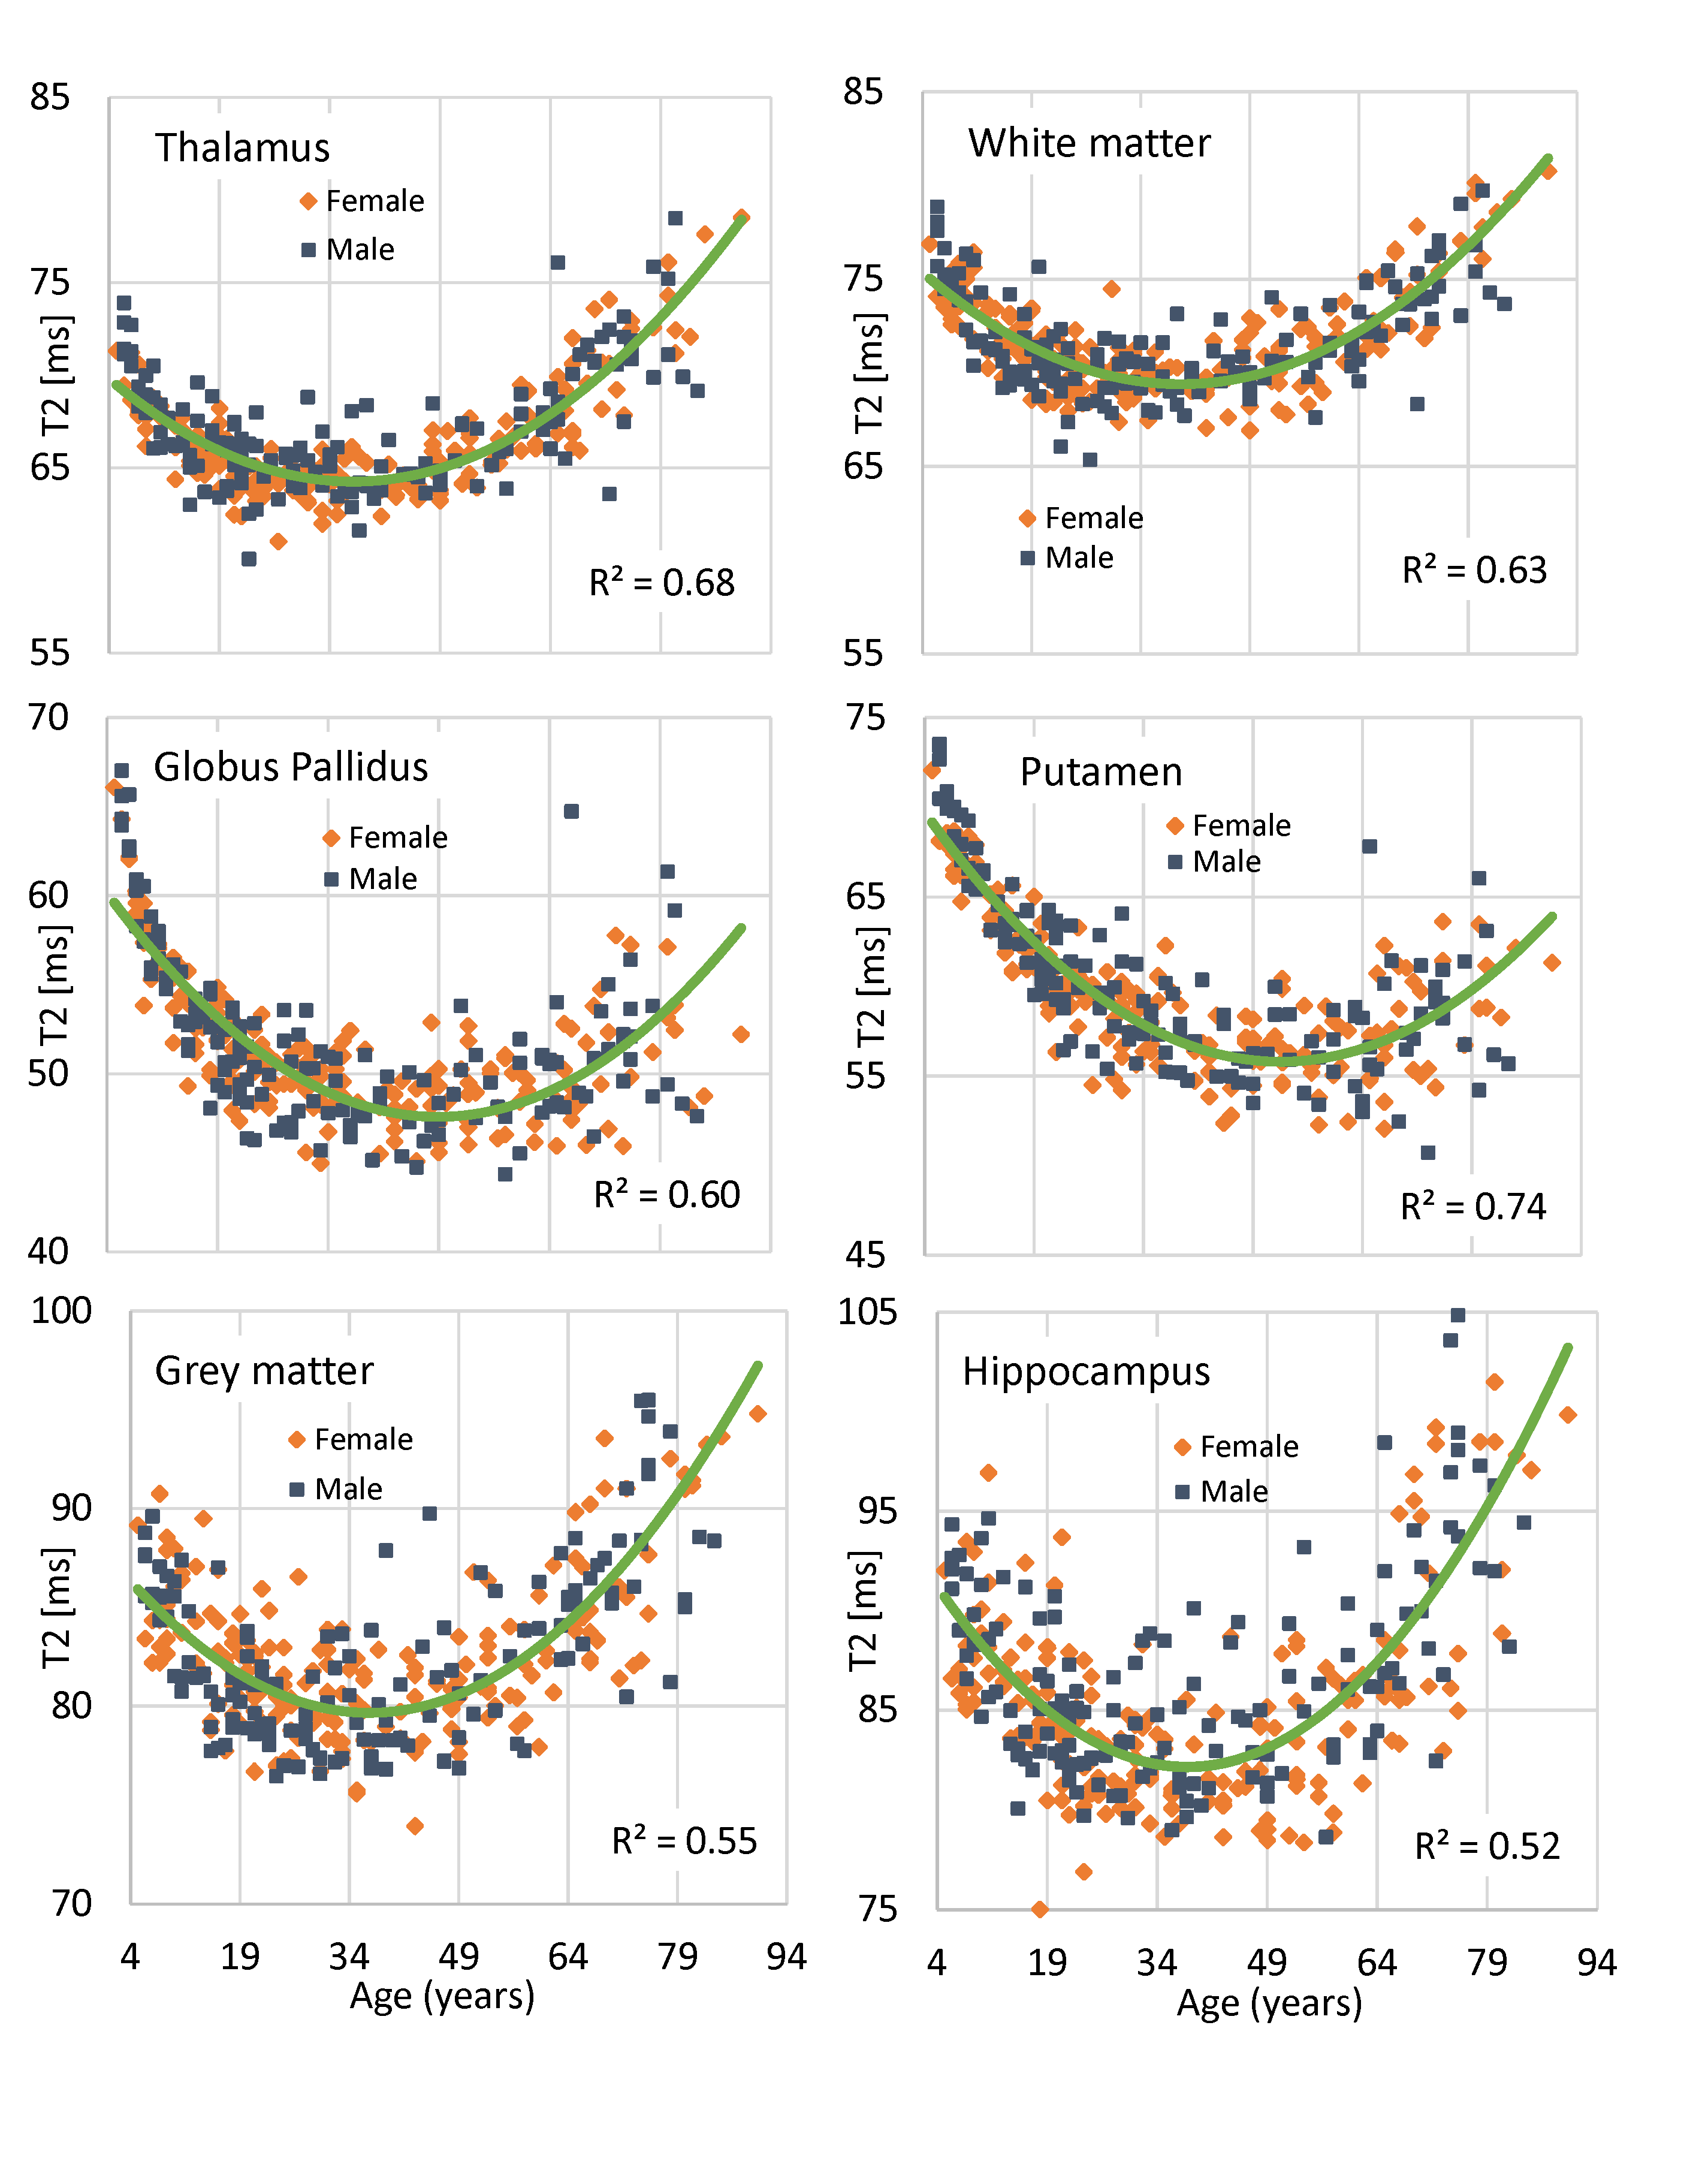
Figure 5 presents the lifespan results from six regions. In general the curves are U-shaped beginning with a T2 decrease during early development from myelination and iron accumulation, then a late life T2 increase as water content increases from tissue loss. In most tissues, the high early life T2 at age 5 years is surpassed in old age, with the exception being iron-rich basal ganglia, where strong iron accumulation leads to less late life T2 increase.
A limitation is the two-point fit which is sensitive to SNR. Nevertheless, with the parameters used here, the repeatability was extremely accurate, within 1% for most structures. For example, in thalamus the CoV was only 0.4%, making it realistic to track subtle longitudinal changes. Second, a B1+ map or estimation is required. Here we used a 39 sec B1+ map, but reduced scan times are possible. In addition, B1+ prediction may be possible in the future using either large B1+ databases, or prescan estimates.
Conclusions
T2 mapping from standard PD and T2-weighted images is shown to be highly repeatable when actual flip angles delivered to each voxel are known and Bloch simulation based fitting is used. Brain changes across the lifespan were demonstrated in a large normative database, providing T2 values independent of refocusing flip angle effects.Acknowledgements
No acknowledgement found.References
1. Leppert IR, Almli CR, McKinstry RC, Mulkern RV, Pierpaoli C, Rivkin MJ, Pike GB; Brain Development Cooperative Group. T2 relaxometry of normal pediatric brain development. J Magn Reson Imaging. 2009;29(2):258-67.
2. Sedlacik J, Boelmans K, Löbel U, Holst B, Siemonsen S, Fiehler J. Reversible, irreversible and effective transverse relaxation rates in normal aging brain at 3T. Neuroimage. 2014 Jan 1;84:1032-41.
3. Filippi M, Preziosa P, Banwell BL, Barkhof F,et al. Assessment of lesions on magnetic resonance imaging in multiple sclerosis: practical guidelines. Brain. 2019;142:1858-1875.
4. Traboulsee A, Simon JH, Stone L, Fisher E, et al. Revised Recommendations of the Consortium of MS Centers Task Force for a Standardized MRI Protocol and Clinical Guidelines for the Diagnosis and Follow-Up of Multiple Sclerosis. AJNR Am J Neuroradiol. 2016; 37(3):394-401.
5. McPhee KC, Wilman AH. T2 Quantification from Only Proton Density and T2-Weighted MRI by Modelling Actual Refocusing Angles. NeuroImage 2015; 118:642-650.
6. Uddin MN, McPhee KC, Blevins G, Wilman AH. Recovery of accurate T2 from historical 1.5 tesla proton density and T2 weighted images: Application to 7-year T2 changes in multiple sclerosis brain. Magn Reson Imaging. 2017; 37:21-26.
7. Chhetri G, McPhee KC, Wilman AH, Bloch Modeling Enables Robust T2 Mapping using Retrospective Proton Density and T2-weighted Image from Different Vendors and Sites. ISMRM 2020, 891.
8. McPhee KC, Wilman AH. Transverse relaxation and flip angle mapping: evaluation of simultaneous and independent methods using multiple spin echoes. Magn Reson Med 2018; 2053 -2063.
9. M. Jenkinson, C.F. Beckmann, T.E. Behrens, M.W. Woolrich, S.M. Smith. FSL. NeuroImage, 62:782-90.
10. José V. Manjón and Pierrick Coupe. volBrain: an online MRI brain volumetry system. Frontiers in Neuroinformatics. 2016.
Figures