3077
Single-shot Simultaneous Double-slice T2 Mapping based on Overlapping Echo Detachment Planar Imaging1Department of Electronic Science, Xiamen University, Xiamen, China
Synopsis
Most quantitative magnetic resonance imaging (qMRI) techniques remain time-consuming and sensitive to motion, especially when large volume imaging is needed. Simultaneous multi-slice (SMS), which is not restricted by single-slice evolution time, is an acceleration method for MRI. Here we propose a flexible SMS T2 mapping method based on overlapping echo detachment (OLED) planar imaging. Experimental results demonstrate the superior performance of our method. Reliable multi-slice T2 maps can be obtained in a single shot within milliseconds for the first time.
Introduction
Quantitative magnetic resonance imaging (qMRI) can quantify the properties of tissues. Among many outstanding features of qMRI, the most obvious advantage is that qMRI results are mainly determined by tissue properties, so they are highly repeatable and comparable. Although qMRI is of great importance in medical field, but the long acquisition time limits its application. Recently, overlapping-echo detachment (OLED) method is proposed and applied for single-shot T2 mapping1,2 and diffusion mapping3. On the other hand, simultaneous multi-slice (SMS)4 method obtains multi-slice images through exciting and acquiring multi-slice signals simultaneously, which helps shorten the scan time. In this work, we propose a single-shot SMS-OLED T2 mapping method to further accelerate T2 mapping. SMS-OLED inherits the advantages of both OLED and SMS method. It can relieve the demand for scan time and reliable multi-slice T2 maps can be obtained in milliseconds.Methods
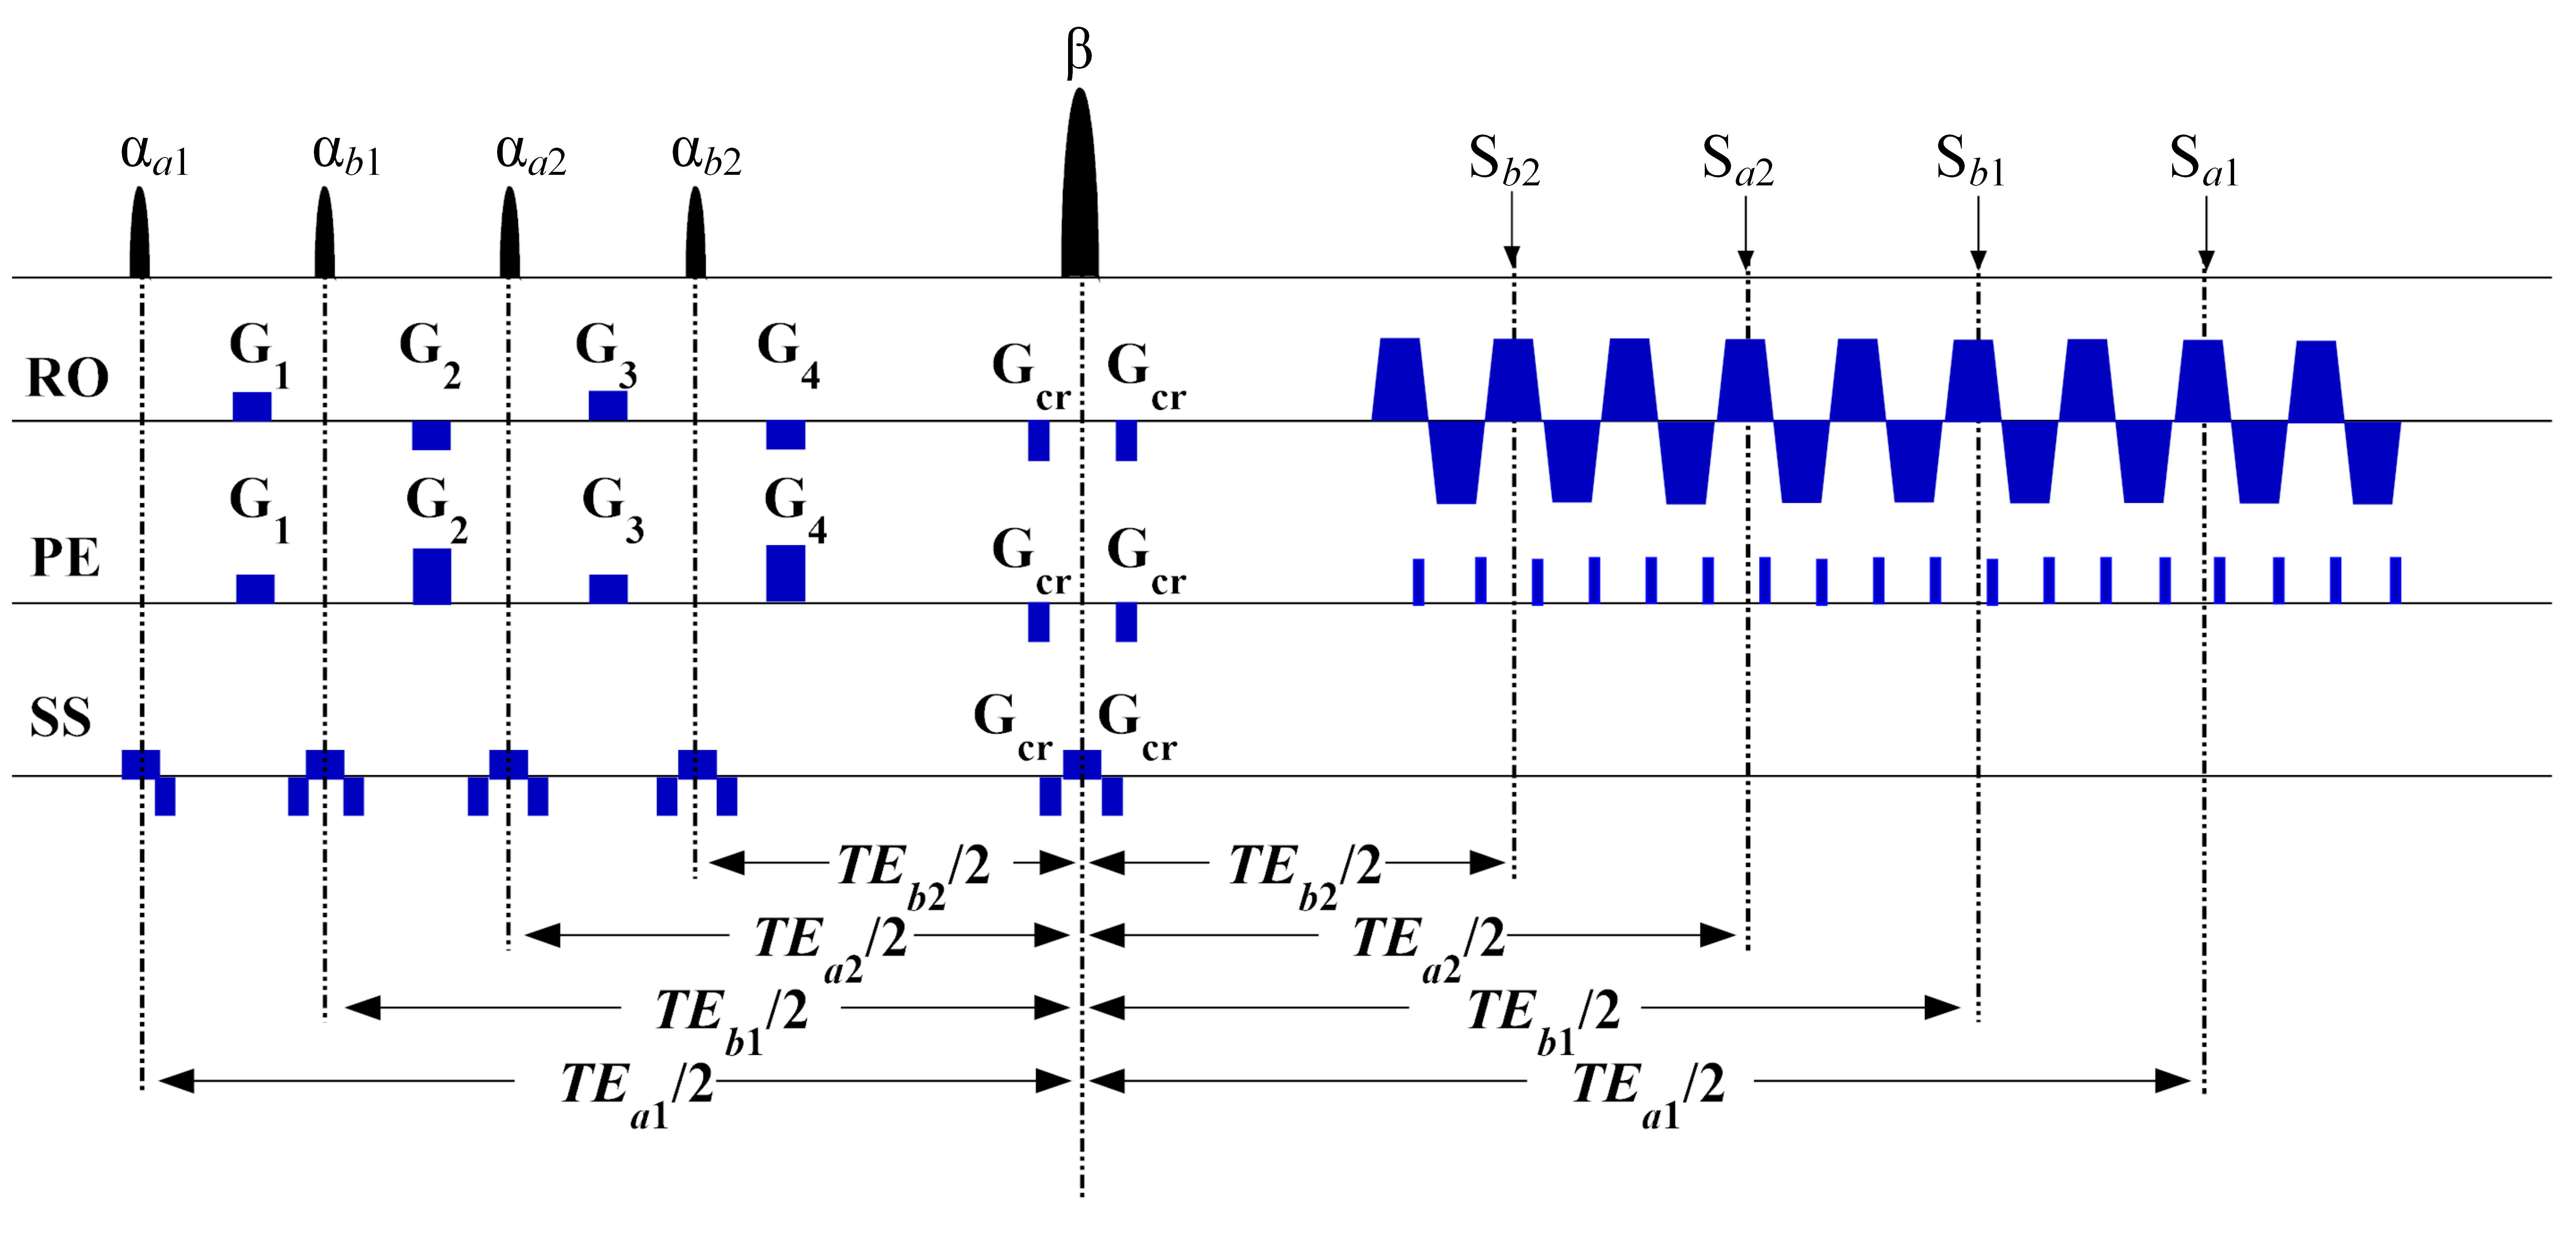
Experiments: A double-slice SMS-OLED T2 mapping sequence was used to verify our method. The pulse sequence is shown in Figure 1. In vivo rat head experiments were performed on a 7T MRI system (Agilent Technologies) at 298 K. The main magnetic field B0 was shimmed to ensure that the inhomogeneity of B0 was less than 300 Hz. Only a receiver coil was used to acquire signals. The pulse flip angles are α = 45° and β = 180°. The lower slice was taken as slice a and the upper slice as slice b. The thickness of each slice was 2 mm, and the slice-to-slice gap was 4 mm, 6 mm, 8 mm, and 10 mm respectively. Multi-scan multi-slice SE sequence was utilized to provide reference T2 maps. Four different TEs were selected for the SE sequence, ranging from 15 ms to 135 ms, TR = 2.0 s.Image reconstruction: U-Net was used to reconstruct multi-slice T2 maps from the acquired SMS-OLED data. For network training, we generated a training dataset through simulation2, and various non-ideal factors were taken into account to improve network robustness. Since signals of two slices need to be simulated, we used two different two-dimensional numerical models (including T1, T2, M0) to represent different slices in each sample. The matrix size of each model was 500×500. The T2 and M0 textures of these models were randomly generated. The T2 values were between 0 and 350 ms, and the relative M0 values were between 0 and 1. The T1 value was set to 2000 ms (actual T1 is usually larger than 1000 ms, and has little effect on signals). The SMS-OLED acquisition was simulated with MRiLab software. The parameters of the pulse sequence used in the simulations were: TEb2 = 37.65 ms, TEa2 = 53.53 ms, TEb1 = 85.27 ms, TEa1 = 101.14 ms. 2500 simulated images were employed as the training dataset and 250 simulated images as the validation dataset. The real and imaginary parts of the images were used as inputs of the two-channels of the network, and the T2 maps of two corresponding numerical models were used as the labels. The Adam optimizer was used in the network. The loss function was calculated as the sum of the mean square error and a regularization term2. Before the acquired SMS-OLED data were sent to the trained network for T2 maps reconstruction, a phase search algorithm5 was used to reduce the Nyquist ghost.
Results
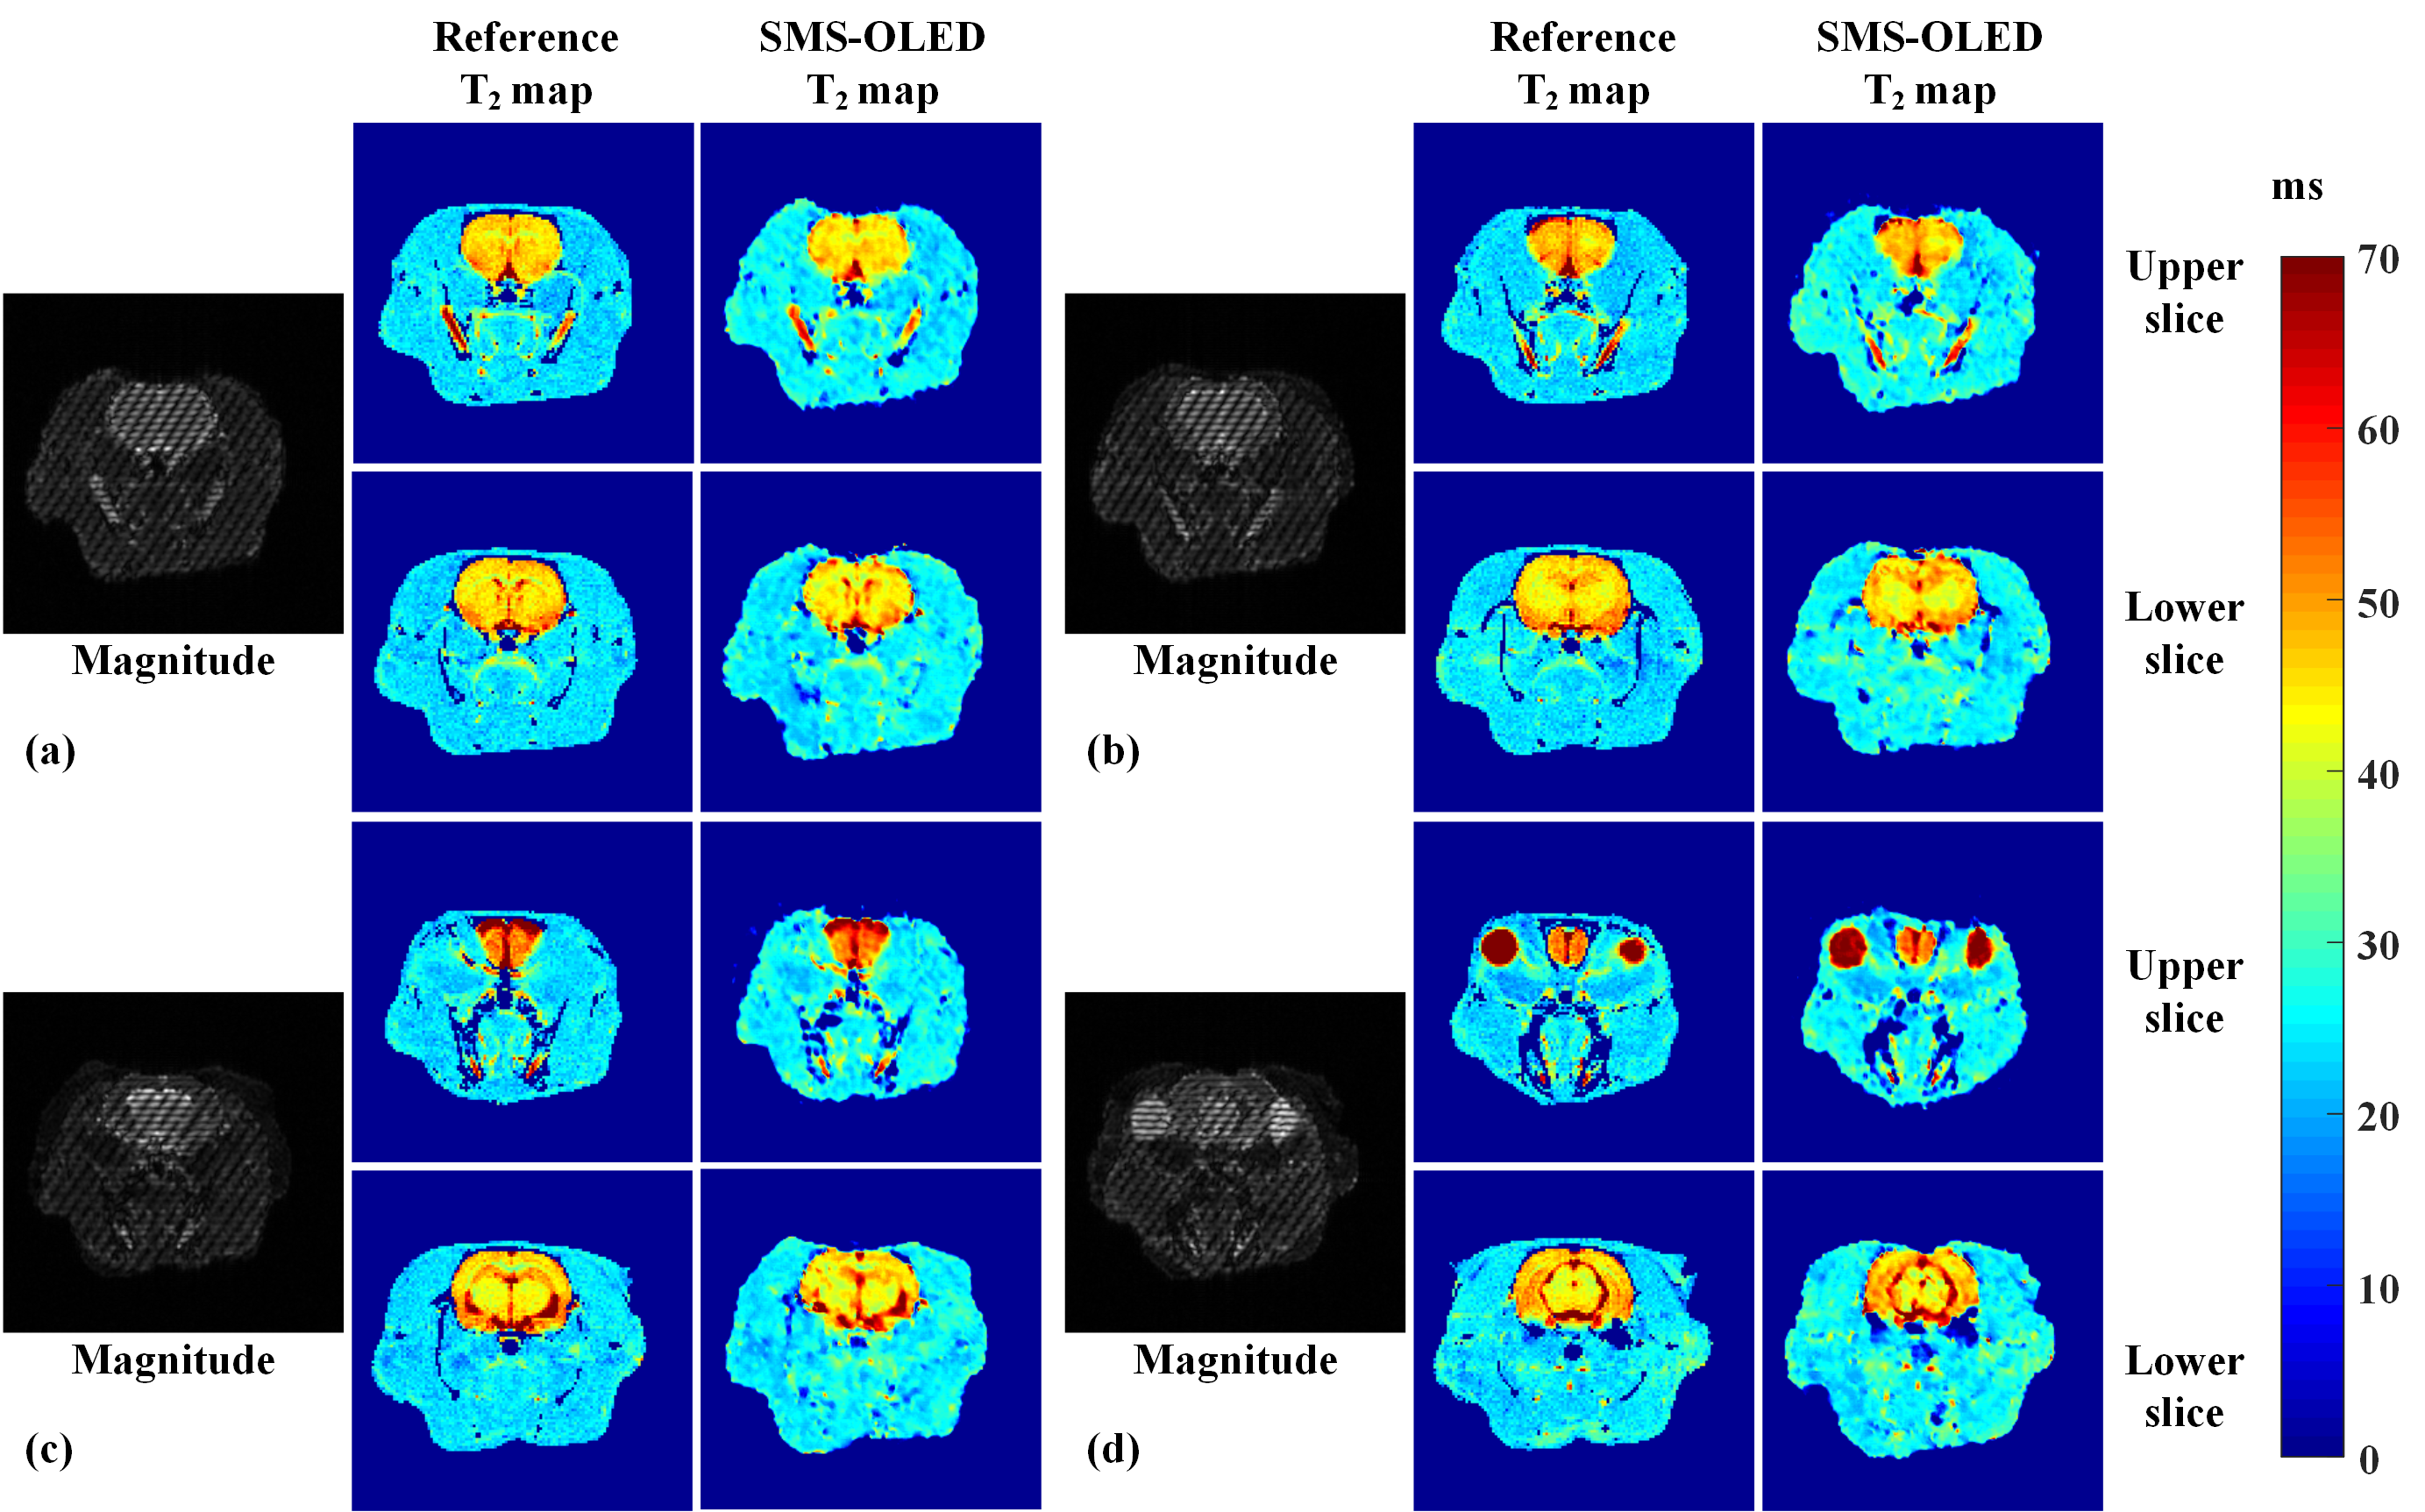
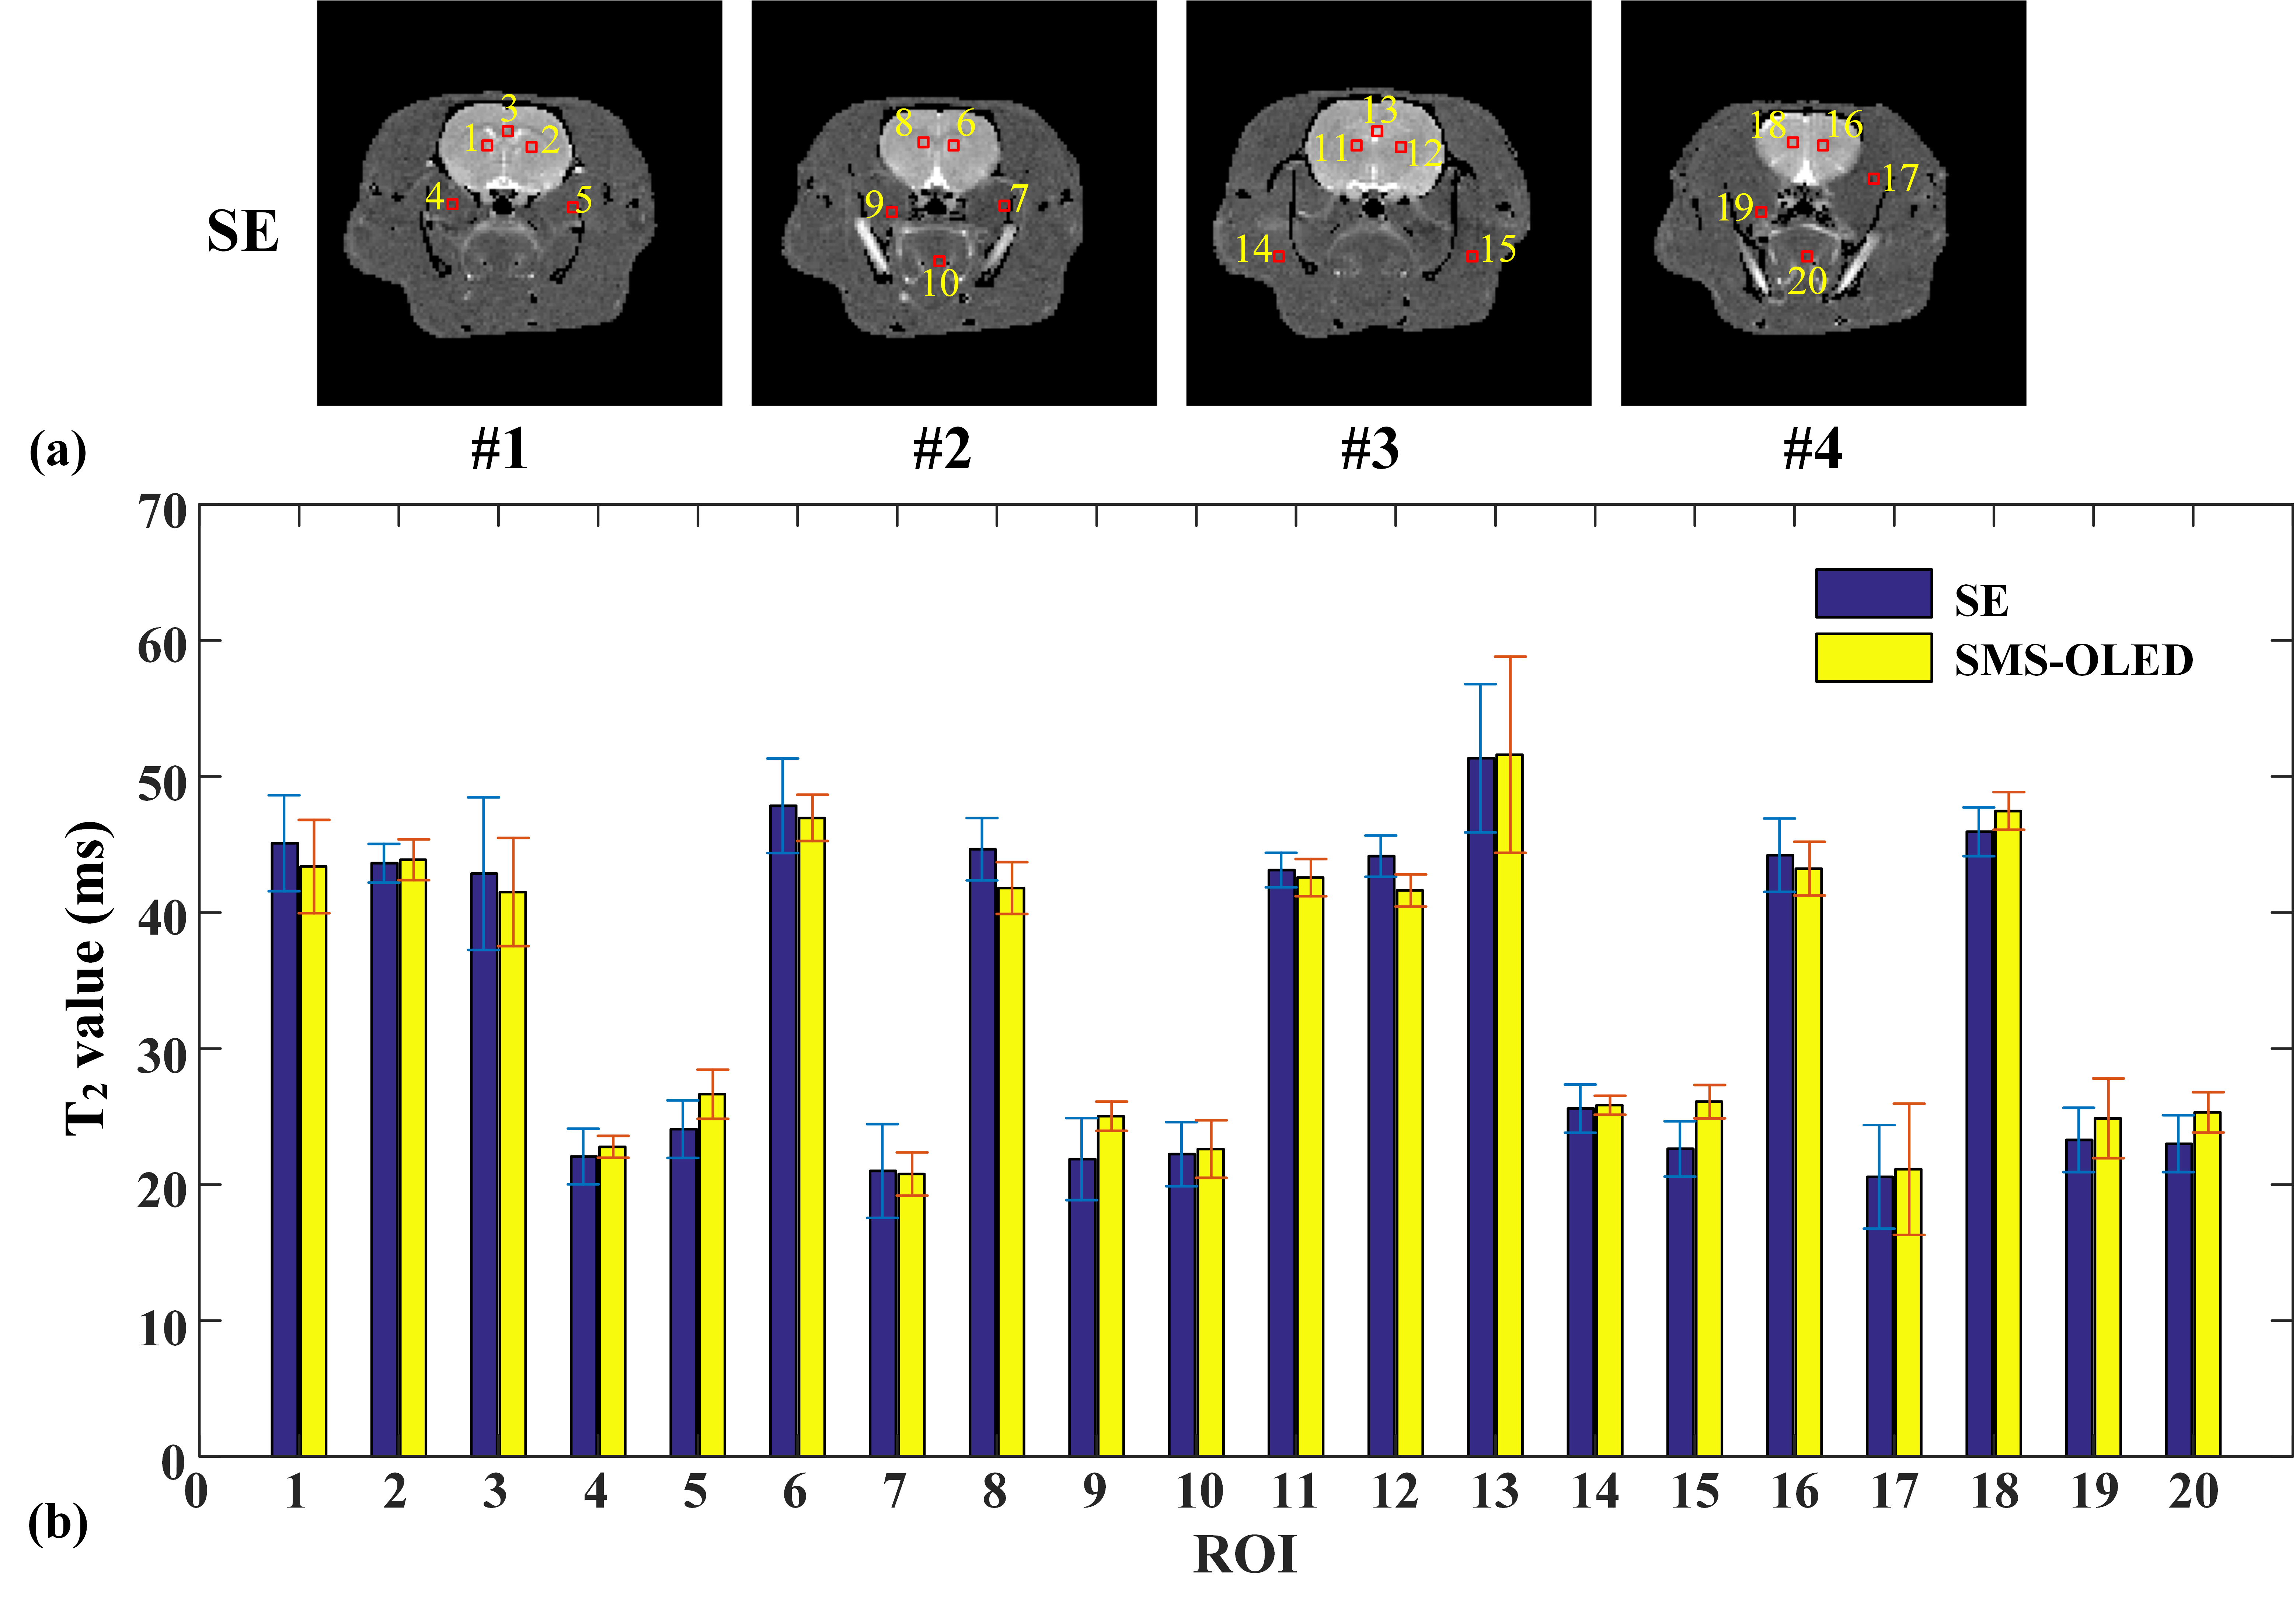
The results of in vivo rat head experiments under different slice-to-slice gaps are shown in Figure 2. The T2 values in the SMS-OLED results are close to those in the references. To further evaluate the reconstruction results, the mean and the corresponding standard deviation (SD) of T2 values of 20 regions of interest (ROI) were calculated. The ROIs were selected in the brain (regions 1, 2, 3, 6, 8, 11-13, 16, 18) and head muscle areas (Figure 3a). The means and SDs of the T2 values in the 20 ROIs were calculated, and the results are shown in Figure 3(b). In regions 1-10, the R2 between the SMS-OLED results and the references is 0.9928 when the gap is 4 mm. In regions 11-20, the R2 is 0.9923 when the gap is 6 mm.Conclusion
SMS-OLED is an efficient method for multi-slice T2 mapping simultaneously in a single shot. The results from SMS-OLED are comparable with references.Acknowledgements
This work was supported by the National Natural Science Foundation of China under grant numbers 11775184 and 81671674, and the Science and Technology Project of Fujian Province of China under grant number 2019Y0001.References
[1] Cai CB, Zeng YQ, Zhuang YC, et al. Single-shot T2 mapping through overlapping-echo detachment (OLED) planar imaging. IEEE Trans. Biomed. Engineering, 2017; 64: 2450-2461.
[2] Zhang J, Wu J, Chen SJ, et al. Robust single-shot T2 mapping via multiple overlapping-echo acquisition and deep neural network. IEEE Trans. Med. Imaging, 2019; 38: 1801-1811.
[3] Ma LC, Cai CB, Yang HY, et al. Motion-tolerant diffusion mapping based on single-shot overlapping-echo detachment (OLED) planar imaging. Magn. Reson. Med., 2018; 80: 200-210.
[4] Zahneisen B, Ernst T, Poser BA, et al. SENSE and simultaneous multislice imaging. Magn. Reson. Med., 2015; 74:1356-1362
[5] McKay JA, Moeller S, Zhang L, et al. Nyquist ghost correction of breast diffusion weighted imaging using referenceless methods. Magn. Reson. Med., 2019; 81:2624-2631
Figures