3075
High spatial and temporal resolution rapid 3D IR-radFLASH pulse sequence for T1 mapping in the brain1Department of Radiology, Stanford University, Palo Alto, CA, United States, 2Electrical Engineering, Stanford University, Palo Alto, CA, United States, 3Electrical and Computer Engineering, The University of Arizona, Tucson, AZ, United States, 4Department of Medical Imaging, The University of Arizona, Tucson, AZ, United States
Synopsis
A 3D IR-radFLASH pulse sequence and a corresponding model-based reconstruction algorithm is presented for in vivo brain T1 mapping. The proposed pulse sequence can acquire data for high SNR 1.0mm isotropic resolution T1 mapping within clinical time constraints. The proposed model-based reconstruction algorithm can reconstruct the acquired data with high temporal resolution, which can be used to map spin species with relatively low T1 values. When combined with a slab-selective inversion pulse, the proposed technique can achieve whole brain coverage under 5 minutes.
Introduction
The quantitative measurement of the spin-lattice relaxation time (T1) provides valuable information for disease diagnosis including various neurological disorders[1,2,3]. However due to clinical time constraints, T1 measurements are usually done with lower spatial and temporal resolutions. The lowered spatial resolution has the potential to make it more difficult to uncover smaller lesions, while the lowered temporal resolution will impact the accuracy of the T1 measurements.Here we present a 3D Inversion-recovery (IR) radial FLASH (3D IR-radFLASH) technique together with a model-based reconstruction that yields high spatial and temporal resolution T1 data within clinical scan constraints. The pulse sequence is based on the Look-Locker approach which has a higher tolerance to B1 inhomogeneity and the model-based reconstruction algorithm can reconstruct TI images with temporal resolution as high as 4.35ms for T1 mapping. The technique is demonstrated for high resolution brain imaging to yield 1.00mm isotropic resolution T1 data for the whole brain in under 5 minutes.
Technique and methods
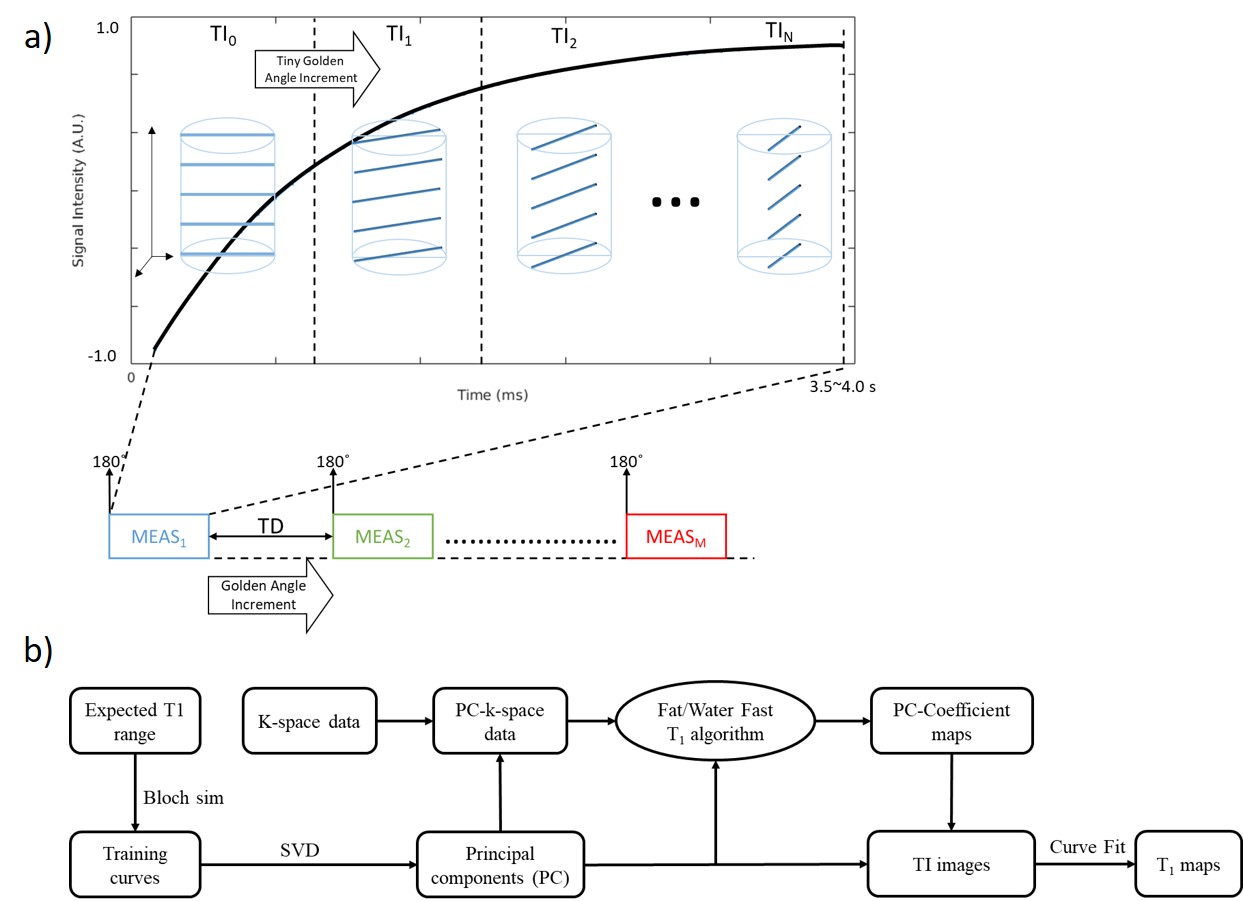
Data acquisition: The diagram of the 3D IR-radFLASH, implemented on a Siemens 3T Skyra scanner, is shown in Figure 1(a). Tiny golden angle[4] view-ordered 3D stack-of-stars data is continuously acquired following an 180˚ slab-selective adiabatic inversion pulse using a fixed flip angle (FA) of 10˚, TE=2.28ms, TR=4.35ms. Data acquisition goes along the k-z direction first during the recovery of the IR pulse. To complete the acquisition, spins are re-inverted M=13 times, each after a time delay (TD) to allow for recovery. The angle of the radial views between M measurements is increased by a golden angle. To make the data acquisition efficient, multiple slabs are prescribed, so that during the TD of one slab, data acquisition can immediately start for a different slab, eliminating the need of a dead time during the TD.Data were acquired on a custom-made phantom with 5 slabs to cover 6 partitions/slab with 38.5% k-z oversampling. Whole brain data (with 6 slabs with 26 partitions and 25% k-z oversampling per slab) with 1.00mm isotropic resolution were acquired under 5 minutes.
Data reconstruction: The reconstruction flow chart is shown in Figure 1(b). A Bloch simulation is first carried out with expected T1 values to generate a set of training T1 recovery curves. A singular value decomposition is used to obtain the corresponding principal components (PC). The model-based reconstruction uses the PCs on the collected k-space data to obtain so-called PC-k-space data in PC space. A compressed sensing iterative algorithm that solves Eq.1 is then applied on the PC-k-space data to reconstruct the PC coefficient maps, which are converted to TI images based on the aforementioned PCs.
$$\hat{\textbf{M}}=\operatorname*{arg\,max}_{\textbf{M}}\sum_{j=1}^{\#Coils}\sum_{i=1}^{L}||FT_{i}\{\textbf{C}_{j}\textbf{M}\}\vec{\hat{B}}-\textbf{K}_{i,j}||_{2}^{2}+\sum_{k=1}^{L}\lambda_{k}TV_{k}(\textbf{M})...[Eq.1]$$
Curve fitting is carried out to generate the T1 maps. Since the acquired k-space data was converted into the PC-k-space before the iterative recon, the temporal resolution of the reconstructed TI image series can be determined by the PC generation process in the Bloch simulation.
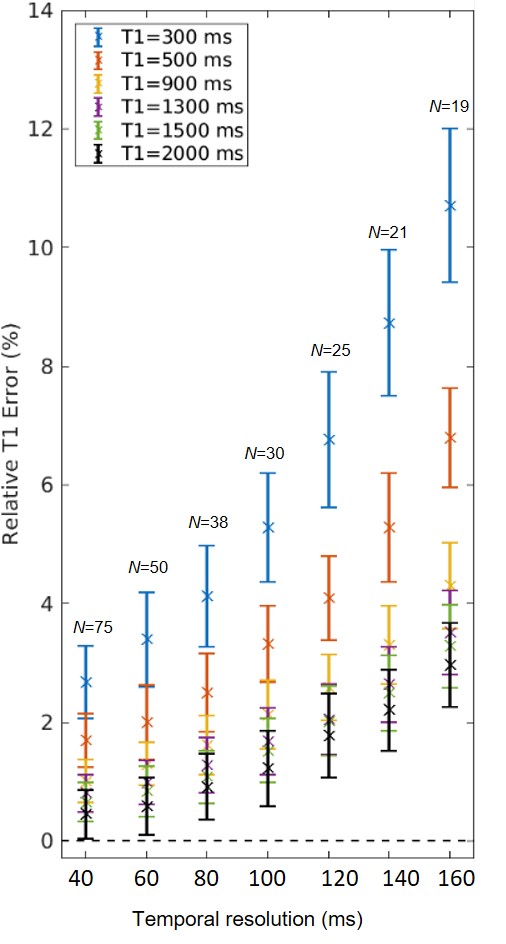
Computer simulation: Bloch simulations were performed to verify the effect of the temporal resolution on T1 estimation. T1 curves were generated using the spoiled gradient echo signal model with the following parameters: TR=4.0 ms, TE=2.0 ms, FA=10°. Complex Gaussian noise was added to the complex signals for 100 random noise realizations. A noise level of 32 dB was chosen to match out in vivo data.
Results and discussion
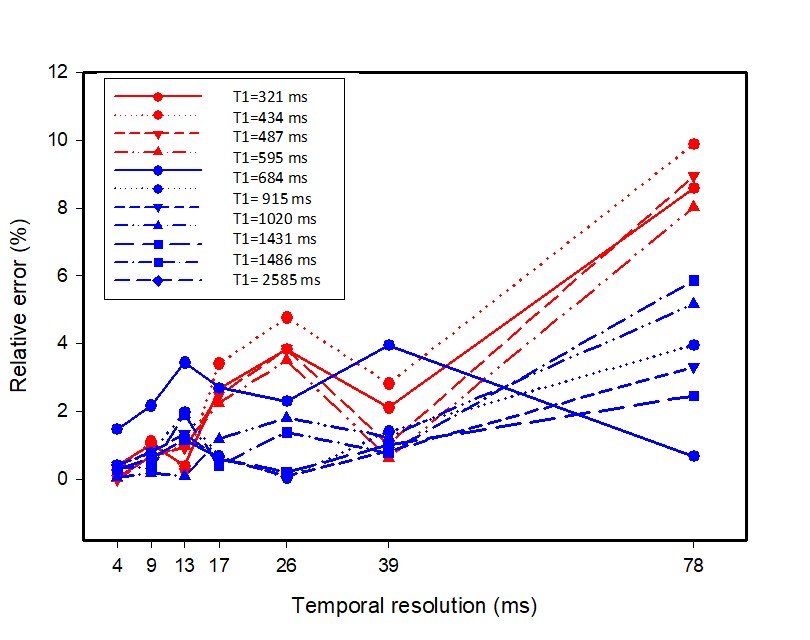
Figure 2 shows the results of the Bloch simulations illustrating the effect of temporal resolution on T1 estimation. While a higher temporal resolution improves T1 estimation, the effect is more important for spin species with low T1 values (e.g., 300-500ms). Results on phantom data reconstructed with different temporal resolutions follow the same trend (Figure 3) with shorter T1 phantoms (red symbols) having larger errors at lower temporal resolutions compared to those with higher T1 values (blue symbols). Note that up to a temporal resolution of 39ms the T1 error is below 4% for all phantoms.While it is desirable to reconstruct data at the highest temporal resolution, we have to account for reconstruction speed and computational resources. Higher temporal resolution yields more TI images increasing computational resources and time. A temporal resolution of ~40 ms is a good compromise between T1 accuracy and computational demand.
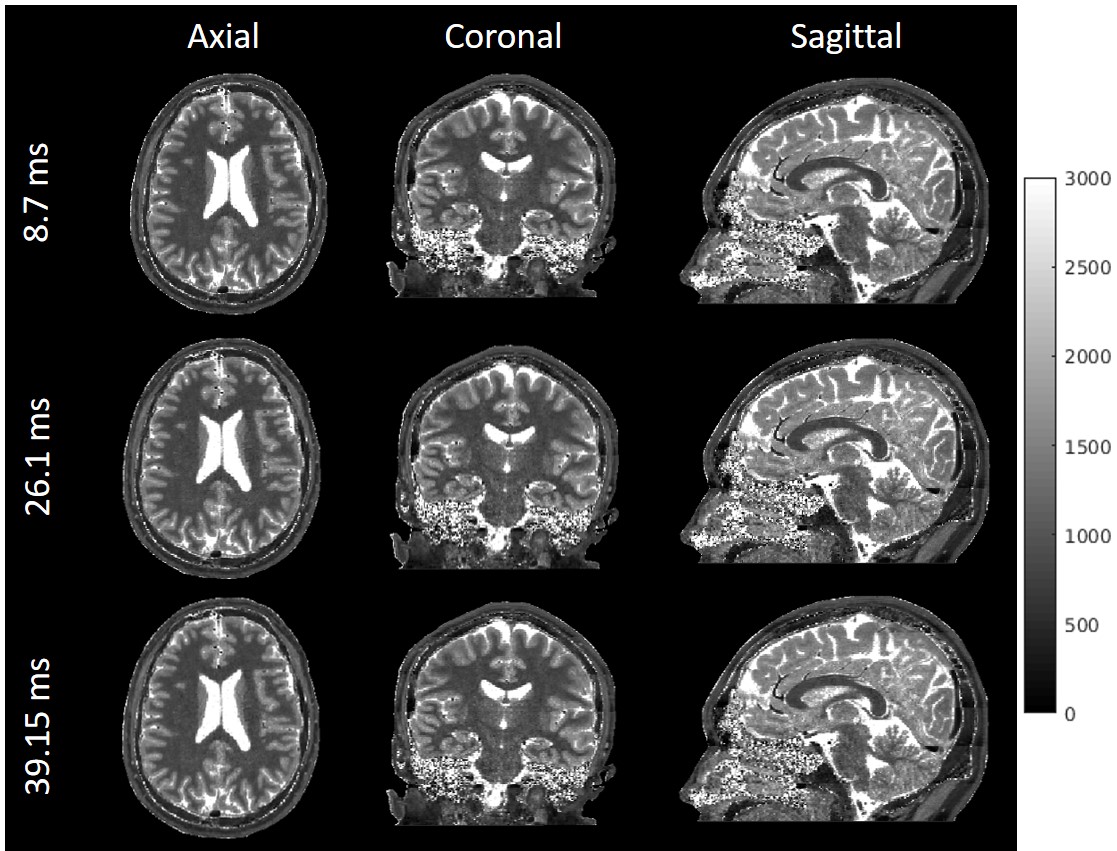
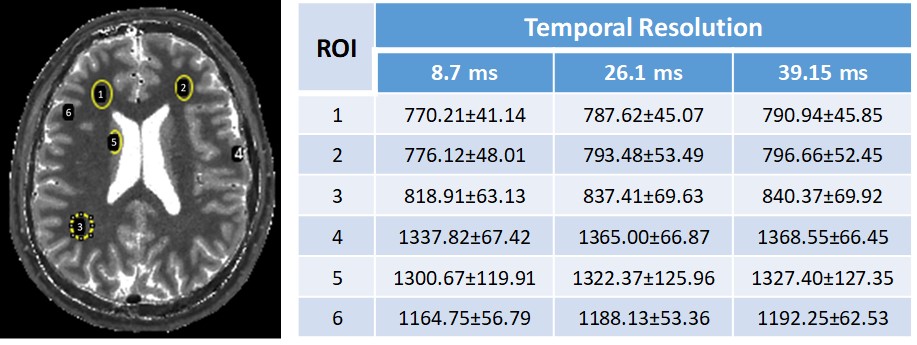
Figure 3 shows in vivo brain T1 maps acquired with 3D IR-radFLASH and reconstructed using temporal resolutions of 8.7ms, 26.1ms, and 39.2ms. Note that the T1 maps reconstructed at different temporal resolutions have similar reconstruction quality, with minimal undersampling artifacts even at the temporal resolution of 8.7ms, despite the high degree of undersampling (0.5-2.2% kx-ky undersampling relative to Nyquist for the range of 8.7-39.2ms temporal resolutions). A ROI analysis presented in Table 1 for regions in the gray and white matter show that T1 values are comparable among the three temporal resolutions. These also match literature reported values[5].
Conclusion
A B1 insensitive, 3D technique based on an IR radial FLASH technique combined with a model-based reconstruction was demonstrated for T1 mapping of the brain. T1 maps with high spatial and temporal resolutions and high SNR can be acquired within a clinically viable time. The proposed technique is a significant improvement over existing T1 mapping methods used in the clinic.Acknowledgements
The authors would like to acknowledge support from NIH (grant R01CA245920), the Arizona Biomedical Research Commission (Grant ADHS14-082996), and the Technology and Research Initiative Fund (TRIF) Improving Health Initiative.References
1 Woerman FG, Free SL, Koepp MJ, Ashburner J, Duncan JS. Voxel-by-voxel comparison of automatically segmented cerebral gray matter—a rater-independent comparison of structural MRI in patients with epilepsy. NeuroImage. 1999;10:373-384.
2 Larsson HB, Frederiksen J, Petersen J, Nordenbo A, Zeeberg I, Henriksen O, Olesen J. Assessment of demyelination, edema and gliosis by in-vivo determination of T1 and T2 in the brain of patients with acute attack of Multiple Sclerosis. Magn Reson Med. 1989;11:337–348.
3 Williamson P, Pelz D, Merskey H, Morrison S, Karlik S, Drost D, Carr T, Conlon P. Frontal, temporal and striatal proton relaxation times in schizophrenic patients and normal comparison subjects. Am J Psych. 1992;149:549-551.
4 Wundrak S, Paul J, Ulrici J, Hell E, Geibel MA, Bernhardt P, Rottbauer W and Rasche V. Golden ratio sparse MRI using tiny golden angles. Magn Reson Med. 2016;75:2372-2378.
5 Lee CE, Baker EH, Thomasson DM. Normal regional T1 and T2 relaxation times of the brain at 3T. In: Proc. Intel. Soc. Mag. Reson. Med; 2006.
Figures