3074
T1 Relaxation of White Matter Following Adiabatic Inversion1Physics & Astronomy, University of British Columbia, Vancouver, BC, Canada, 2Radiology, University of British Columbia, Vancouver, BC, Canada, 3UBC MRI Research Centre, Vancouver, BC, Canada
Synopsis
Adiabatic pulses have advantageous properties, such as an independently scalable bandwidth, which makes them more clinically versatile compared to standard soft pulses. However, their application to white matter has produced some unvalidated assumptions about the subsequent relaxation mechanisms. We examined the form of the longitudinal relaxation following adiabatic inversion in-vivo with simple inversion recovery experiments, which we found to be biexponential in character. This arises from cross-relaxation/exchange between aqueous and non-aqueous tissue components prepared in different magnetization states. We suggest a straightforward and accessible scheme for reproducible measurements of monoexponential T1 using a specific saturation recovery method.
Introduction
Longitudinal relaxation in white matter (WM) following a frequency-selective ‘soft’ inversion pulse has been shown to be biexponential in character. This can be explained by a two-pool framework1-6. If the initial magnetization states of the two pools differ, magnetization exchange between the protons in water and those attached to non-aqueous molecules like lipids may lead to an additional ‘short’ T1 component. Adiabatic pulses, valuable clinically for having uniform flip angle over large bandwidth, are often assumed to saturate the non-aqueous pool7-9. Understanding the relation between the initial non-aqueous state and relaxation is key when measuring an accurate T1. We previously demonstrated in an ex-vivo sample10 that an adiabatic pulse does not saturate the non-aqueous magnetization and now investigate the longitudinal relaxation following adiabatic excitation in-vivo. We used ‘long’ saturation and soft sinc-Gauss pulses to compare as limiting cases, where monoexponential relaxation is to be expected in the former and biexponential in the latter.Methods
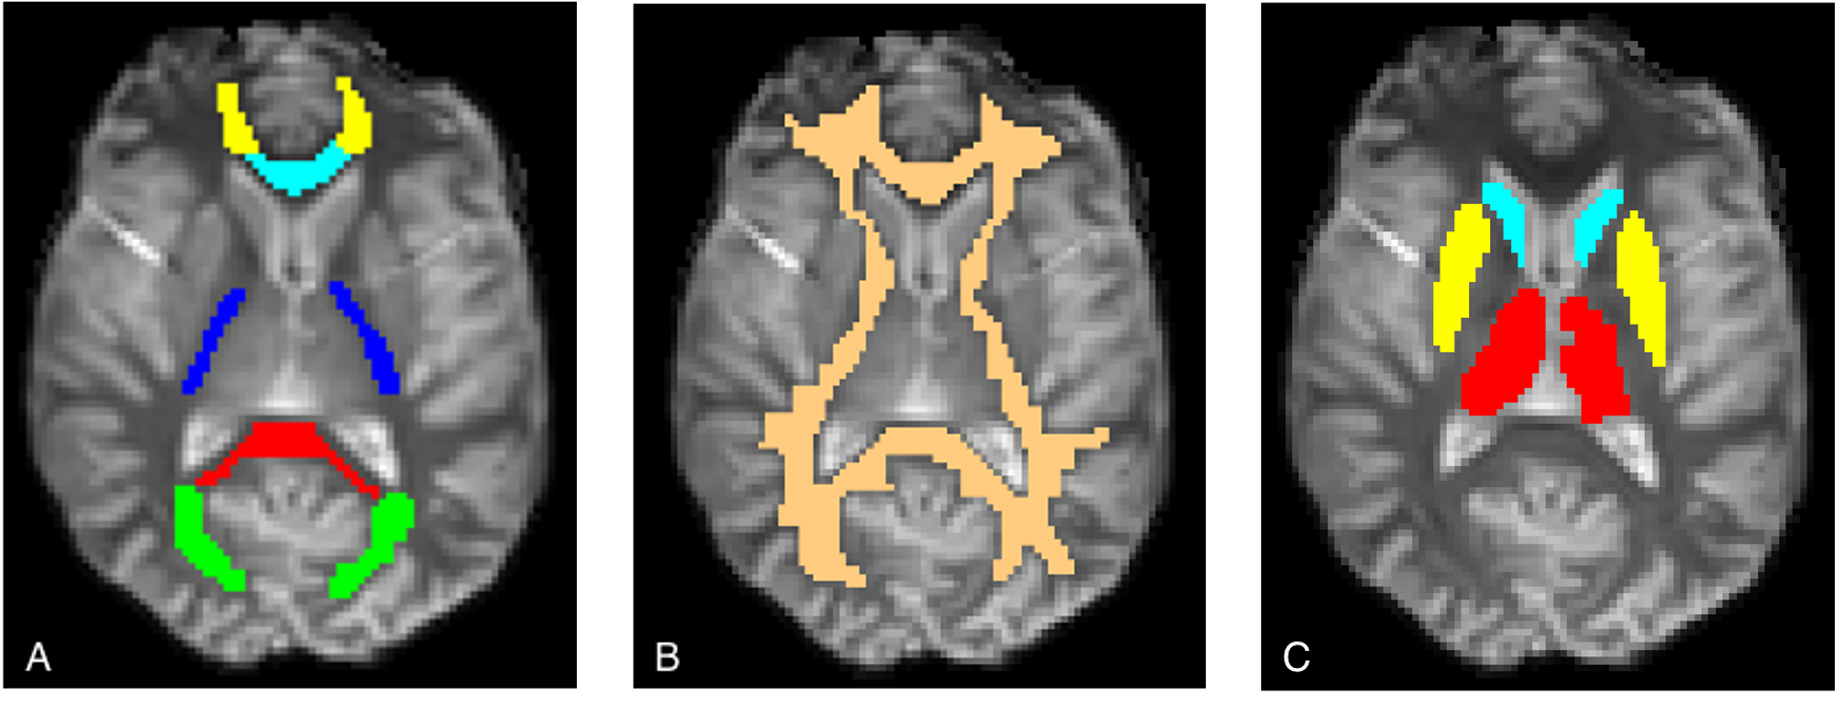
Experiments: One healthy subject (female, age 41) participated in this study. All experiments were performed with a Philips Ingenia Elition 3T clinical MRI scanner with a 32-channel head coil. Two inversion recovery (IR) experiments and one saturation recovery (SR) experiment were performed obtaining an image of one transverse 5mm slice through the base of the genu and splenium of the corpus callosum (EPI readout, matrix size 128 x 128, scan duration ~80s). We also collected a 3D T1-MPRAGE (TR/TE/TI=3000/3.6/984ms, 1x1x1mm3 voxel) for warp referencing. IR experiments were performed with: (a) 3ms sinc-Gauss (SG) soft pulse tuned for full aqueous inversion (b) 10ms adiabatic hyperbolic secant (AHS), maximum amplitude=13.5μT, β=730s-1 11, bandwidth frequency modulation=1.34kHz. The SR experiment was performed with a 500ms rectangular pulse, flip angle=5 x 360°. 12 inversion delays (TI), defined as the time between the center of the inversion pulse and EPI excitation pulse, were selected between 5 and 5348ms. Repetition times (TR) were chosen as (TI + 5s) to allow for population equilibration between scans.Analysis: 3D T1 image data was used to create WM and region of interest (ROI) masks for the single-slice IR/SR data. The data was non-linearly registered to a standard brain (MNI152) using FSL’s fnirt12 so that the ROIs from the JHU White Matter Labels13 (Fig. 1A), cerebral WM (Fig. 1B), thalamus, putamen, and caudate (Fig. 1C) from the Harvard-Oxford subcortical structural atlas14 could be thresholded at 90% and registered to the data. Binary masks were hand drawn onto the single-slice IR data. Masked data were fitted to the mono- and biexponential Bloch relaxation equations using a non-linear least squares (NNLS) algorithm (‘lsqnonlin’, MATLAB) voxel-wise for each TI. Parameter values, T1,i, with corresponding component amplitudes, ai, are reported as mean ± standard error. Parameters generated with this technique were similar to those obtained by first averaging intensity across the ROI then fitting the averaged data although the histogram distributions were not strictly Gaussian.
Results
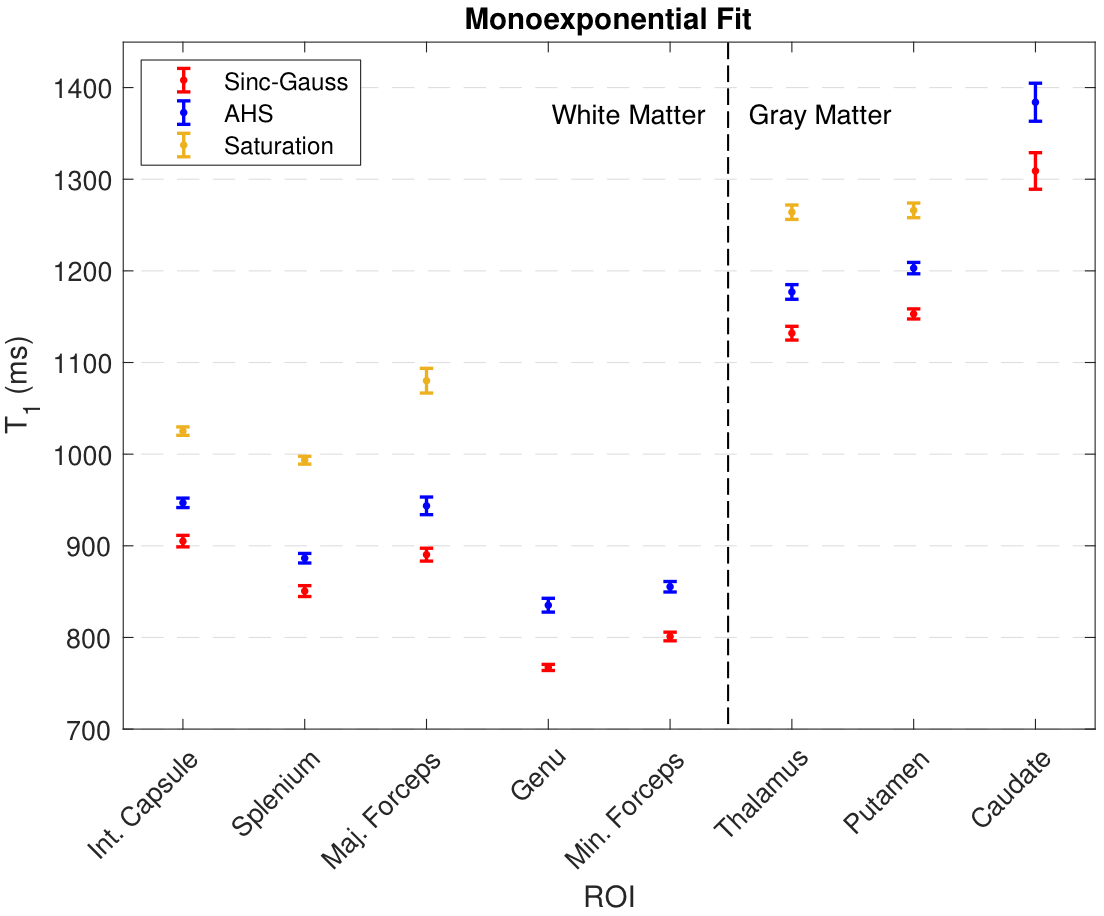
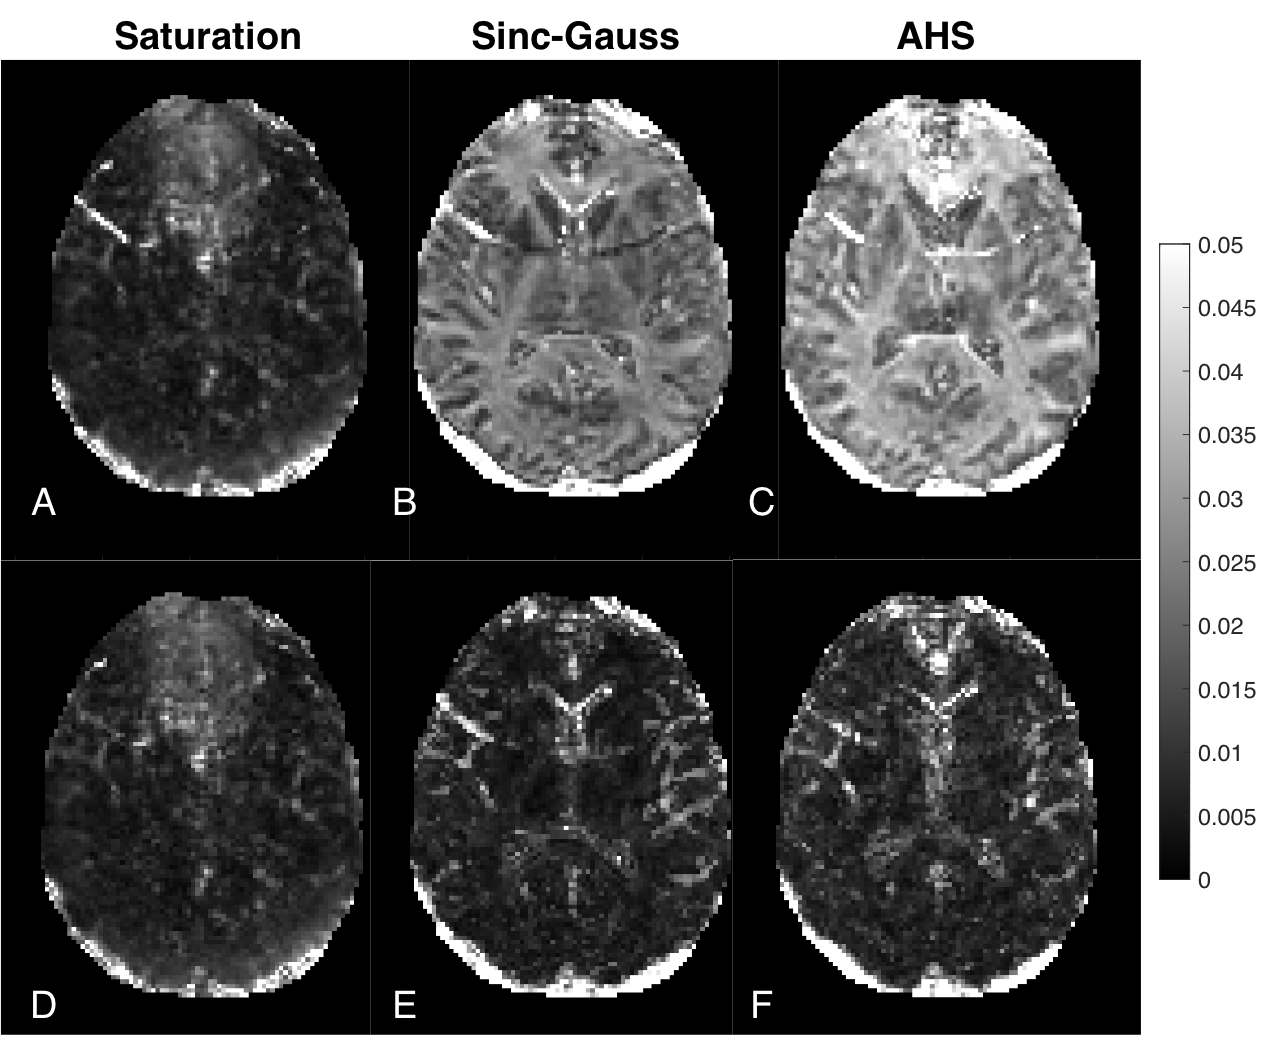
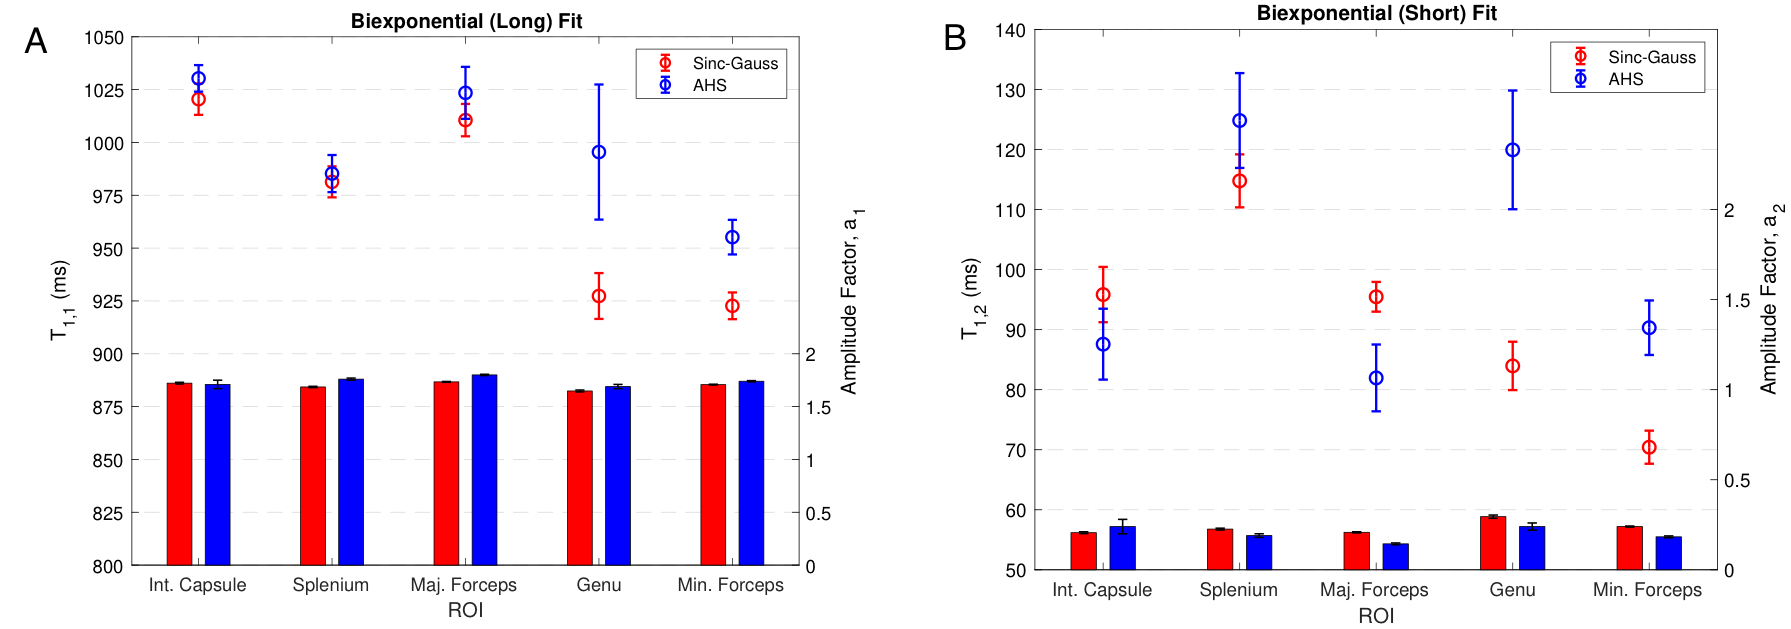
Voxel-wise fitting to a monoexponential relaxation function yielded the mean T1s in Fig. 2 and histograms shown in Fig. 3. SG inversion led to the most severe underestimation of T1 followed by the AHS inversion and SR sequence with the longest T1s across all ROIs. Using RMS misfit as a metric, Figs. 4A and 4D illustrate that the SR sequence produced the most nearly monoexponential relaxation, while WM structures were discernible from gray matter in the AHS and SG misfit maps with larger values in WM, due to its larger non-aqueous abundance.Fig. 5 plots AHS and SG T1 components along with corresponding amplitudes for each ROI in Fig. 1A. In the internal capsules and splenium of the corpus callosum, T1 components from each pulse have similar values, though marked discrepancy exists between ROIs with no obvious trend. Amplitudes a1 and a2 show little variation across the WM ROIs.
Discussion
The AHS and SG inversion pulses produced significant T1,2 components in the resulting relaxation. The accuracy of monoexponential Bloch modeling in the adiabatic case lay between that of the SR and SG inversion experiments. The SR data showed monoexponential relaxation, whereas biexponential fitting produced agreeing T1,2 parameters in the SG and AHS cases with lower amplitude, a2, in the latter. From this we see that the parameters of the biexponential vary with the initial state of the non-aqueous component. The SG and AHS sequences prepare the aqueous and non-aqueous components in different magnetization states; cross-relaxation/exchange results in the observed biexponential character.We suggest the SR sequence used here as an alternate method of measuring an accurate T1 in-vivo. Because the magnetization exchange time between semisolid and water protons is on the order of 100ms, the 500ms saturation time ensures that both aqueous and non-aqueous magnetization are nulled. Even though the effective amplitude range in SR is lower than for an IR sequence, our results show that this saturation sequence yields very nearly monoexponential relaxation and is straightforward to implement.
Conclusions
We demonstrated that adiabatic inversion of WM leads to significant biexponential T1 relaxation similar to that following a typical soft pulse. Understanding this effect led us to suggest a straightforward T1 assessment method using a ‘long’ saturation recovery sequence.Acknowledgements
No acknowledgement found.References
- Edzes HT, Samulski E. Cross relaxation and spin diffusion in the proton NMR of hydrated collagen. Nature. 1977;265(I):521–523.
- Prantner, AM, Bretthorst, GL, Neil, JJ, Garbow, JR, Ackerman, JJ. Magnetization transfer induced biexponential longitudinal relaxation. Magn. Reson. Med. 2008; 60: 555-563.
- Gochberg, DF, Gore, JC. Quantitative magnetization transfer via selective inversion recovery with short repetition times. Magn. Reson. Med. 2007; 57: 437-441.
- Barta, R, Kalantari, S, Laule, C, Vavasour, IM, MacKay, AL, Michal, CA. Modeling T1 and T2 relaxation in bovine white matter. Journ. Magn. Reson. 2015; 259: 56-67.
- Bjarnason, TA, Vavasour, IM, Chia, CLL, MacKay, AL. Characterization of the NMR behavior of white matter in bovine brain. Magn. Reson. Med. 2005; 54: 1072-1081.
- Kalantari, S, Laule, C, Bjarnason, TA, Vavasour, IM, MacKay, AL. Insight into in vivo magnetization exchange in human white matter regions. Magn. Reson. Med. 2011; 66: 1142-1151.
- van Gelderen P, Duyn JH. White matter intercompartmental water exchange rates determined from detailed modelling of the myelin sheath. Magn. Reson. Med. 2019;81(1):628–638.
- Seifert AC, Li C, Wilhelm MJ, Wehrli SL, Wehrli FW. Towards quantification of myelin by solid-state MRI of the lipid matrix protons. NeuroImage 2017;163(June):358–367.
- van Gelderen P, Jiang X, Duyn JH. Effects of magnetization transfer on T1. contrast in human brain white matter. NeuroImage. 2016;128:85–95.
- Reynolds LA, MacKay AL, Michal CA. Adiabatic inversion and T1 relaxation of bovine white matter. Proc. of ISMRM. 2019;28:0527.
- Tannús A, Garwood M. Adiabatic Pulses. NMR in Biomed. 1997;10:423-434.
- Jenkinson M, Beckmann CF, Behrens TEJ, Woolrich MW, Smith SM. FSL. NeuroImage 2012;62(2):782–90.
- Mori S. MRI Atlas of Human White Matter. Amsterdam, The Netherlands: Elsevier; 2005.
- Desikan RS, Ségonne F, Fischl B, Quinn BT, Dickerson BC, Blacker D, et al. An automated labeling system for subdividing the human cerebral cortex on MRI scans into gyral based regions of interest. NeuroImage 2006;31(3):968–980.
Figures