3073
A simple approach to control rms(B1) by pulse length in variable flip angle (VFA) T1 mapping of human brain1Medical Radiation Physics, Clinical Sciences Lund, Lund University, Lund, Sweden
Synopsis
Controlling the saturation of bound magnetization in variable flip angle (VFA) experiments improves the derived parameter maps. Instead of using special CSMT RF pulses, we kept the rmsB1 constant simply by increasing the RF pulse duration with the square of the flip angle. At 3T, VFA T1 mapping of human brain thus showed better compliance to the Ernst equation than at constant pulse duration or B1 amplitude, but yielded shorter T1.
Introduction
Magnetization transfer (MT) effects in mapping T1 or T2/T1 varying the flip angle (VFA) in fast low-angle shot (FLASH) or balanced steady-state free precession (bSSFP) sequences can be stabilized via the average absorption of RF by the “invisible” motionally restricted macromolecular protons1. Such “controlled saturation magnetization transfer” (CSMT) can be achieved by complementing the root-mean-square of B1 by adding off-resonance sidebands to the RF pulse1. As such RF pulses are not readily available on clinical scanners, we suggest controlling rmsB1 by pulse duration (PL). This is compared to schemes where RF duration or B1peak is hold constant in VFA T1 mapping of human brain at 3T.Theory
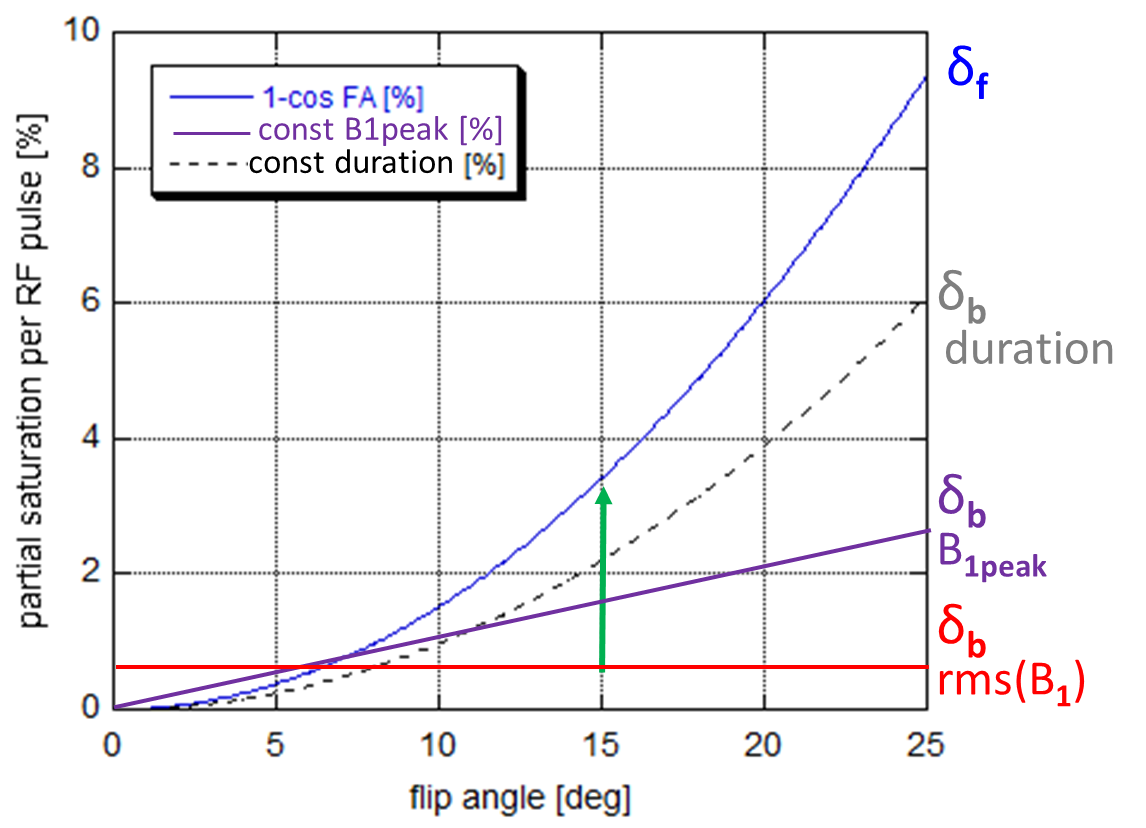
For a given RF pulse shape and flip angle (FA), the rmsB1 of an RF pulse is proportional to FA2/PL, which can be kept constant by increasing PL with FA2. If PL is constant, rmsB1 increases with FA2. For constant peak B1, rmsB1 increases with B1peak*FA. Absorption of RF will impose varying partial saturation to the bound pool, which -- compared to 1–cos(FA) created by the FA on free pool (Figure 1) -- will lead to MT to or from the free pool that influence the steady state signal2.Methods
Measurements were performed on a 3T MAGNETOM Prisma using a 20-channel head-neck coil (Siemens Healthcare, Erlangen, Germany) using a prototype sequence that allowed setting the pulse duration. A healthy male subject (29y) and an agarose phantom (inversion recovery T1 = 1050ms) were investigated. Sagittal non-selective volumes of 1.25 mm3 isotropic resolution (240x232x180 mm3) were acquired at TE/TR=3.78/10ms in 1:30 minutes using partial Fourier and GRAPPA acceleration. The flip angle of a rectangular pulse was varied through 2°, 3°, 4°, 5°, 6°, 8°, 10°, 12° and 15°, while recording the peak voltage. Three cases were investigated:A) constant rmsB1: A chosen minimum PL of 24us for 2° was increased to 1800us for 15°. The peak voltage was less than 25% of the hardware limit allowing for 4 times higher FA or 2 times shorter PL.
B) constant B1peak: PL was varied from 80us to 600us (kept within the range of A).
C) A constant PL of 400us was chosen, to keep peak voltages within the range of A.
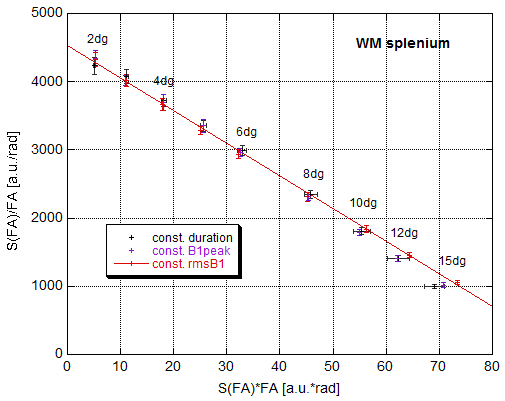
The VFA signals S(FA) were plotted as Y=S(FA)/FA over X=S(FA)*FA (FA in radian) to enhance signal bias by deviation from a straight line3. Signal amplitude and T1 were obtained by linear regression. The MR system’s B1+ mapping based on multi-slice saturation recovery4 was used to account for local flip angles deviating from the nominal value.
Results and Discussion
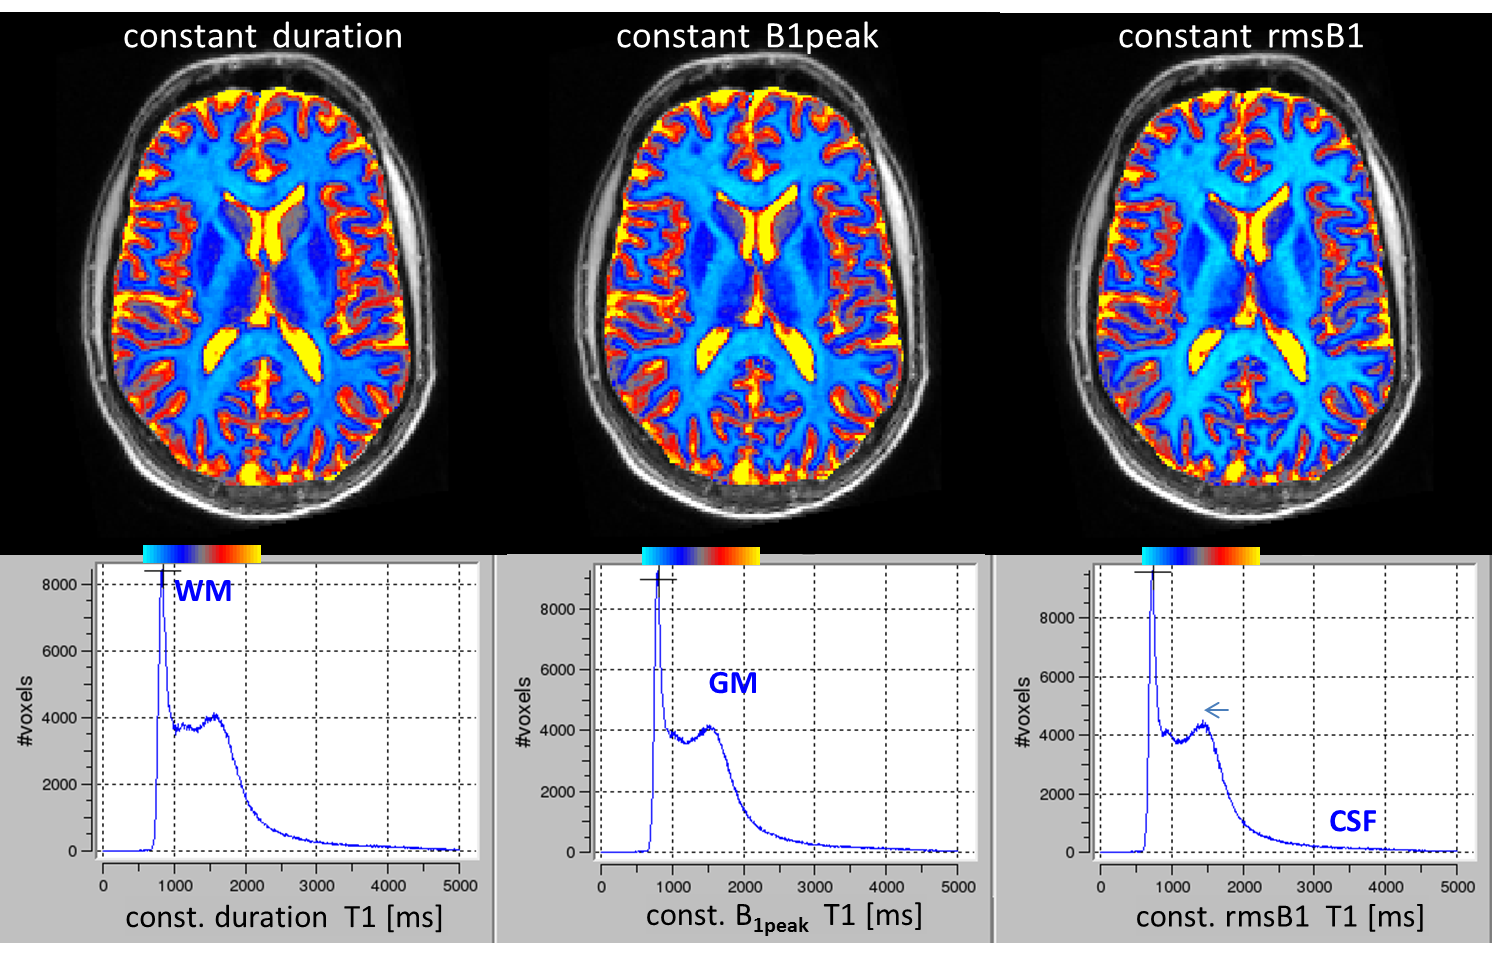
At constant rmsB1, the VFA signals followed the Ernst equation, that is, a straight line in Figure 2, better than at constant PL or constant B1peak. This is in line with results using CSMT pulses1. Specifically, the latter showed lower signal at higher FA, where the saturation of the bound pool increases.After each RF pulse, more magnetization will be transferred from the free to the invisible pool, resulting in a lower steady state. In turn, the T1’s obtained with constant rmsB1 tended to be lower (Figure 3). Even at very long pulse lengths of 1800ms, effects of large B0 offset were not observed orbito-frontally at 3T.
This proof-of-principle suggests that it can be extended to higher flip angle and use of sinc pulses. Further investigations of incidental MT-effects on T1 mapping by VFA will be compared to MP-RAGE based isotropic maps of T1 obtained from fitting the inversion recovery, which has been specifically developed for the purpose of revealing spatial bias (abstract submitted),
Conclusion
By simply increasing the RF duration with the square of the FA, MT effects can be controlled in VFA, reducing systematic signal deviation, but leading to lower T1 estimates.Acknowledgements
The sequence was kindly provided by Dr A. Lutti, University of Lausanne, Switzerland. Funding by the Swedish Research Council (NT-2014-6193) and local support by Dr. F. Testud, Siemens Healthcare Sweden, is gratefully acknowledged.References
1) Teixeira RP AG, Malik SJ, Hajnal JV. Fast quantitative MRI using controlled saturation magnetization transfer. Magn Reson Med 2019;81:907-920.
2) Al-Abasse Y, Helms G. Influence of pulse length and shape on variable flip angle T1 mapping of the human brain. Proc ISMRM. 2016;24:696.
3) Helms G, Dathe H, Weiskopf N, Dechent P. Identification of signal bias in the variable flip angle method by linear display of the algebraic Ernst equation. Magn Reson Med 2011;66:669-677.
4) Chung S, Kim D, Breton E, Axel L. Rapid B1+ mapping using a preconditioning RF pulse with TurboFLASH readout. Magn Reson Med 2010;64:439-446.
Figures